


Against a backdrop of the rising prominence of Electric Vehicles (EVs), automaking giant Tesla, Inc. (TSLA) is expected to post its fourth-quarter results tomorrow. The company already reported delivering approximately 1.81 million vehicles last year, indicating a 38% year-over-year growth.
However, TSLA’s decision to cut prices on its popular Model Y vehicles, aligning with the price war it has initiated in the EV market, has weighed on investor sentiments. The stock closed its last trading session at $208.80, lower than the 50-day moving average of $237.49 and 200-day moving average of $231.68.
Furthermore, Morgan Stanley analyst Adam Jonas cut TSLA’s price target from $380 to $345, which is a significant drop. Jonas anticipates TSLA’s 2024 volume and profitability outlook to be modest.
The company also faces increasing competition from other automakers. Amid this, TSLA would have to stall production at its German factory from January 29 to February 11 as vessel attacks in the Red Sea have led to a lack of components supplied through that route.
Another question clouding the company’s outlook is Chief Executive Elon Musk stating that he would be uncomfortable growing TSLA as an Artificial Intelligence (AI) leader if he did not have 25% voting control.
Given this situation, let’s look at the trends of TSLA’s key financial metrics to understand why it might be wise to exercise caution and avoid the stock now.
Analyzing Tesla's Financial Performance: From March 2021 to September 2023
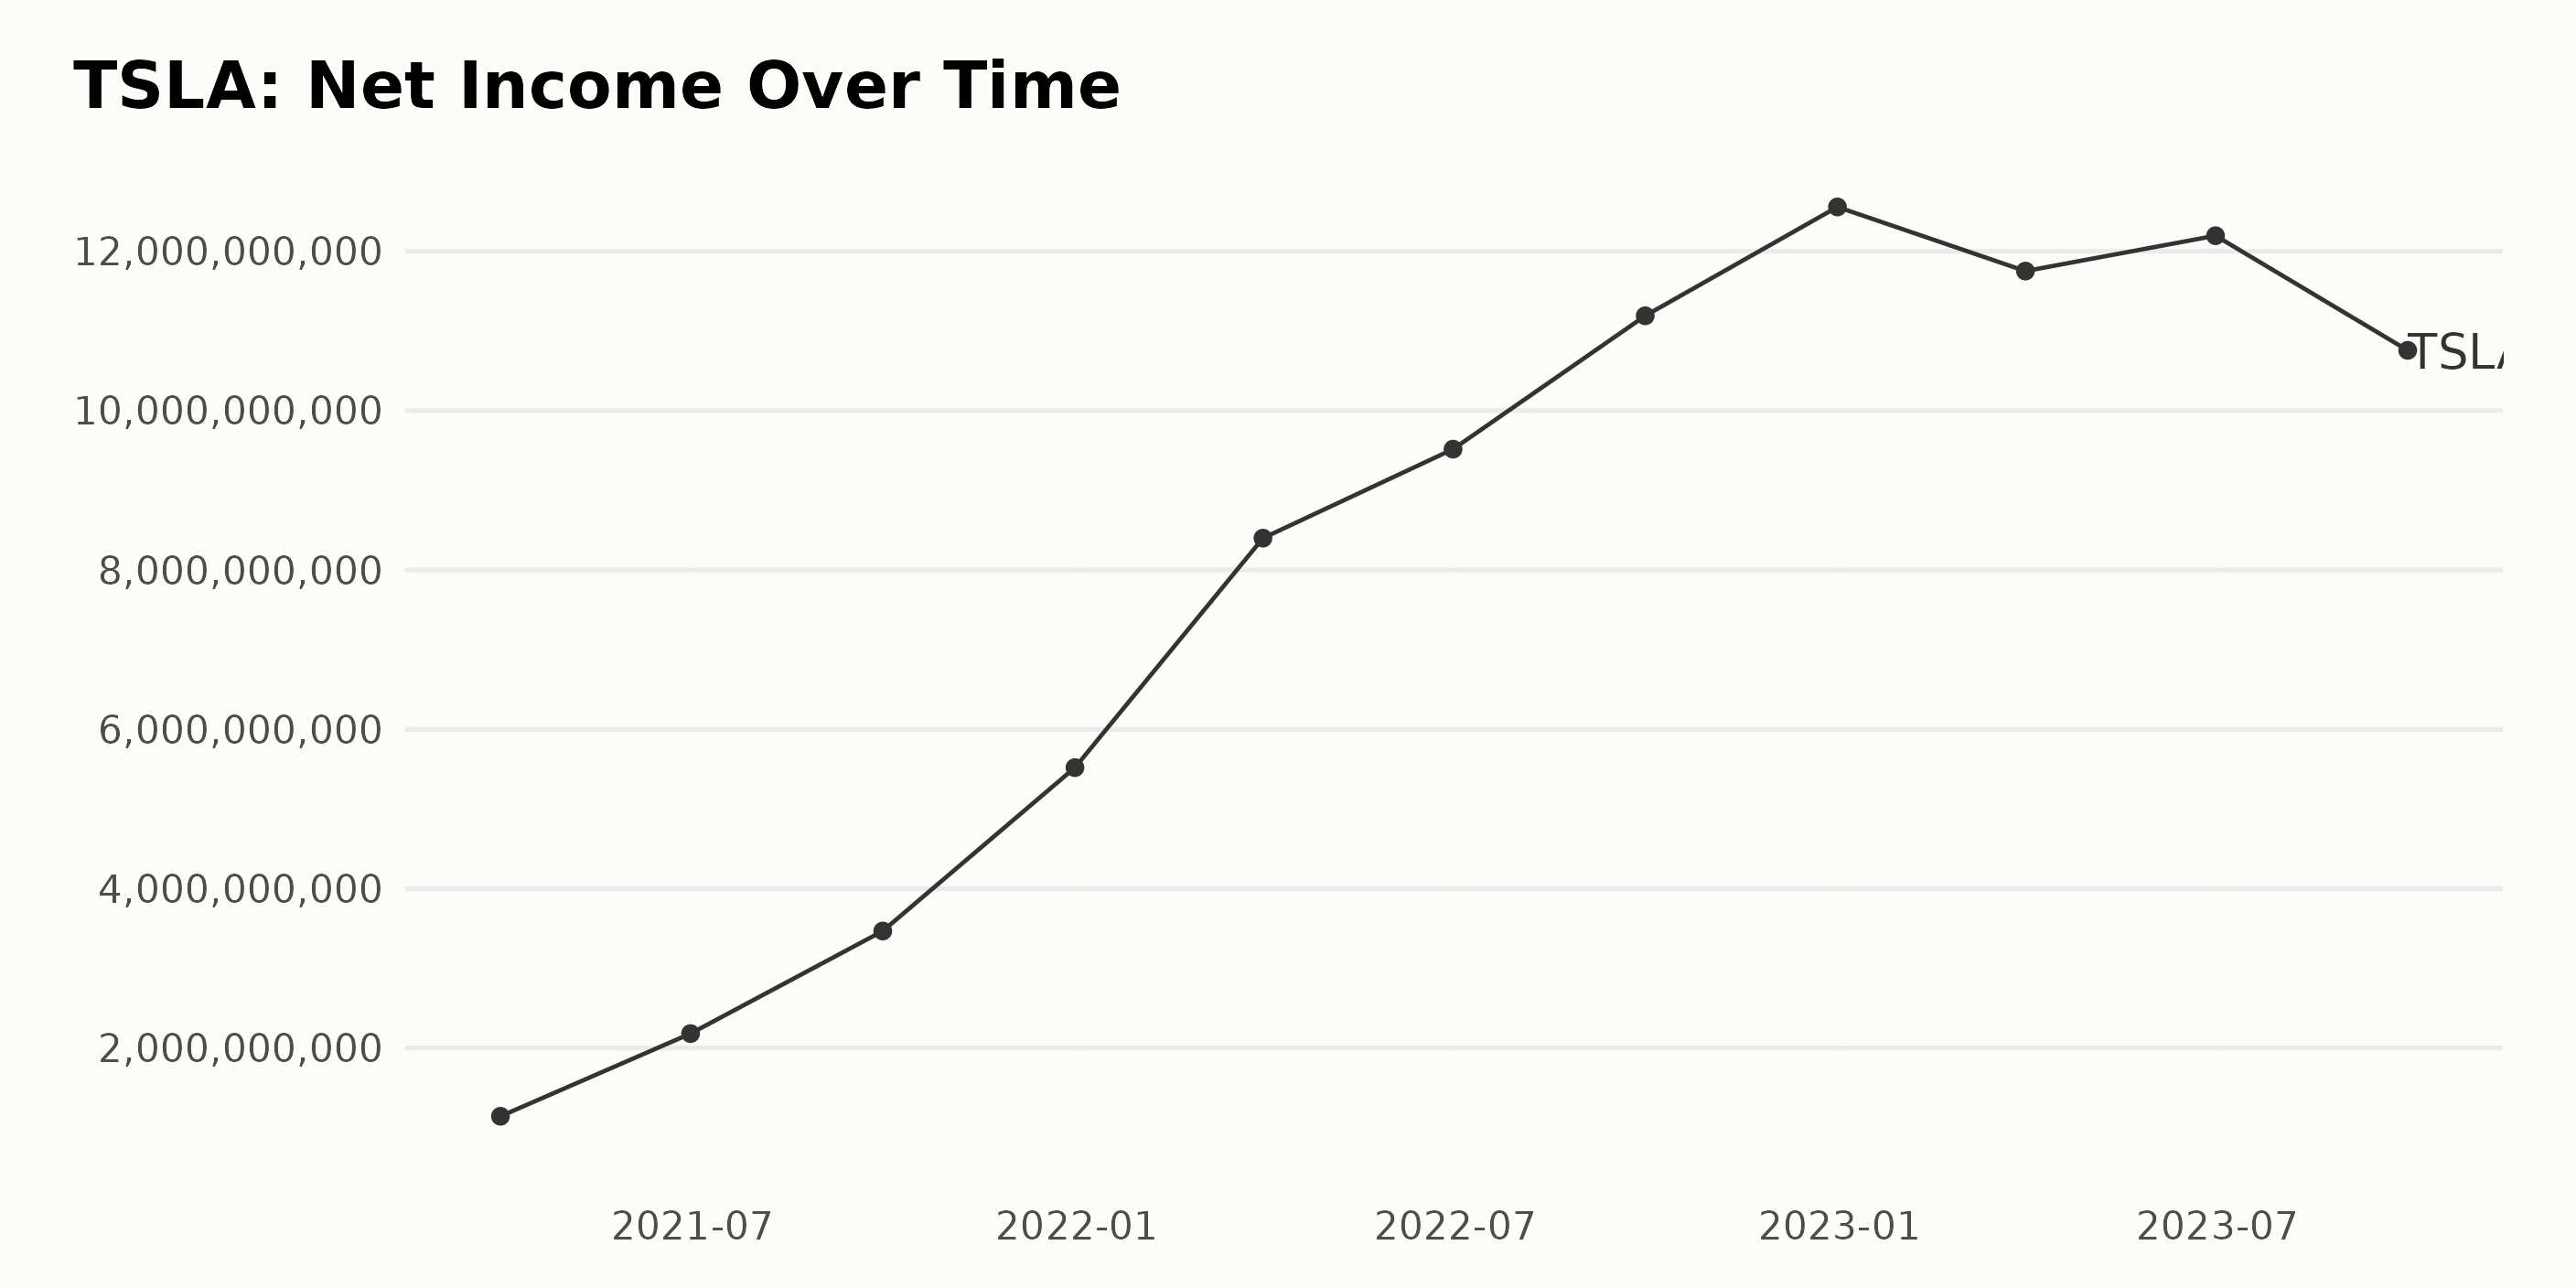
The trend and fluctuations of the trailing-12-month net income of TSLA from March 2021 to September 2023 can be summarized as:
- Moving through the first and fourth quarter of 2021, there is a steady increase in net income. TSLA's net income grew from $1.14 billion in March 2021 to $2.18 billion in June 2021, then further to $3.47 billion by September, and finally hit $5.52 billion by the end of December.
- In the first quarter of 2022, the net income ascended substantially to $8.4 billion and continued to climb to around $9.52 billion toward the end of June 2022.
- There was a significant hike in the third quarter of 2022, where net income swelled to $11.19 billion. By the close of the year 2022 (fourth quarter), net income surged to an apex of $12.56 billion.
- In the following year, specifically in the first quarter of 2023, there is a minor dip to $11.75 billion. However, the net income rebounded somewhat in the second quarter, reaching $12.20 billion.
- In the third quarter of 2023, the net income again primarily lessens, settling at $10.76 billion. This marks the conclusion of the series.
From this data series, it's clear that TSLA's net income has been on a general upward trend from March 2021 to December 2022, with fluctuations in 2023. The growth rate, computed by assessing the final value from the first, indicates an expansion of approximately $9.64 billion. Please note that greater emphasis has been placed on more recent data in accordance with the given instructions.
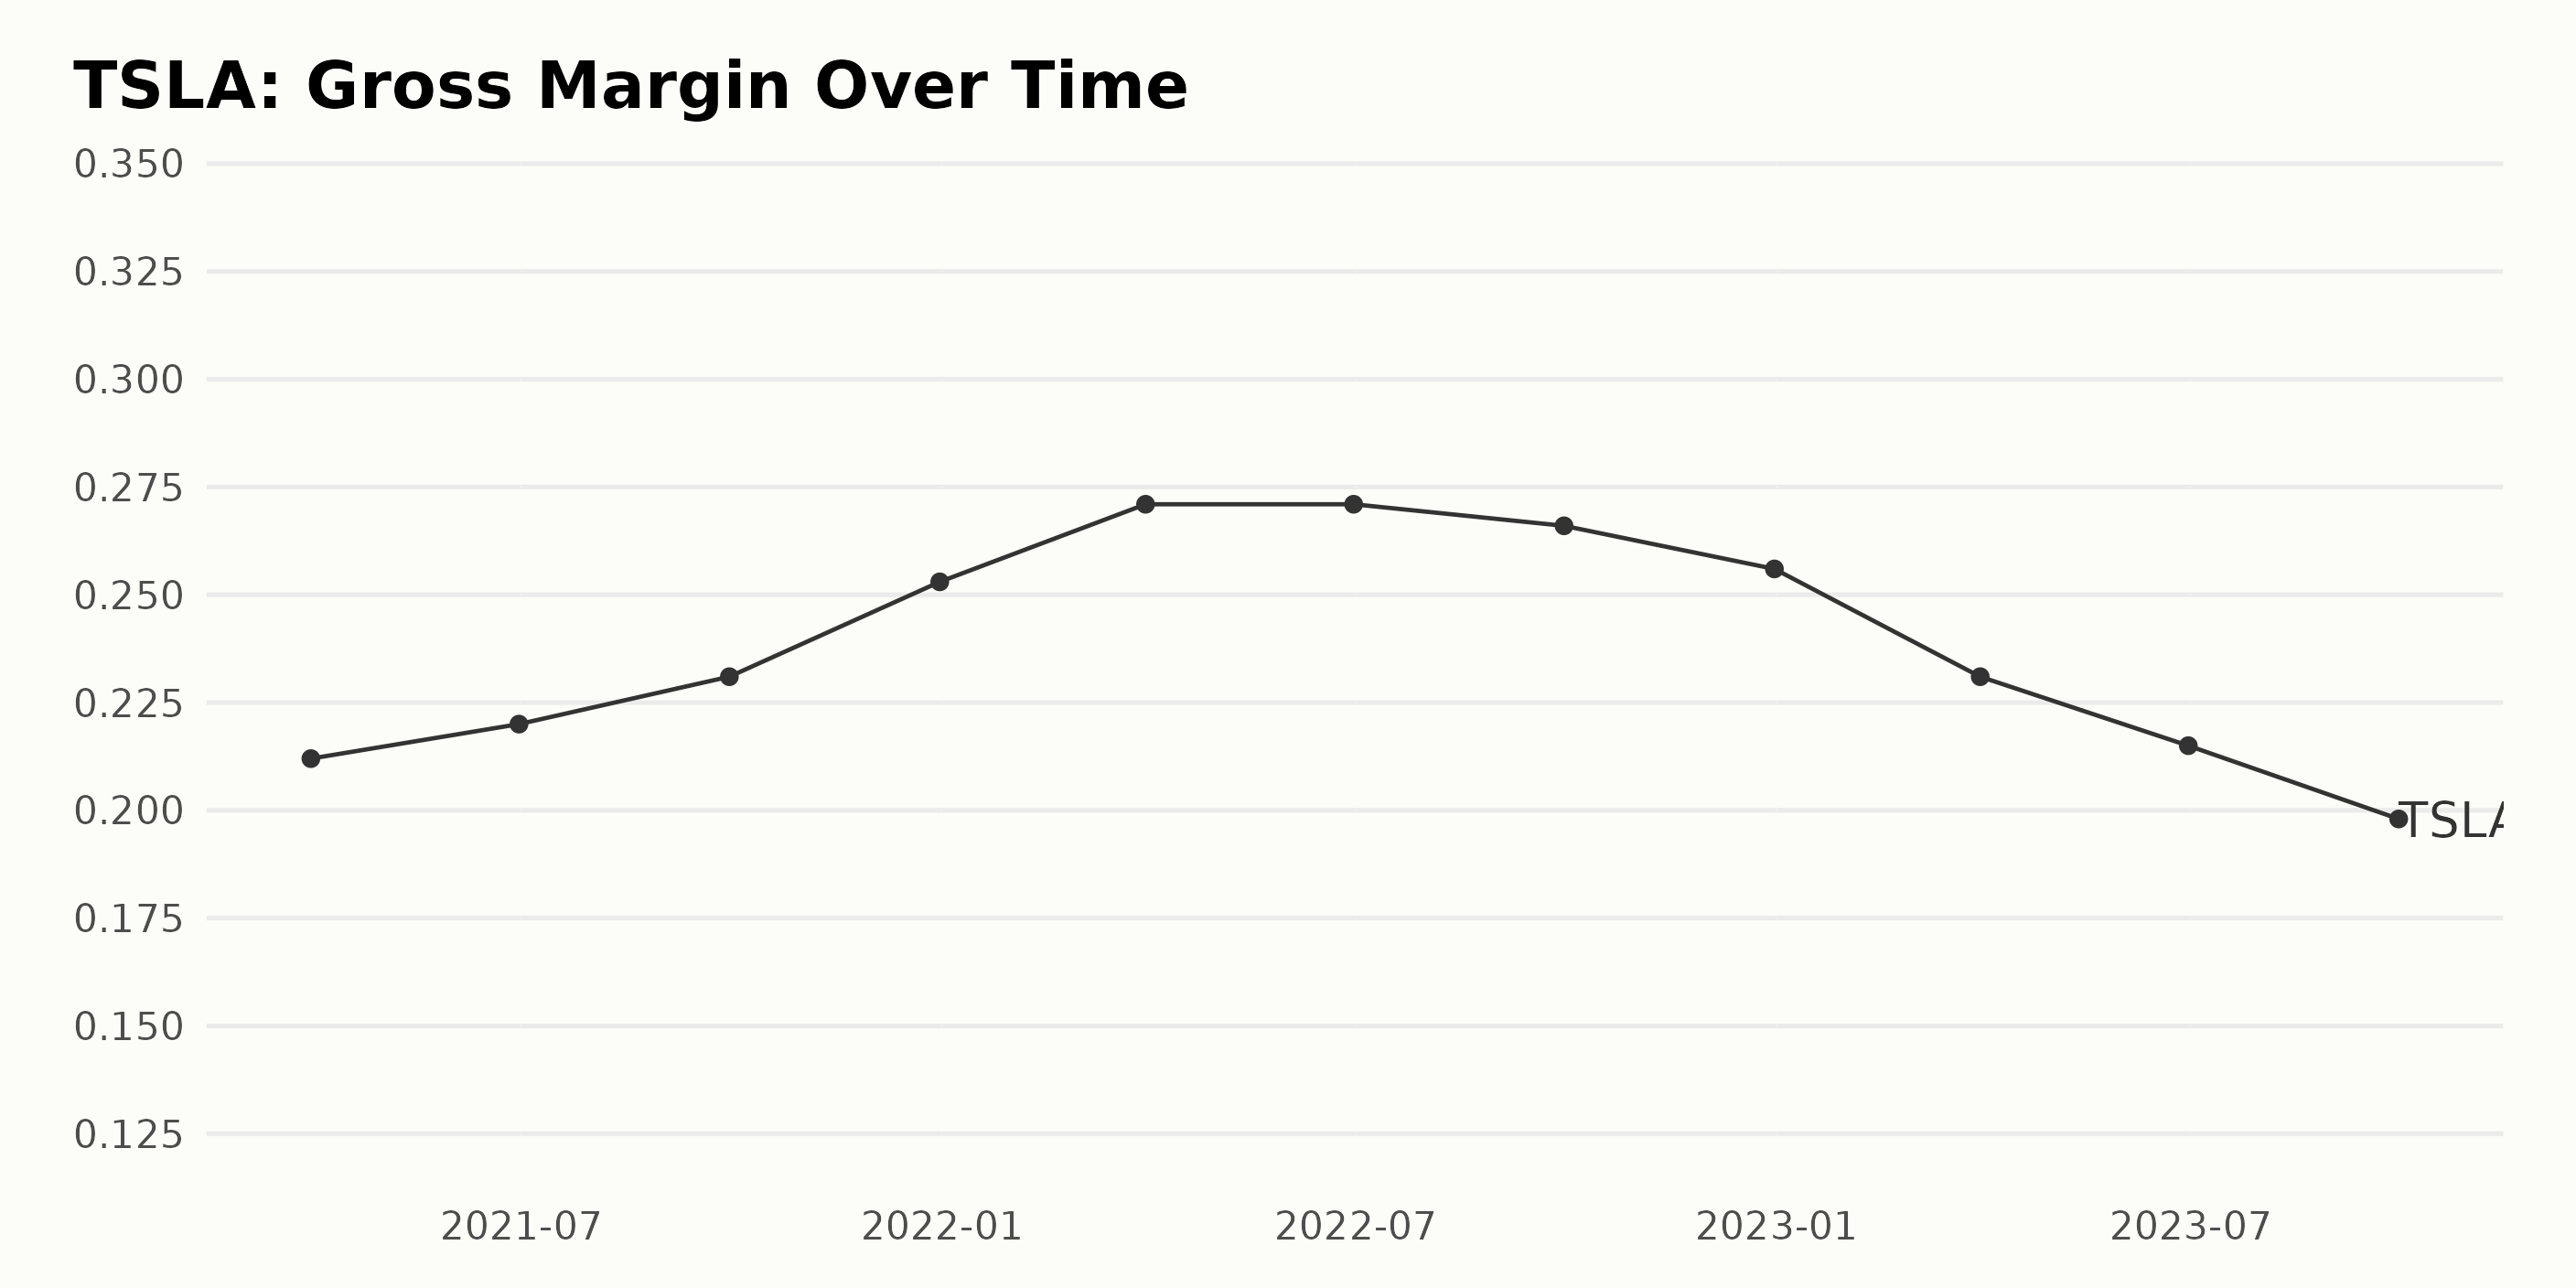
The reported gross margin of TSLA indicates a general increasing trend from the start to the middle of the series (March 2021 to June 2022). This period observed the gross margin improving from 21.2% in March 2021 to a peak of 27.1% by June 2022. However, after this period, a consistent downward trend is evident, with the gross margin decreasing from 27.1% in June 2022 to 19.8% by September 2023. Key notes:
- March 31, 2021 had a gross margin of 21.2%.
- June 30, 2022, saw the highest gross margin in the series at 27.1%.
- September 30, 2023, marked the end of the series with a gross margin falling to 19.8%.
The growth rate of the gross margin, taking the last value from the first value, was negative, which indicates a decrease, though there were periods of increase in the initial part of the series.
The overall trend showcases a decline in the gross margin for TSLA from mid-2022 to late 2023. This suggests an increased cost of goods sold or decreased net sales during this latter period. It’s crucial for stakeholders to monitor these shifts over time to evaluate business performance and adjust strategies accordingly.
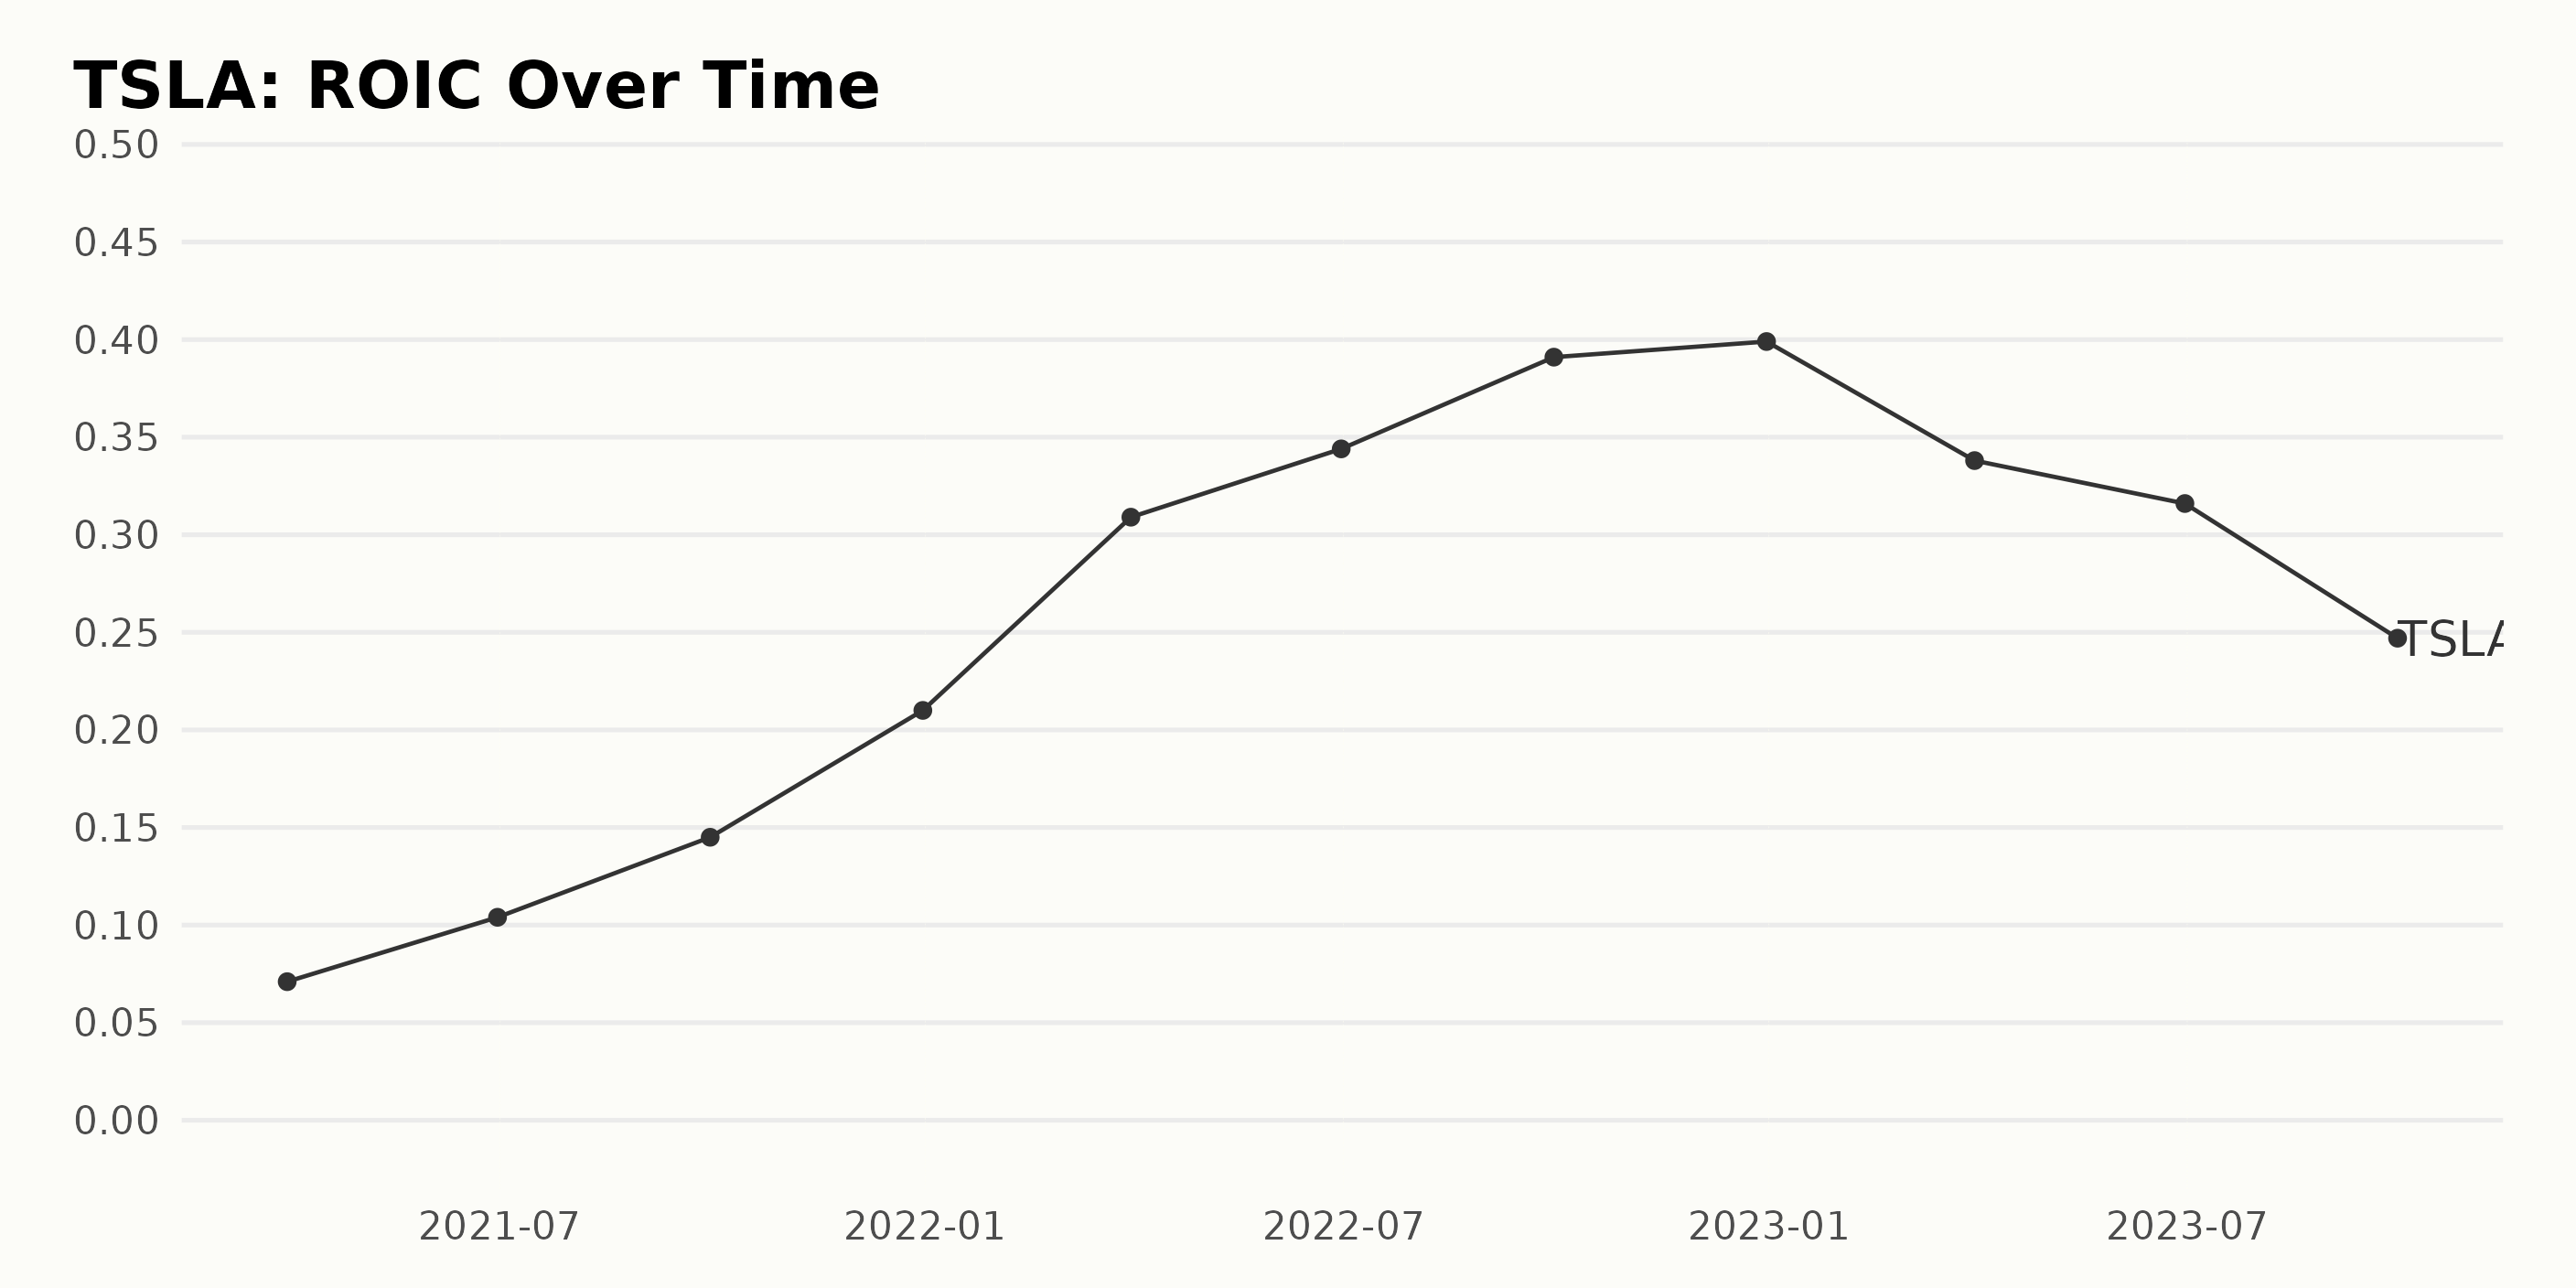
The ROIC (Return on Invested Capital) trend for TSLA shows a fluctuating pattern over the period given. Here's a brief overview of the trend and fluctuations:
- Starting from a relatively low 7.1% in March 2021, the ROIC experienced a growth spurt throughout 2021, ending the year at 21%. This signifies a remarkable increase.
- The growth rate skyrocketed in the first half of 2022, with the ROIC hitting a peak of 39.9% by the end of the year.
- However, the trend began to decline in 2023. The ROIC fell to 33.8% in March, then further dropped to 24.7% by September, its most recent value.
In taking into account the first and last available values, TSLA’s ROIC has grown from 7.1% in March 2021 to 24.7% in September 2023, representing a sizable growth rate.
Emphasizing the more recent data, there appears to be a reverse in the previous upward trend. Transitioning from the fourth quarter of 2022 to the third quarter of 2023, the ROIC reduced, potentially indicating a negative change in the company's profitability in this last quarter.
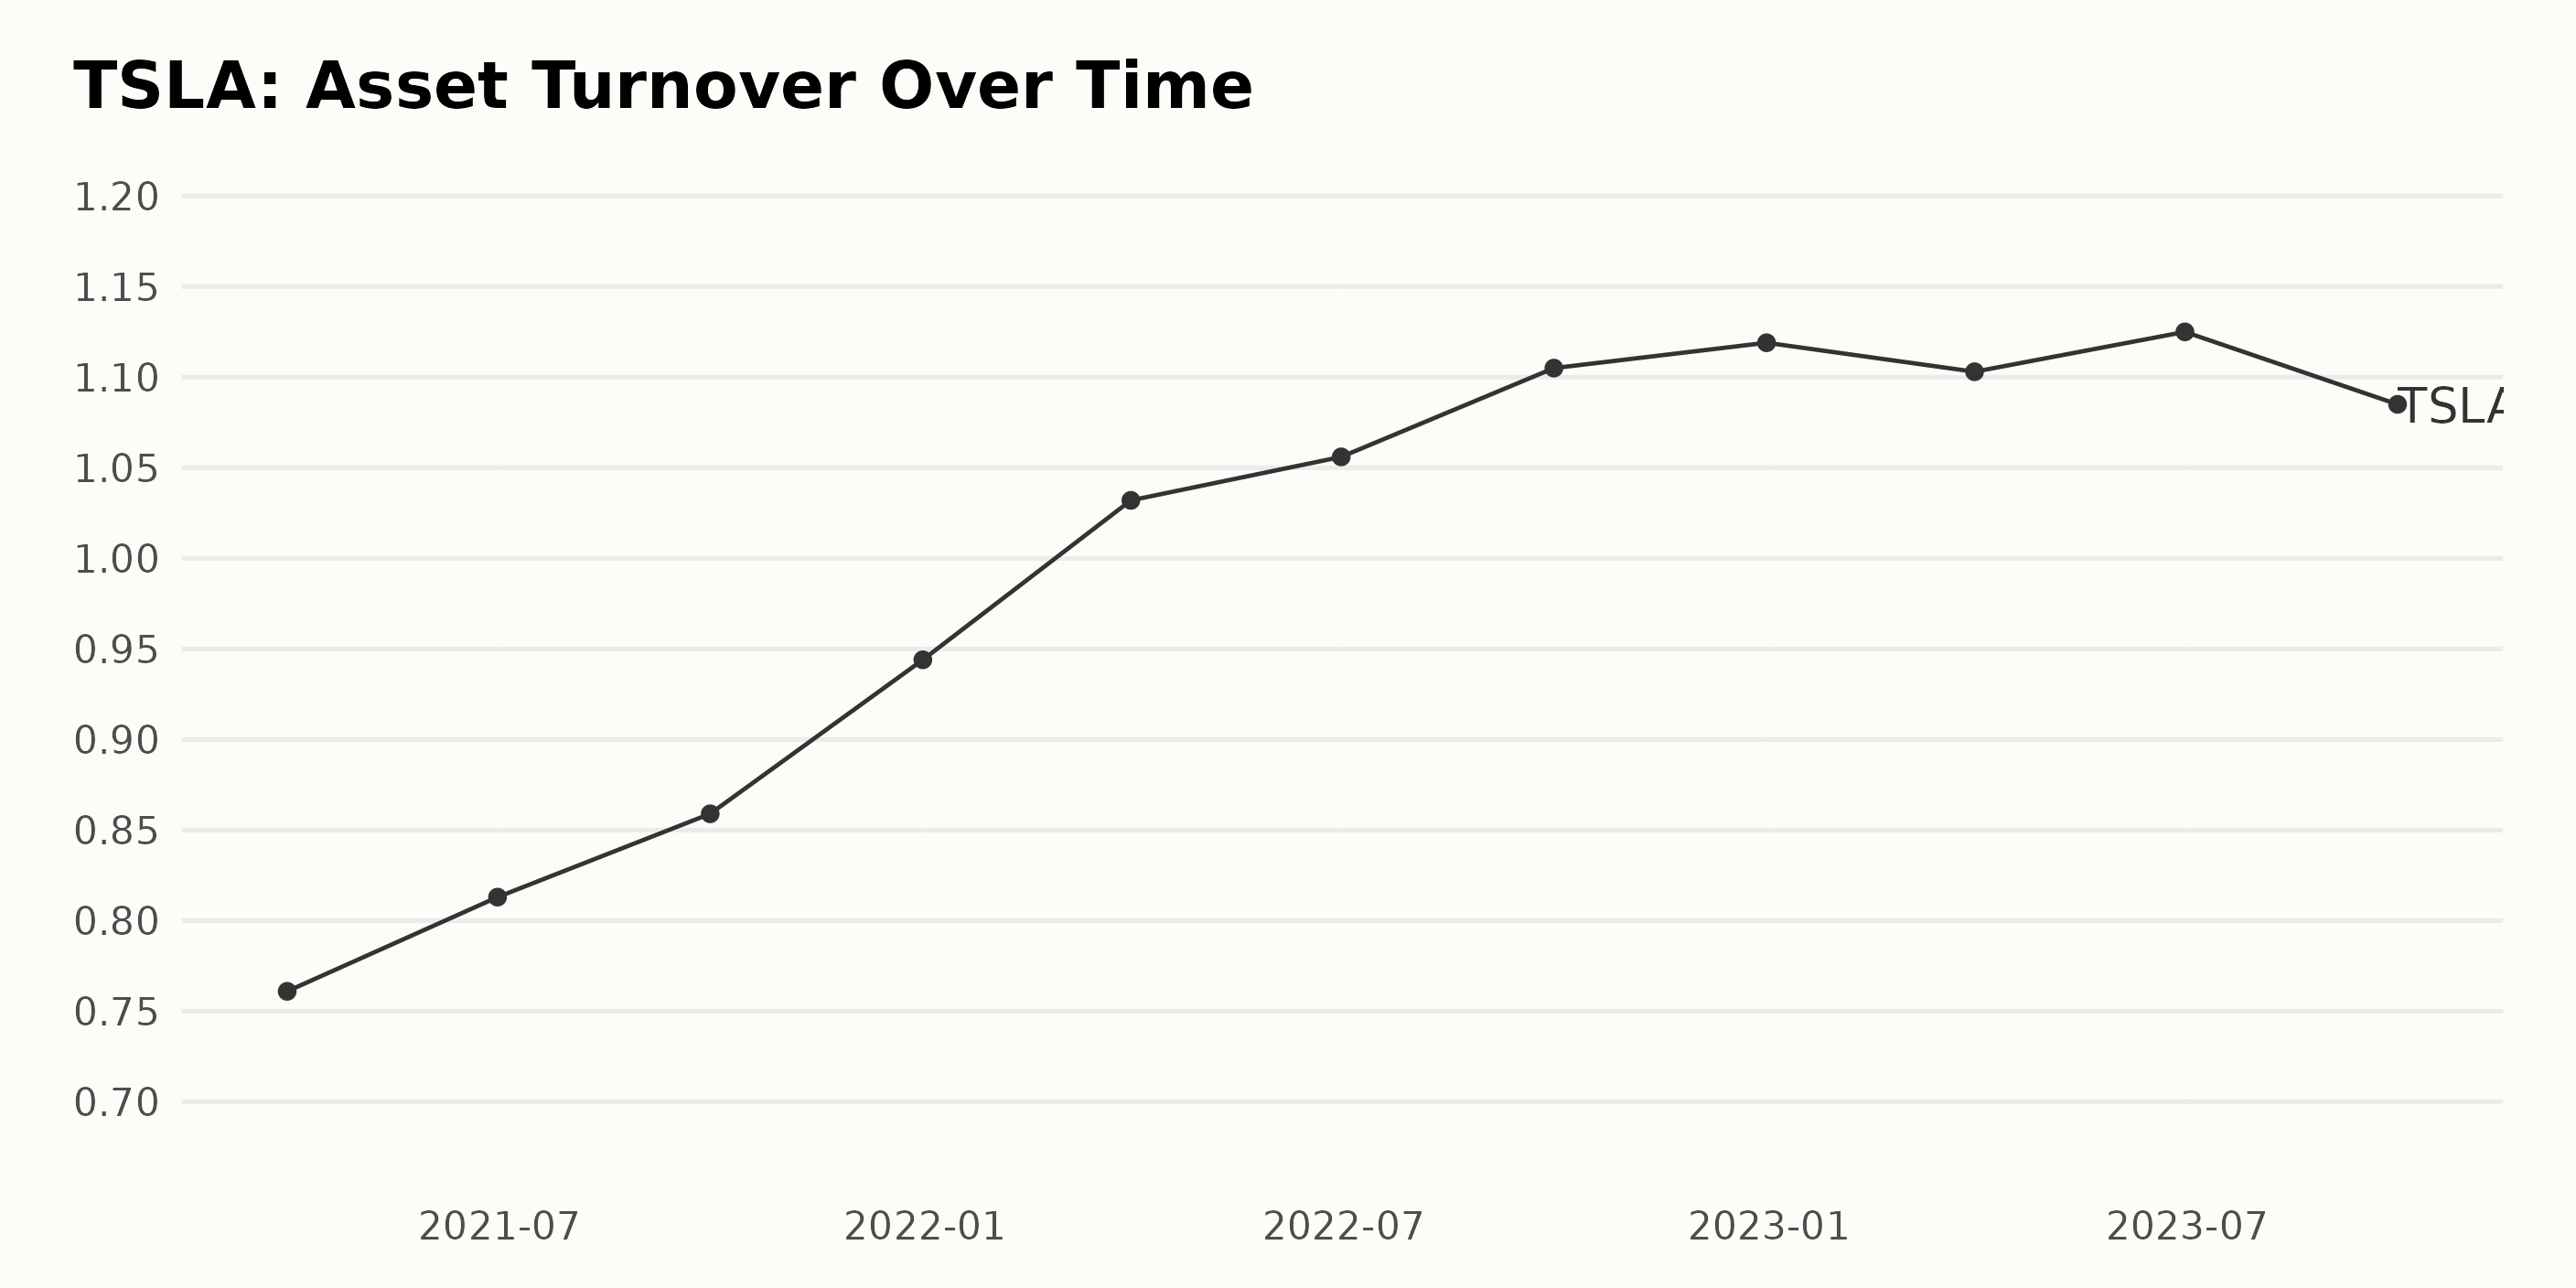
Here is an analysis of the asset turnover trend of TSLA based on the provided series data:
- The asset turnover for TSLA shows a consistent upward trend from March 2021 to December 2022, indicating improved efficiency in using the company's assets to generate sales throughout the period.
- At the start of the series in March 2021, the asset turnover was reported at 0.76. It rose incrementally every quarter, reaching 0.94 by December 2021. This steady increase signifies a 24% growth within this period.
- In March 2022, the asset turnover value reached over 1.0 for the first time, noting an ability to match and exceed sales to its total asset base. By June 2022, it slightly increased to 1.056 but then accelerated to 1.119 by the end of 2022.
- The overall positive growth of the asset turnover continued until it peaked at 1.125 in June 2023. The growth rate from March 2021 to its peak is approximately 47%, displaying a remarkable enhancement in the utilization of assets for generating sales.
- However, the series saw a subtle fluctuation in September 2023, as the asset turnover dipped to 1.085. Although still performing significantly better than earlier periods, this suggests a slight decline in the progress seen.
- Paying closer focus on the most recent data, the last value in the series, from September 2023, marks a decrease when compared to that of June 2023. From a broader perspective, though, it signifies a 43% growth from the beginning of the period covered by the series.
In conclusion, TSLA has demonstrated improvements in maximizing the usage of its assets to deliver sales. Despite the recent fall, the overall trend has remained positive, with remarkable growth over time.
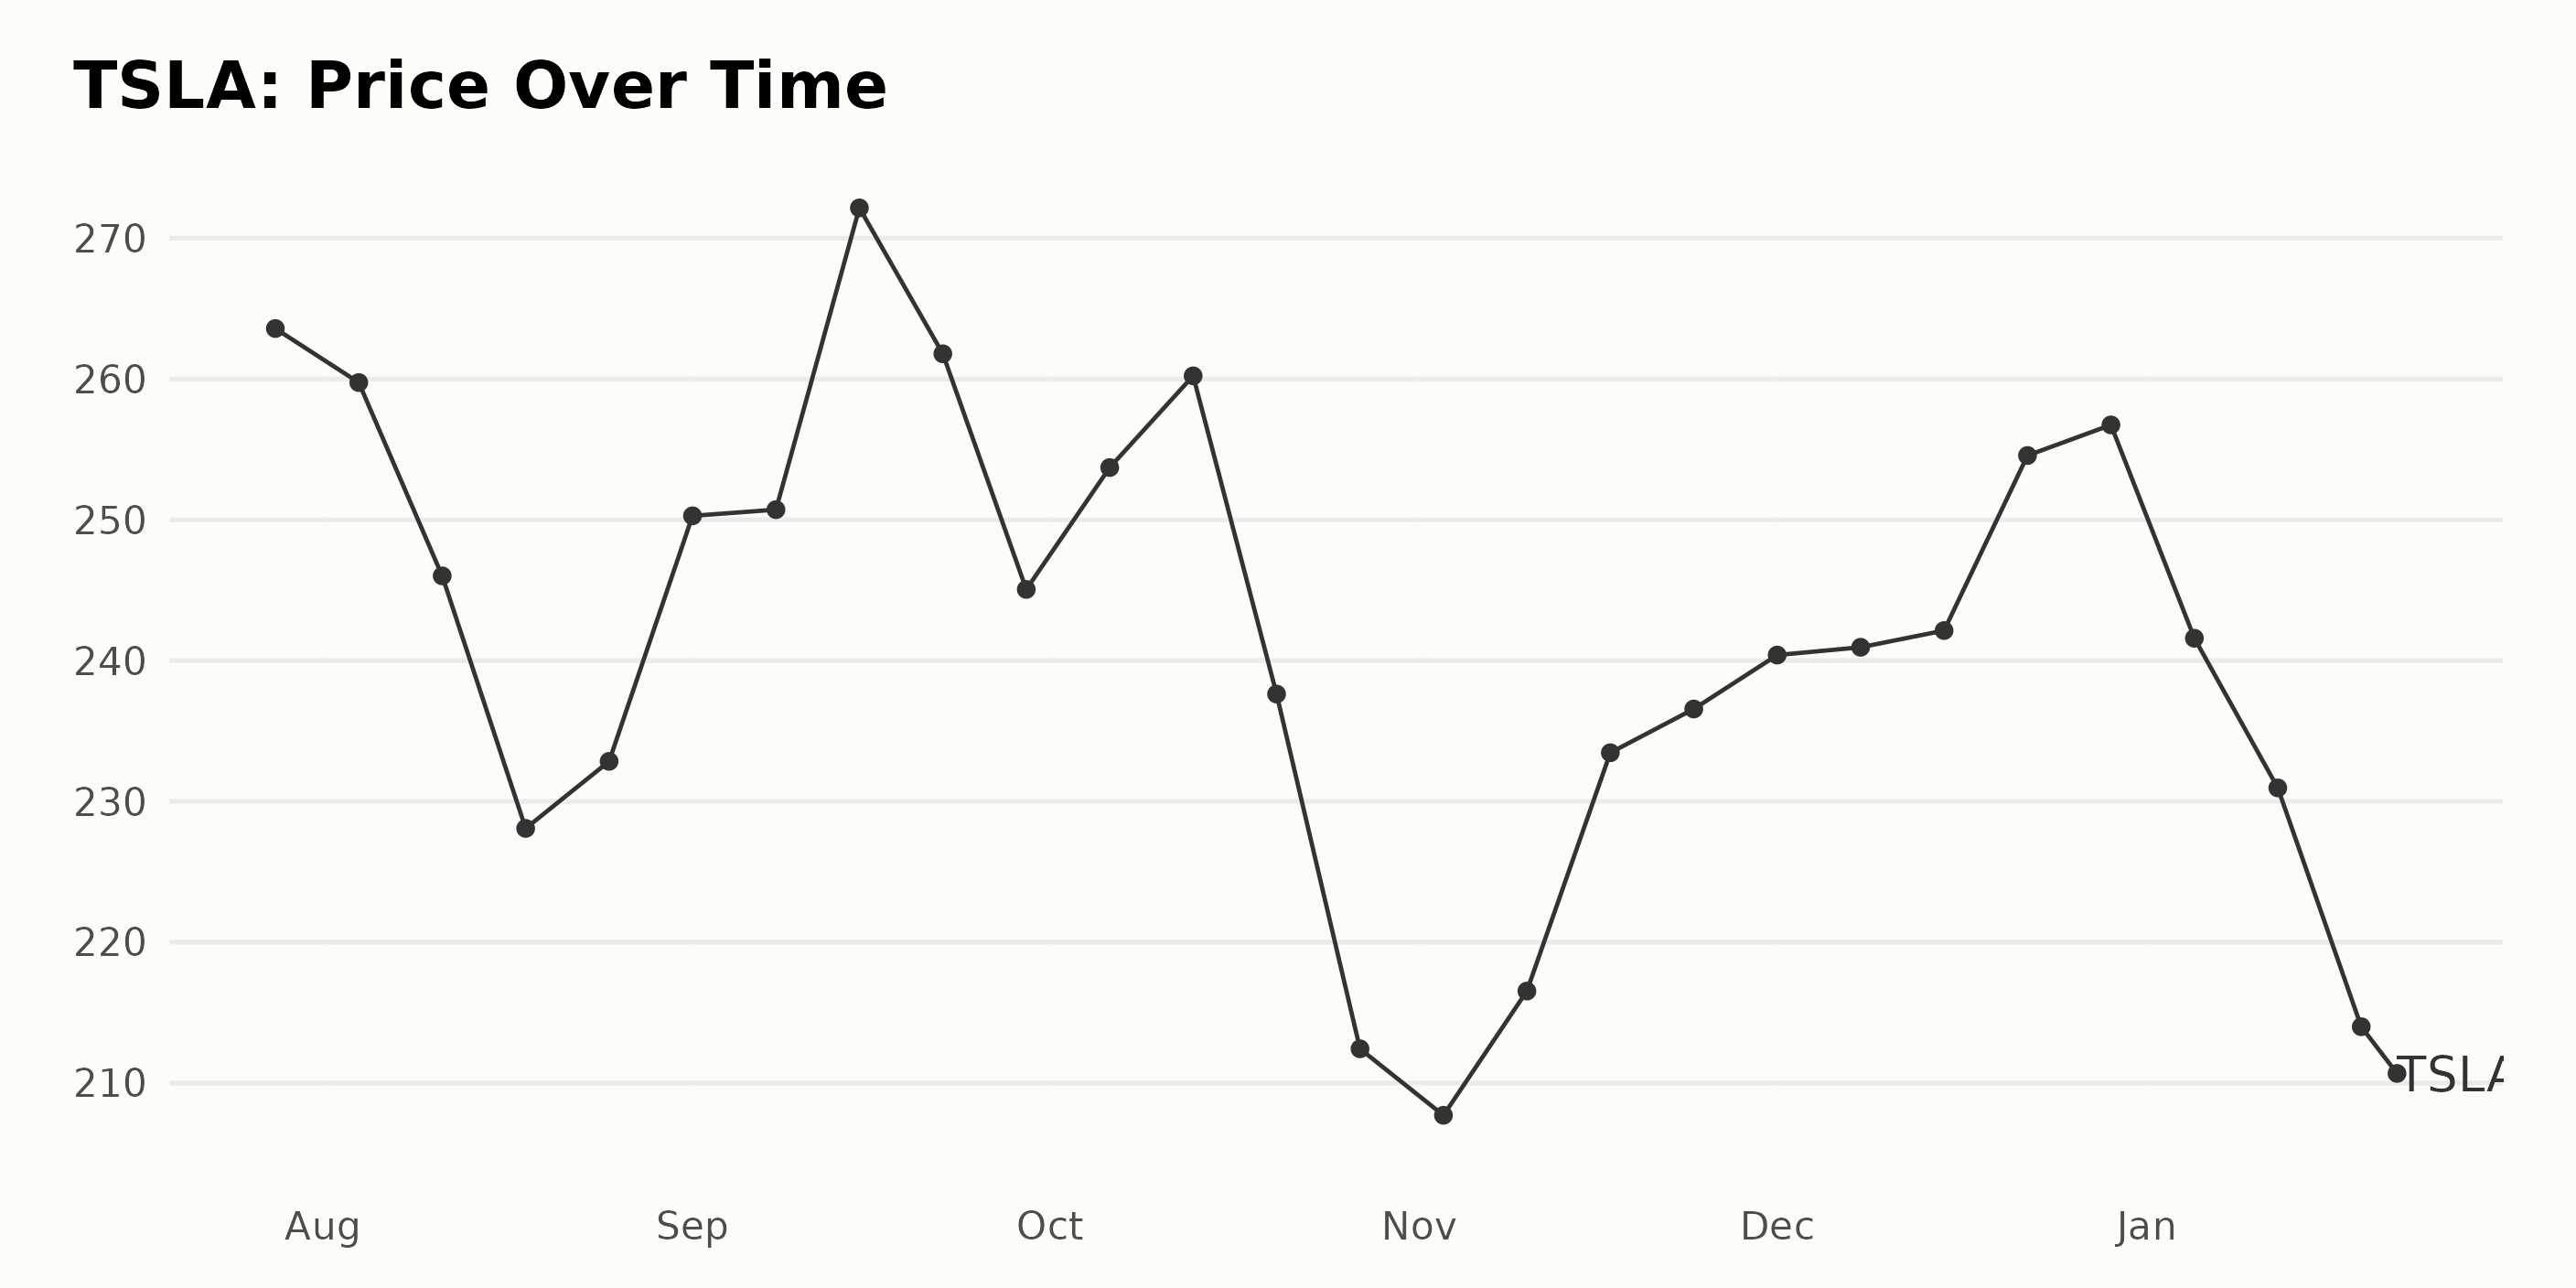
Analyzing Tesla's Share Price Fluctuations from July 2023 to January 2024
The data represents the share price of TSLA from July 28, 2023, to January 22, 2024.
- On July 28, 2023, the share price was $263.59
- On August 4, 2023, the share price decreased slightly to $259.75
- The company experienced a continuous decrease in share price during August 2023, hitting a low of $228.08 on August 18, 2023, but rebounding to $232.84 by August 25, 2023.
- In September 2023, Tesla saw its share price rise and fell within the month, peaking at $272.15 on September 15 before falling to $245.06 on September 29.
- During October 2023, there seems to be an unstable trend with peaks and troughs. The highest recorded price for this month was on October 13, 2023, with a value of $260.22. However, the lowest recorded price of $212.43 was observed on October 27, 2023.
- November witnessed an upward trend in the share price, beginning at $207.71 on November 3 and rising to $236.56 by November 24.
- The last month of 2023 showed a steady growth in TSLA’s share prices. A consistent increase can be observed from the start of December, $240.39, up until its end, $256.74.
- However, this growth slowed down and started declining in January 2024, dropping to $208.80 on January 22.
From the above description, it is evident that there are fluctuations in TSLA's share price over the period represented. However, there is a general trend of drop in share price from July 2023 to January 2024, with intermittent periods of increase. Here is a chart of TSLA's price over the past 180 days.
Tracking Tesla's POWR Ratings: An Analysis of Quality, Momentum, and Growth
TSLA, an esteemed company in the Auto & Vehicle Manufacturers category of stocks, has observed several fluctuations in its POWR Ratings grade and rank in the category over the span of several months. Here are some notable points:
- On July 29, 2023, TSLA had a POWR grade of C (Neutral), and it ranked 39th out of the 52 stocks in its category.
- Throughout August and September 2023, TSLA maintained a steady POWR grade of C (Neutral) with intermittent shifts in its ranking within the category, varying between 38th and 39th positions.
- In October 2023, TSLA consistently secured the POWR grade of C (Neutral) and hovered over the 39th position within its category.
- Starting from the week of October 28, 2023, TSLA's POWR grade experienced a drop to D (Sell). The company's ranking within its category also fell slightly to the 40th position at the same time but later improved to 39th.
- From November 2023 to the beginning of 2024, TSLA's POWR grade remained at D (Sell) with marginal variations in its category ranking, mostly staying at the 39th spot, occasionally dropping to 40th briefly.
As per the most recent data available, as of January 23, 2024, TSLA holds a POWR grade of D (Sell) and is ranked 39th in the Auto & Vehicle Manufacturers category.
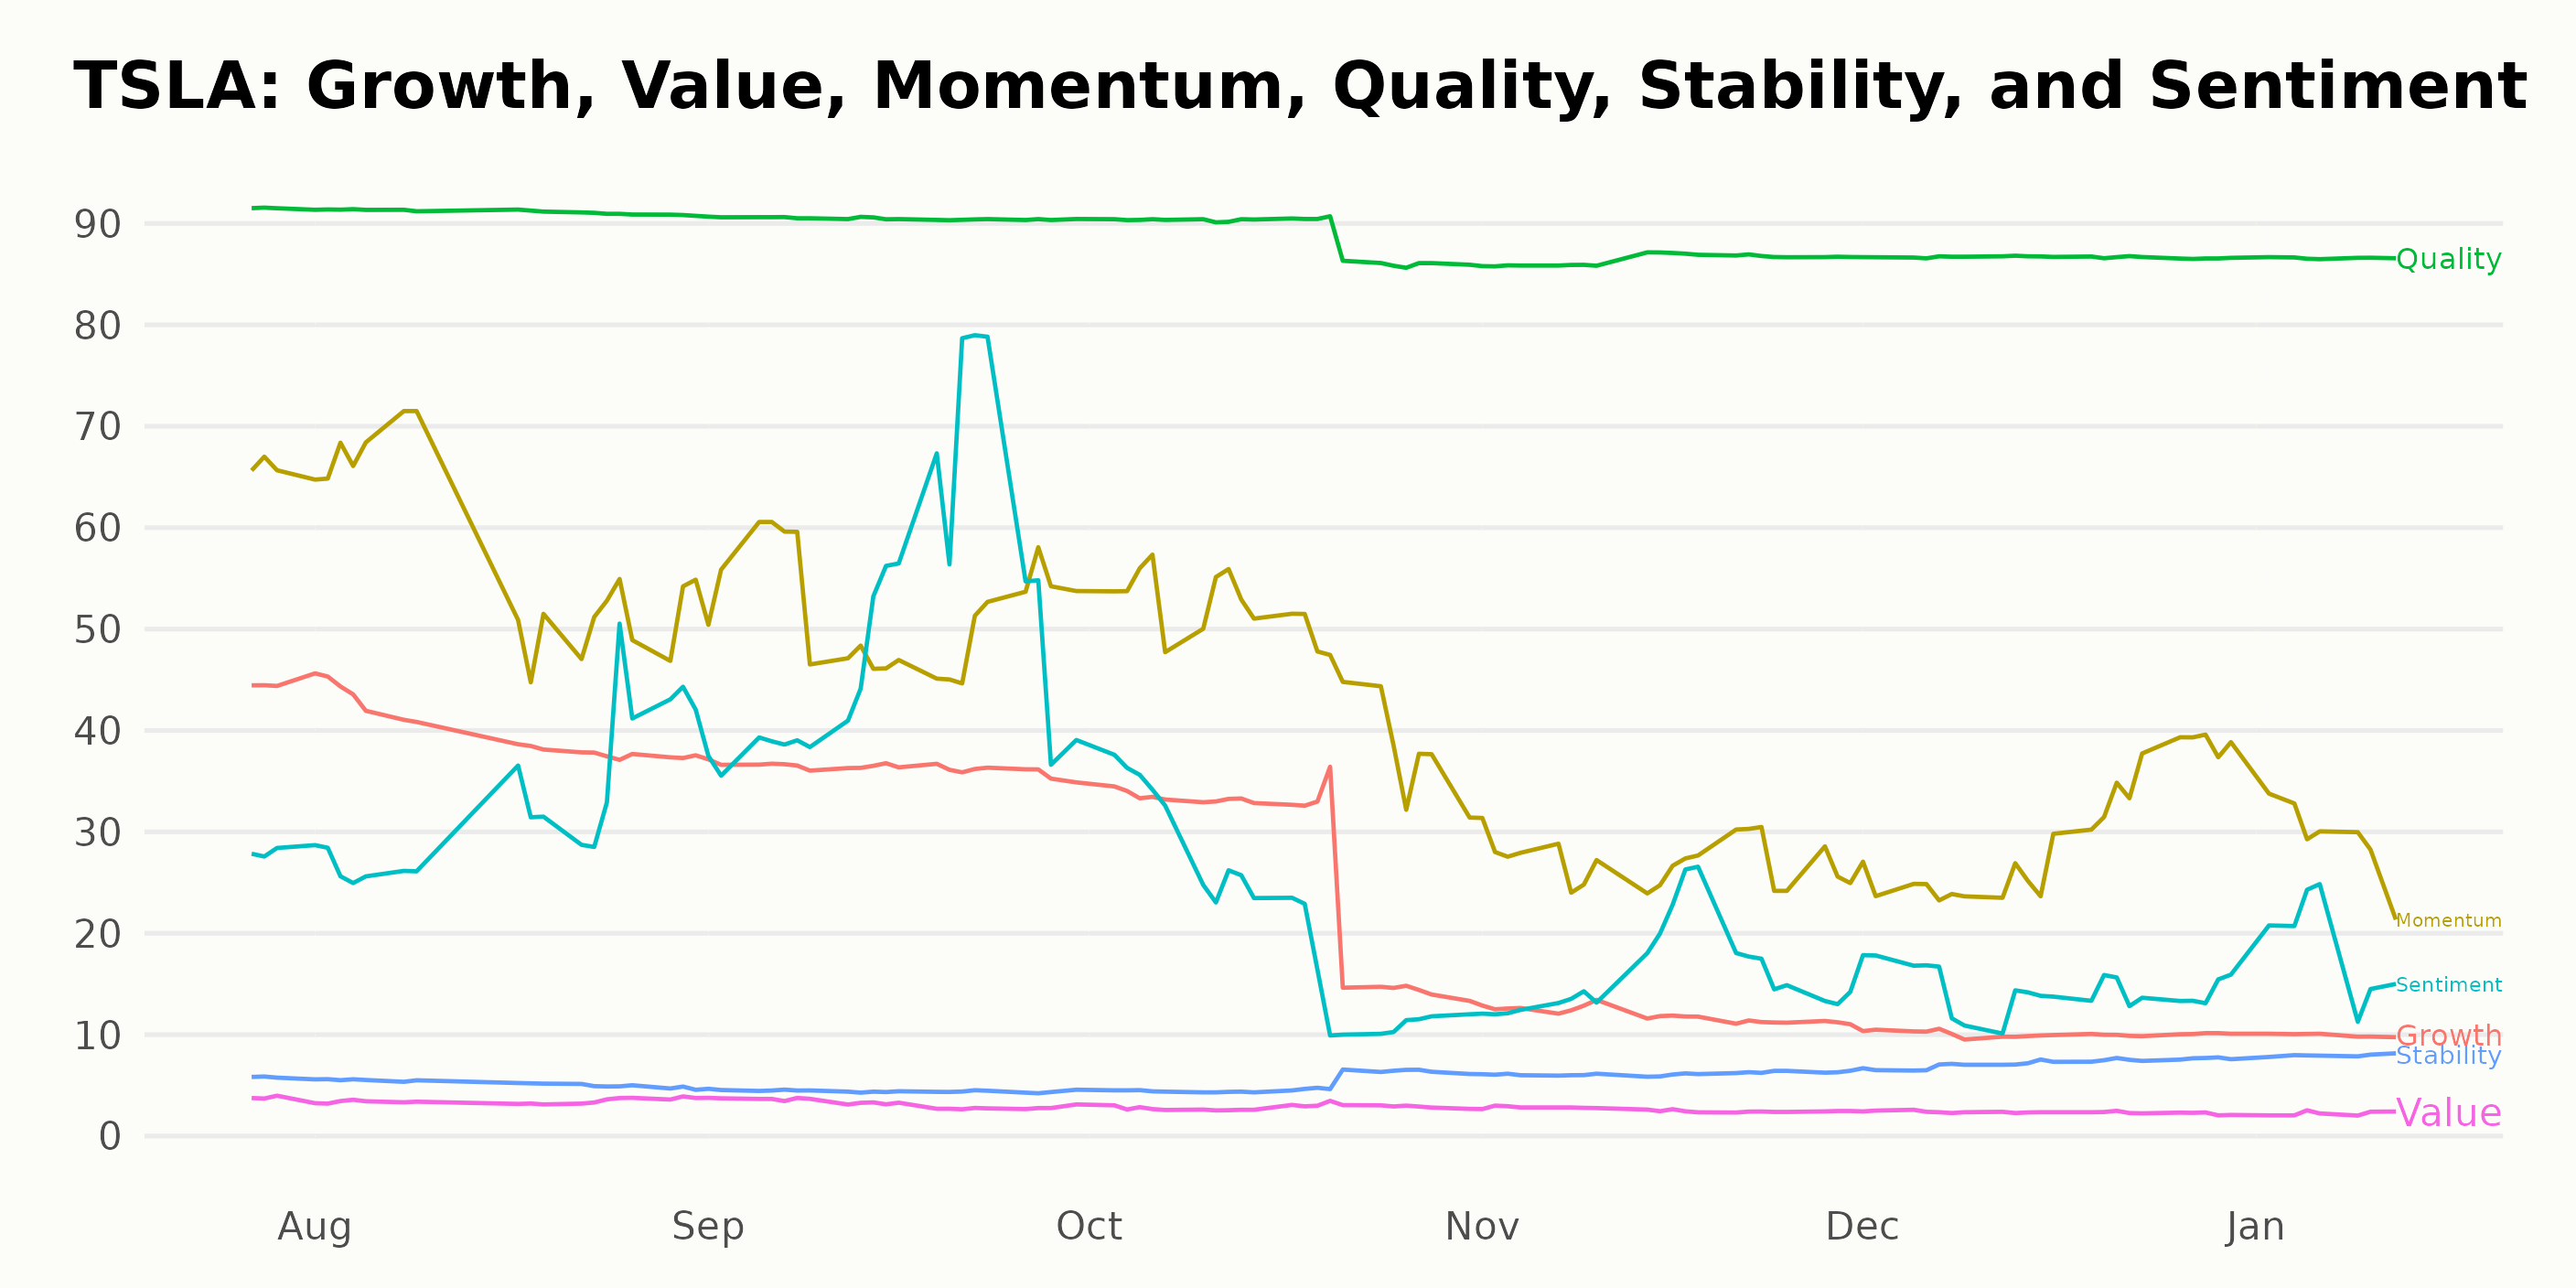
The analysis of the POWR Ratings for TSLA focuses on three key dimensions, namely Quality, Momentum, and Growth. A description of the trends and ratings in these selected dimensions is given below:
Quality: Maintains the highest ratings among all the observed dimensions throughout the period from July 2023 to January 2024. It started with a rating score of 92 in July 2023. There has been a gradual decrease over time, but it remained relatively high, with a score of 87 by January 2024.
Momentum: Holds the second-highest ratings after Quality. It began with a score of 66 in July 2023 and fluctuated downwards to reach a score of 29 by January 2024, indicating a downward trend during the period.
Growth: The third most important dimension shows a clear downward trend over the months from July 2023 to January 2024. It started with a higher score of 44 in July 2023 but ended with a reduced score of 10 in January 2024.
These findings highlight that while TSLA maintains a high Quality rating, there exist decreasing trends in the Momentum and Growth dimensions.
How does Tesla, Inc. (TSLA) Stack Up Against its Peers?
Other stocks in the Auto & Vehicle Manufacturers sector that may be worth considering are Mercedes-Benz Group AG (MBGAF), REV Group, Inc. (REVG), and Honda Motor Co., Ltd. (HMC) - they have better POWR Ratings. Click here to explore more Auto & Vehicle Manufacturers stocks.
What To Do Next?
Get your hands on this special report with 3 low priced companies with tremendous upside potential even in today’s volatile markets:
3 Stocks to DOUBLE This Year >
TSLA shares were trading at $211.00 per share on Tuesday morning, up $2.20 (+1.05%). Year-to-date, TSLA has declined -15.08%, versus a 1.68% rise in the benchmark S&P 500 index during the same period.
About the Author: Anushka Dutta

Anushka is an analyst whose interest in understanding the impact of broader economic changes on financial markets motivated her to pursue a career in investment research.
The post Tesla (TSLA): Earnings Momentum Analysis for 2024 appeared first on StockNews.com