


Over recent years, The Kroger Co. (KR) growth rates have been influenced by macroeconomic elements. Despite experiencing the impacts of inflation, the company's slowdown in discretionary merchandise was somewhat lessened due to the predominance of everyday groceries in its inventory.
Concurrently, as inflation slackens, the grocer is expected to see an increase in sales volume. “While the environment is difficult, we are never satisfied with sales, and we are focused on driving more units in the back half of the year,” Kroger CEO Rodney McMullen said on last quarter earnings call.
Furthermore, Kroger has adopted a digital commerce approach and significantly expanded into new market landscapes by establishing sizeable warehouses to fulfill online orders. The company reported a robust rise in online earnings during the previous quarter, revealing a year-over-year digital sales increment of 12%.
Analysts forecast Kroger's revenue for the quarter ended October 2023 to be around $33.92 billion, accompanied by an expected 4.1% year-over-year surge in earnings per share (EPS) to $0.92. Despite prevailing macroeconomic challenges, Kroger displays an impressive earning surprise history, surpassing Street EPS predictions for the trailing four quarters.
As Kroger prepares for its upcoming earnings announcement, it could present an attractive investment opportunity. The following are some key metrics underpinning my optimistic outlook on this stock.
Analyzing Kroger's Financial Performance Trends Between 2020 and 2023
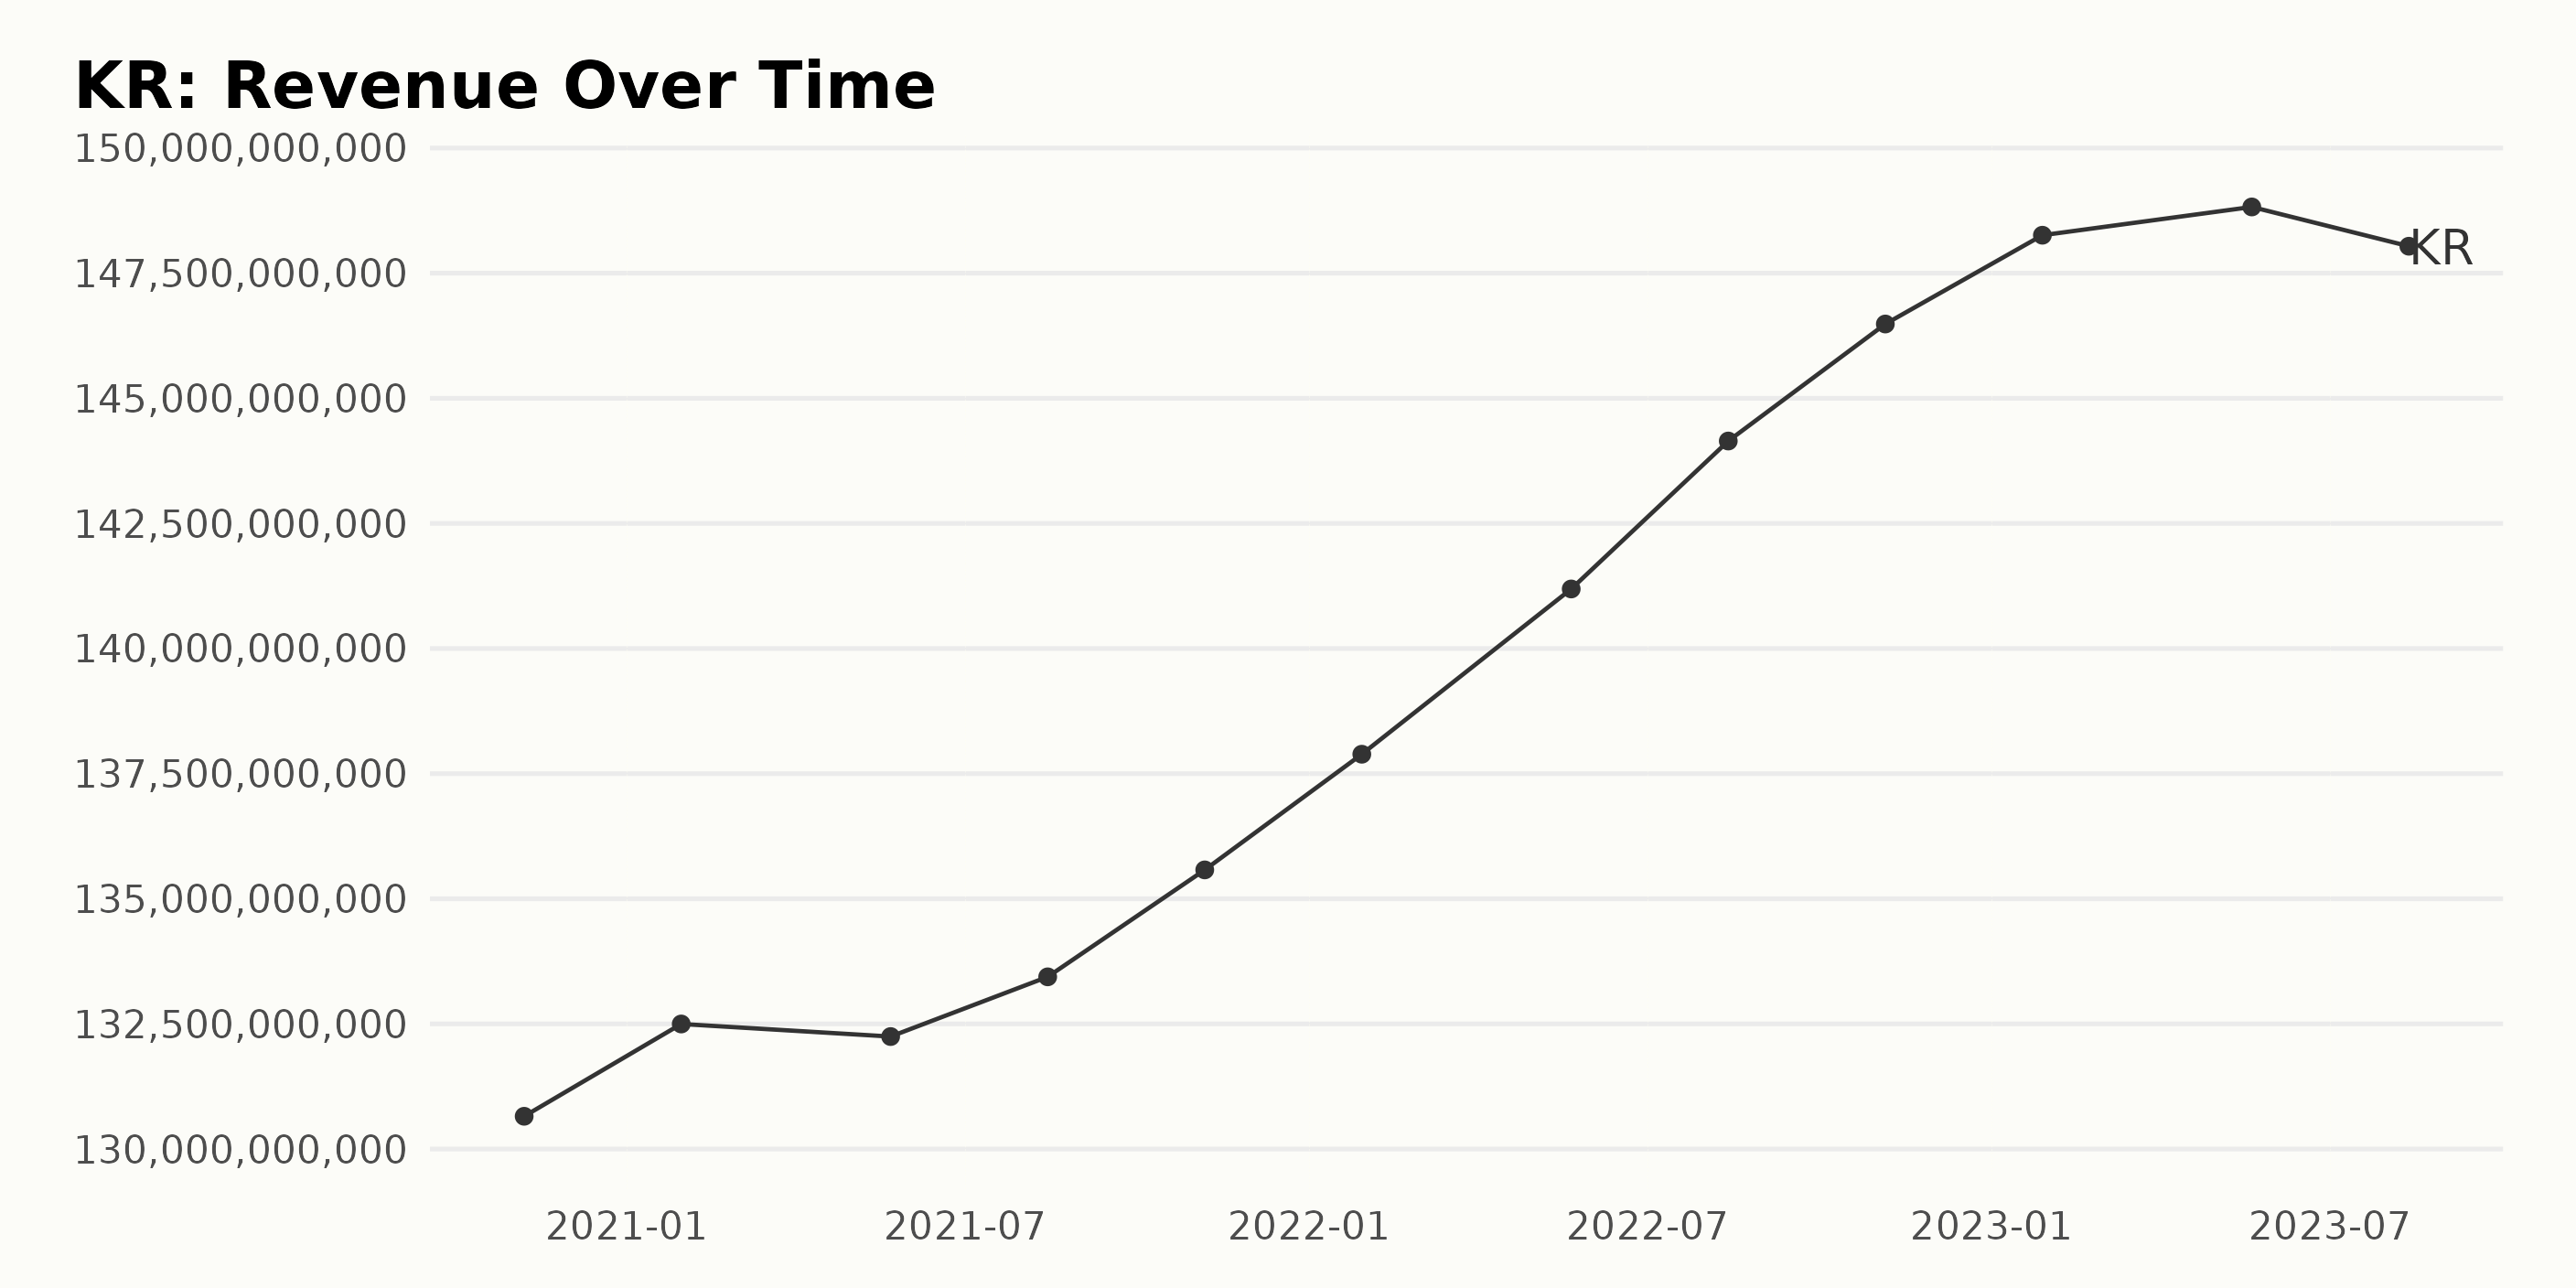
The trend in KR’s trailing-12-month Revenue shows a consistent upward trajectory over the period from November 7, 2020, to August 12, 2023. However, the data also reveals some fluctuations within this overall growth pattern.
- On November 7, 2020, the revenue stood at $130.65 billion.
- The revenue slightly increased to $132.50 billion on January 30, 2021, and experienced a minor dip to $132.25 billion by May 22, 2021.
- Notable growth was recorded for the next quarters, achieving $148.26 billion by January 28, 2023.
- The most recent data paints a slightly different picture with a decline as the revenue fell slightly from $148.82 billion in May 2023 to $148.04 billion in August 2023.
Over these years, the cumulative growth rate from November 7, 2020, to August 12, 2023, is approximately 13.32%, measured by comparing the first and last values in the series. Consequently, the company's revenue has been growing, albeit with some fluctuations, particularly in the most recent periods.
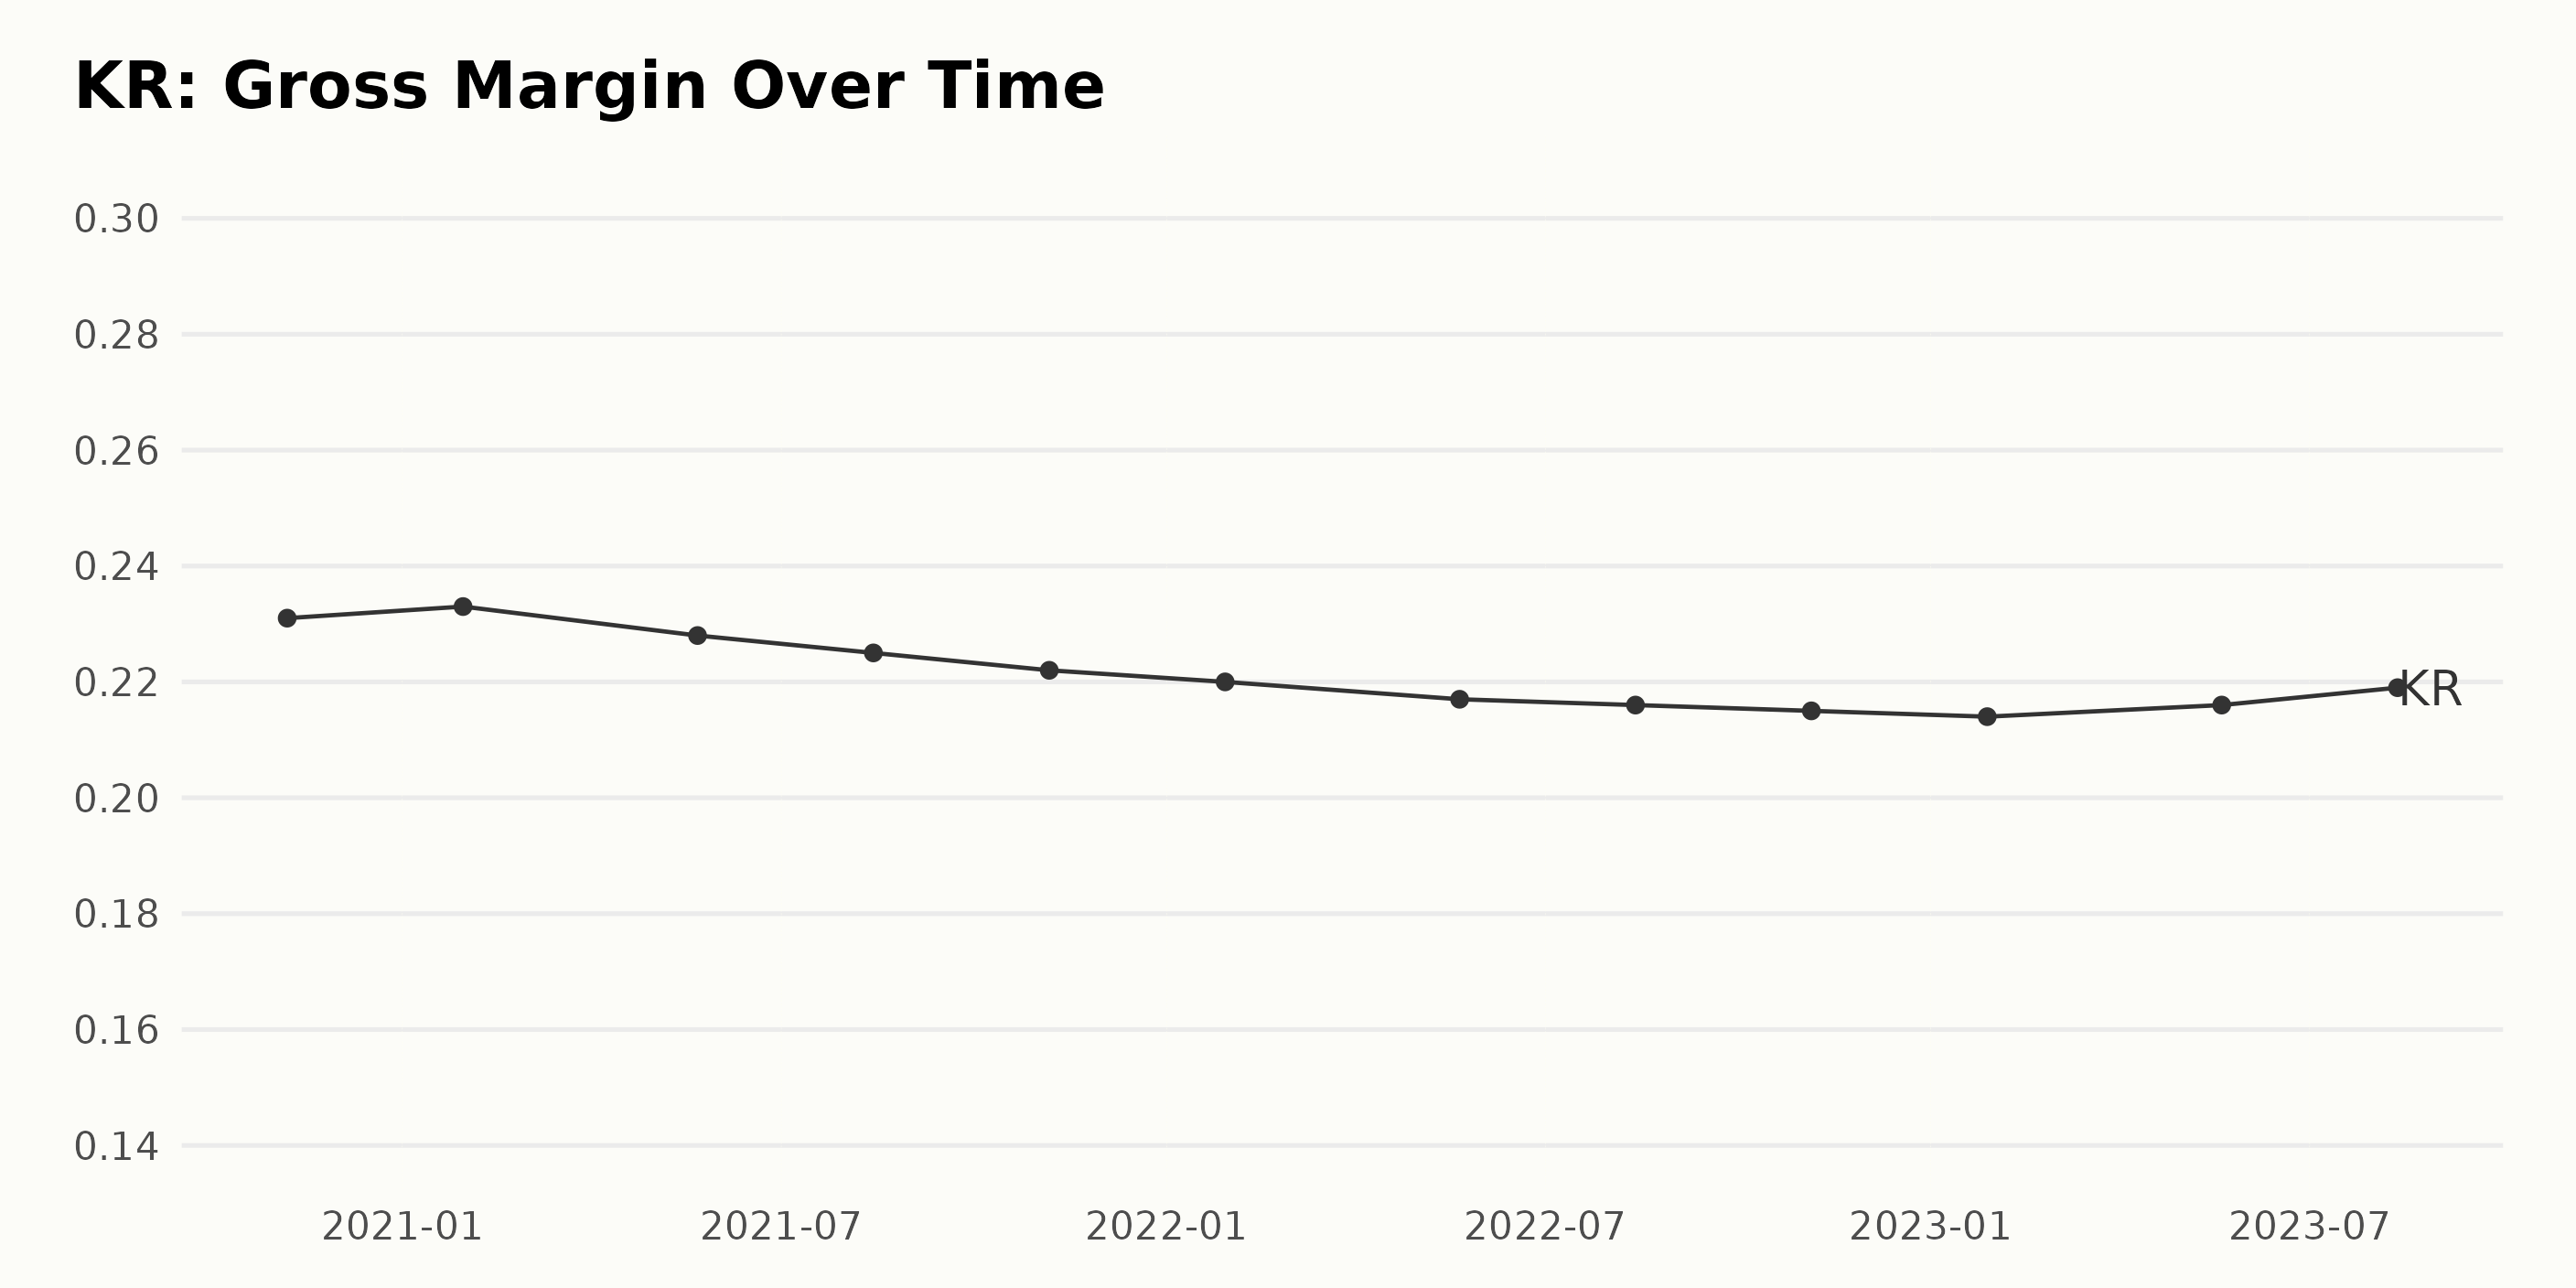
From the provided series of data, it's evident that the Gross Margin trend for the Kroger Company (KR) over the period from November 7, 2020, to August 12, 2023, shows a slight but consistent decline followed by a recent mild increase. Key points to note are:
- Starting with a Gross Margin of 23.1% on November 7, 2020, there was a marginal increase to 23.3% as of January 30, 2021.
- From then until February 29, 2022, a gradual decrease in Gross Margin can be observed, reaching 22% on January 29, 2022.
- There's a continued decline throughout most of 2022, with the Gross Margin decreasing further to 21.5% by November 5, 2022.
- However, the start of 2023 indicates a reversal in this decreasing trend. The Gross Margin increased to 21.6% by May 20, 2023, and further grew to 21.9% by August 12, 2023.
The increase in Gross Margin since the start of 2023 might indicate a positive shift in the company's cost efficiency or selling prices.
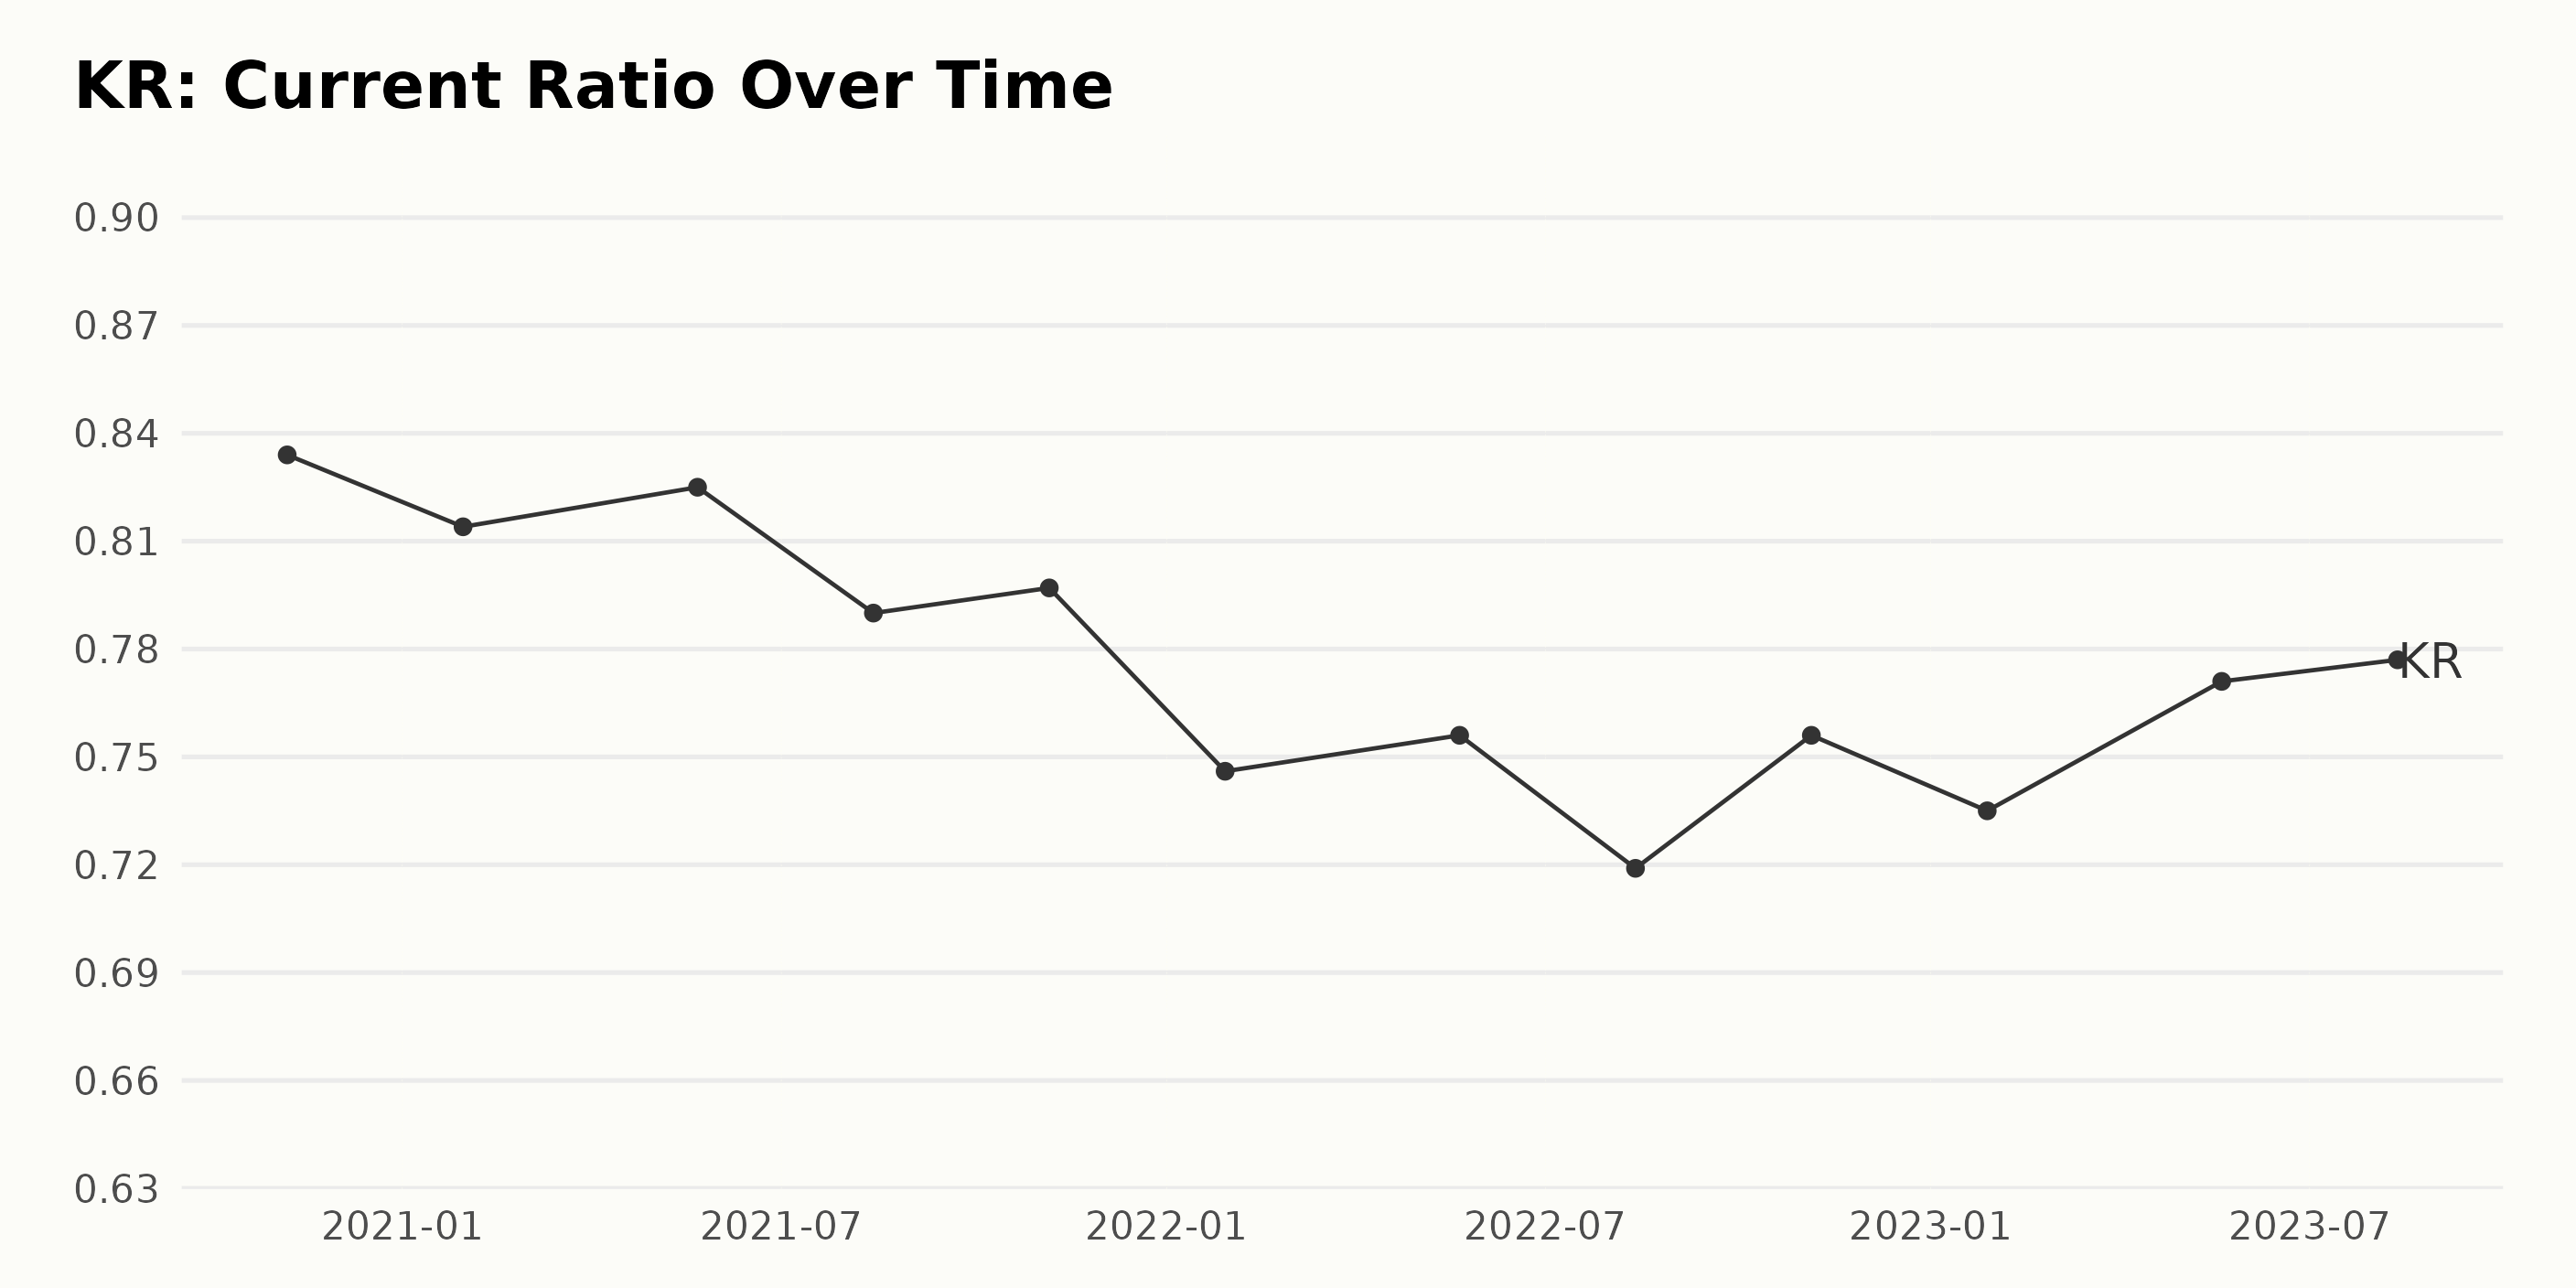
The Current Ratio of KR shows a decreasing trend from November 2020 through August 2022, followed by some fluctuations with mild upward tendency towards August 2023. Below is the detailed trend:
- In November 2020, the Current Ratio stood at 0.83.
- By January 2021, it had slightly decreased to 0.81, and through to May 2021, there was a little fluctuation upward to 0.83.
- From May 2021 to August 2022, there was a noticeable downward trend with the ratio dropping from 0.83 down to 0.72, reaching its lowest point in this period.
- An upswing appeared between August 2022 and November 2022, where the ratio increased to 0.76 and then fell slightly to 0.74 in January 2023.
- Since January 2023 until August 2023, the Current Ratio increased steadily to 0.78.
Despite the overall decreasing trend, KR's current ratio experienced some noticeable fluctuations between August 2022 and August 2023, leading to its rise towards the end of the timeline.
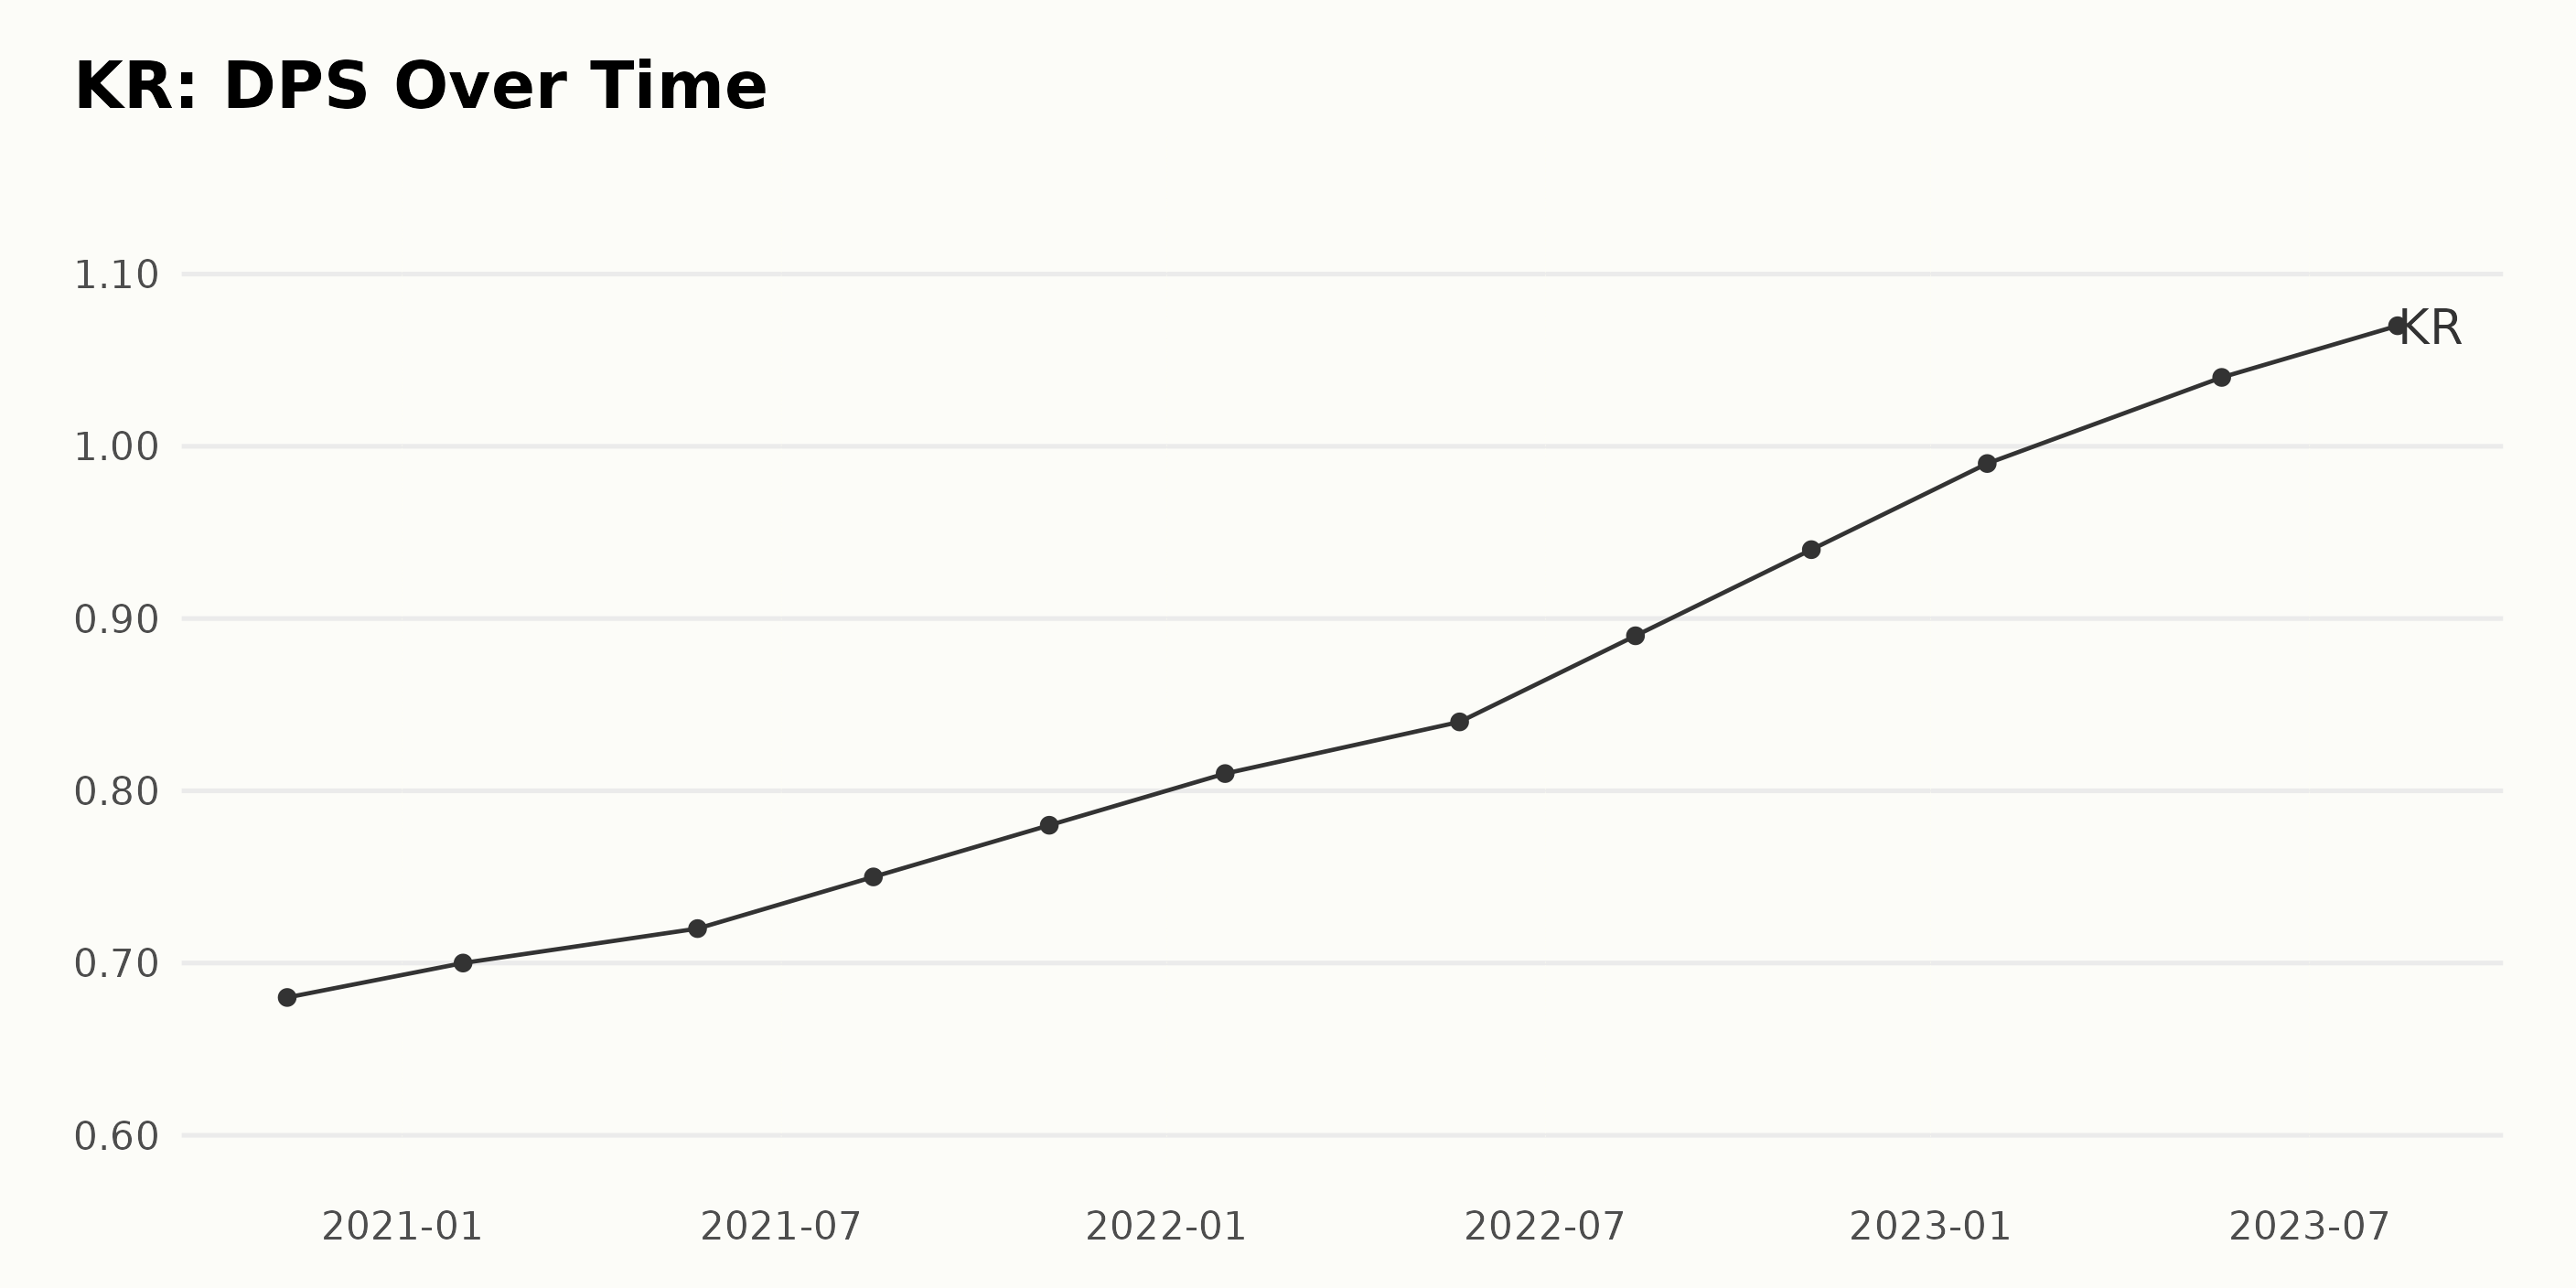
The DPS of KR has shown a consistent increase over the period from November 7, 2020 to August 12, 2023. Here are some of the key points about the DPS trend of KR over this interval:
- The DPS started at $0.68 in November 2020.
- It rose incrementally with few fluctuations, consistently increasing every financial quarter.
- In November 2021, the DPS had risen to $0.78.
- One year later, in November 2022, it reached $0.94, marking a steady growth.
- By January 2023, the DPS achieved nearly a dollar, specifically, $0.99.
- The DPS value last recorded in August 2023 was $1.07.
Over the observed period, the DPS of KR saw an overall growth from $0.68 to $1.07. This equals roughly a 57% rate of growth over the almost three-year span. The data suggests a positive financial trajectory for the company, with greater emphasis demonstrating significant recent growth.
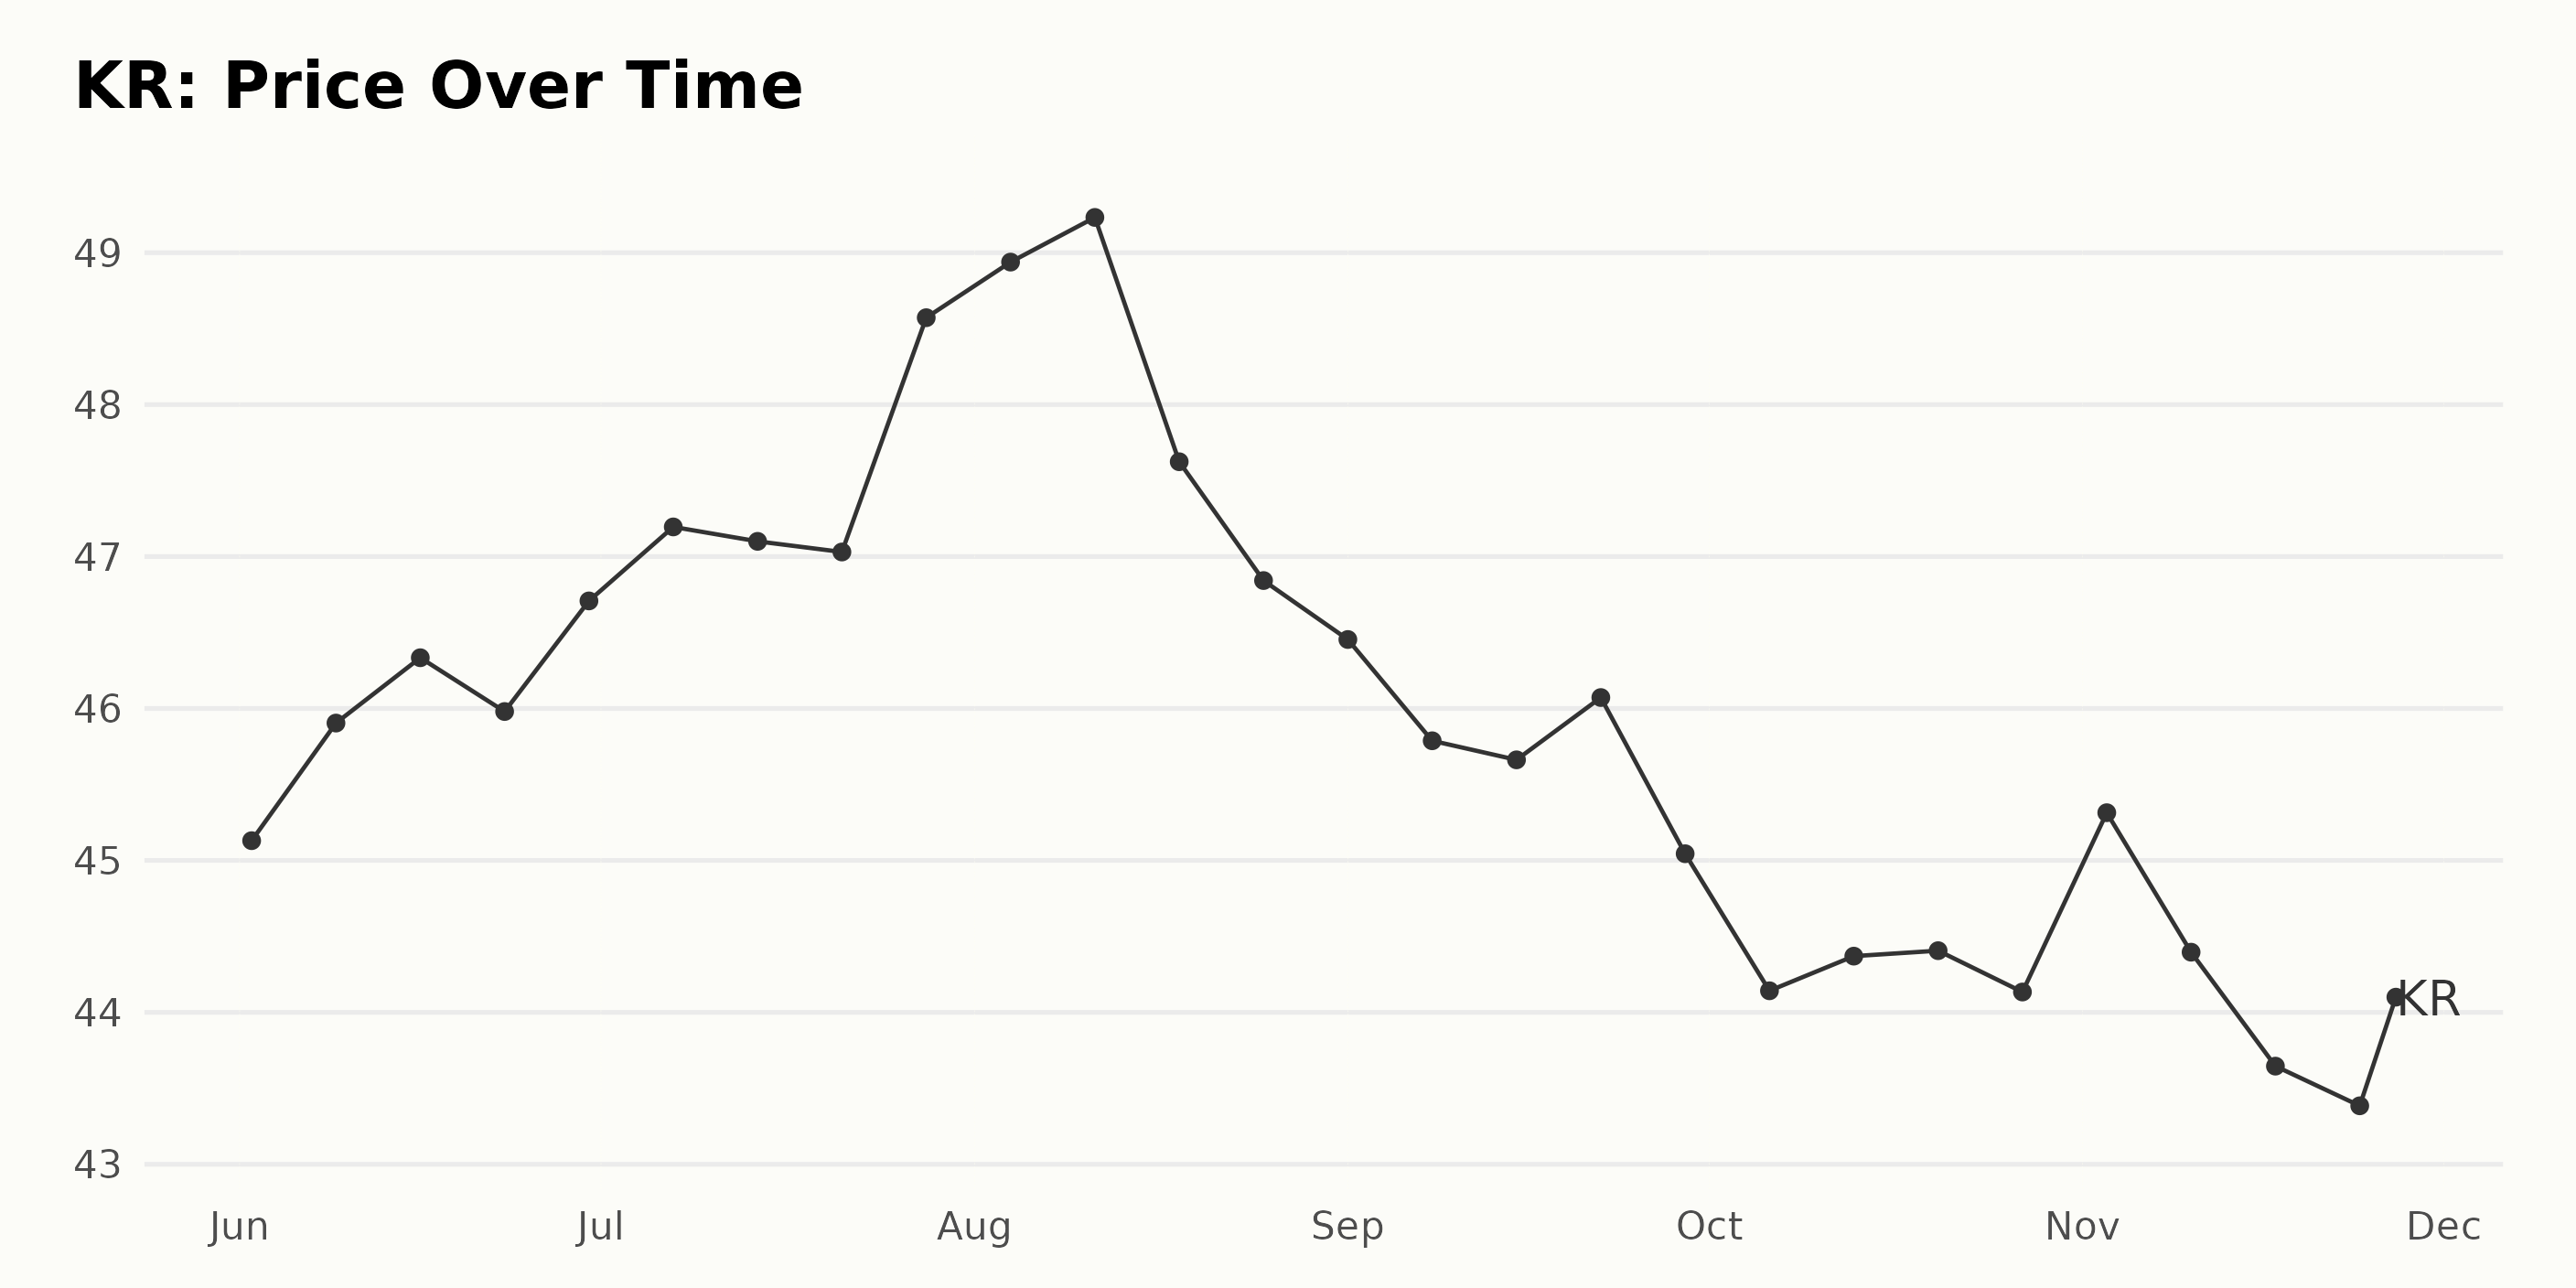
Exploring Kroger Company's Share Price Trends: Growth, Decline, and Fluctuations in 2023
Analyzing the data reveals growth trends and fluctuations in the share price of KR. Here are the observations:
- The starting price on June 2, 2023, was $45.13.
- There was slight growth with some minor up and down fluctuations until hitting a peak at $49.23 in the week of August 11, 2023.
- After reaching this peak, there was a consistent deceleration in the growth rate and the price decreased gradually till the end of August, with the price falling to $46.84 by August 25, 2023.
- This decreasing trend continued into September with the price reaching a low of $45.04 by the end of the month, on September 29, 2023.
- KR prices started varying again from October to November, with some weeks experiencing slight increases and others seeing declines. The share price reached $44.1 on November 27, 2023.
In summary, KR’s share price shows a pattern of initial growth, followed by a clear decelerating trend starting from August 2023, and then moves towards more fluctuating values between October and November 2023. Here is a chart of KR's price over the past 180 days.
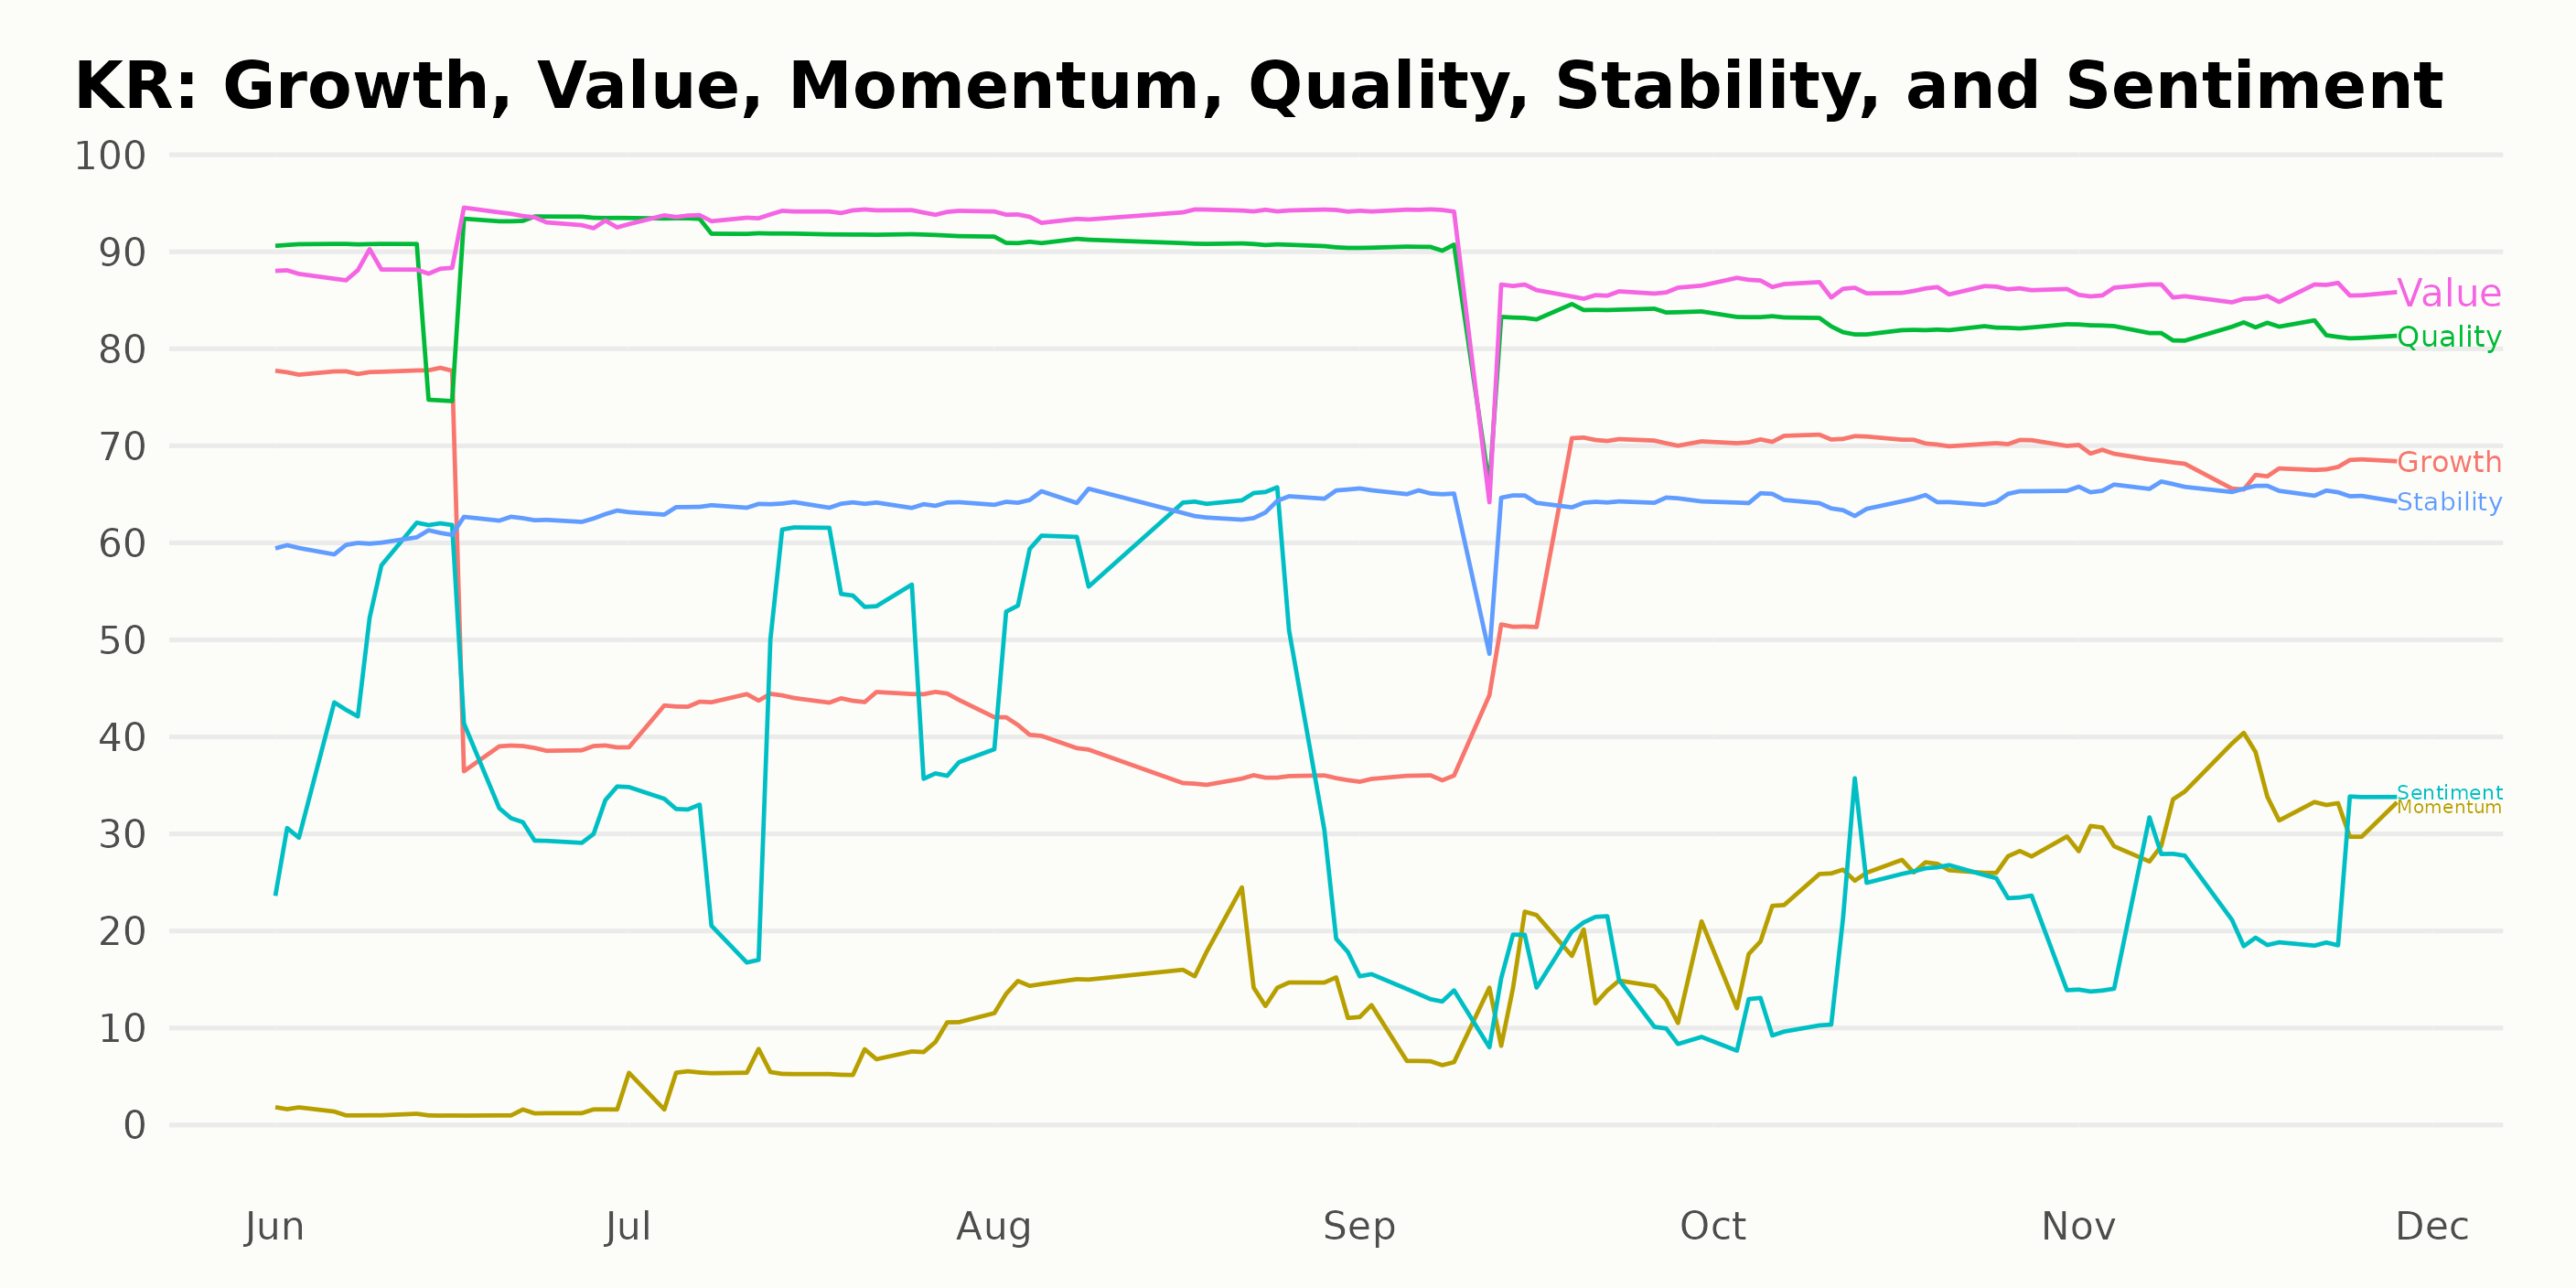
Analyzing Kroger Company's Noteworthy Performance Across Quality, Value, and Growth
KR has an overall B rating, translating to a Buy in our POWR Ratings system. It is ranked #14 out of the 38 stocks in the Grocery/Big Box Retailers category.
For KR, the POWR Ratings reveal several noteworthy trends along three significant dimensions: Quality, Value, and Growth.
Quality: The Quality dimension has consistently ranked high for KR. In June 2023, the Quality rating stood at 90 and showed a slightly increasing trend with a peak of 92 in July 2023. However, from September 2023 onwards, it saw a minor decrease to 82 by November 2023.
Value: KR also scored favorably in the Value category, matching the high rating in Quality in both June and July 2023 at 90 and 94 respectively. Despite a slight dip to 88 in September 2023, the Value rating remained strong at 86 through October and November 2023.
Growth: On the Growth front, the ratings were more volatile. Starting at 60 in June 2023, the score decreased to 38 in August 2023. Subsequently, it experienced an upward trend, reaching 71 by October 2023, the highest within this period. However, it slightly dropped back to 68 by November 2023.
These dimensions highlight the overall robust performance of KR across Quality, Value, and Growth.
How does The Kroger Co. (KR) Stack Up Against its Peers?
Other stocks in the Grocery/Big Box Retailers sector that may be worth considering are Marks & Spencer Group Plc (MAKSY), Village Super Market Inc. (VLGEA), and RYOHIN KEIKAKU CO., LTD. (RYKKY) -- they have better POWR Ratings.
What To Do Next?
43 year investment veteran, Steve Reitmeister, has just released his 2024 market outlook along with trading plan and top 11 picks for the year ahead.
KR shares were trading at $43.80 per share on Tuesday afternoon, down $0.29 (-0.66%). Year-to-date, KR has gained 0.60%, versus a 20.19% rise in the benchmark S&P 500 index during the same period.
About the Author: Subhasree Kar

Subhasree’s keen interest in financial instruments led her to pursue a career as an investment analyst. After earning a Master’s degree in Economics, she gained knowledge of equity research and portfolio management at Finlatics.
The post Kroger Co. (KR) Earnings Forecasts: What's in Store for the Grocery Stock? appeared first on StockNews.com