


Tech hardware giant Dell Technologies Inc. (DELL) is set to release its fiscal 2024 third-quarter results on November 30. The company is expected to benefit from the generative Artificial Intelligence (AI) boom as big tech increasingly invests in it. The company also expects a demand boost for its PowerEdge servers.
The company also forecasted its third-quarter revenue to be between $22.5 billion and $23.5 billion, higher than the analyst-estimated figure of $21.67 billion. Its expected EPS of about $1.45 also topped the $1.38 estimate.
Given such conducive forecasts, let’s look at the trends of DELL’s key financial metrics to understand why it could be wise to buy the stock before its upcoming earnings release.
Analyzing Dell Technologies Inc.'s Financial Performance and Market Valuation Trends (2021-2023)
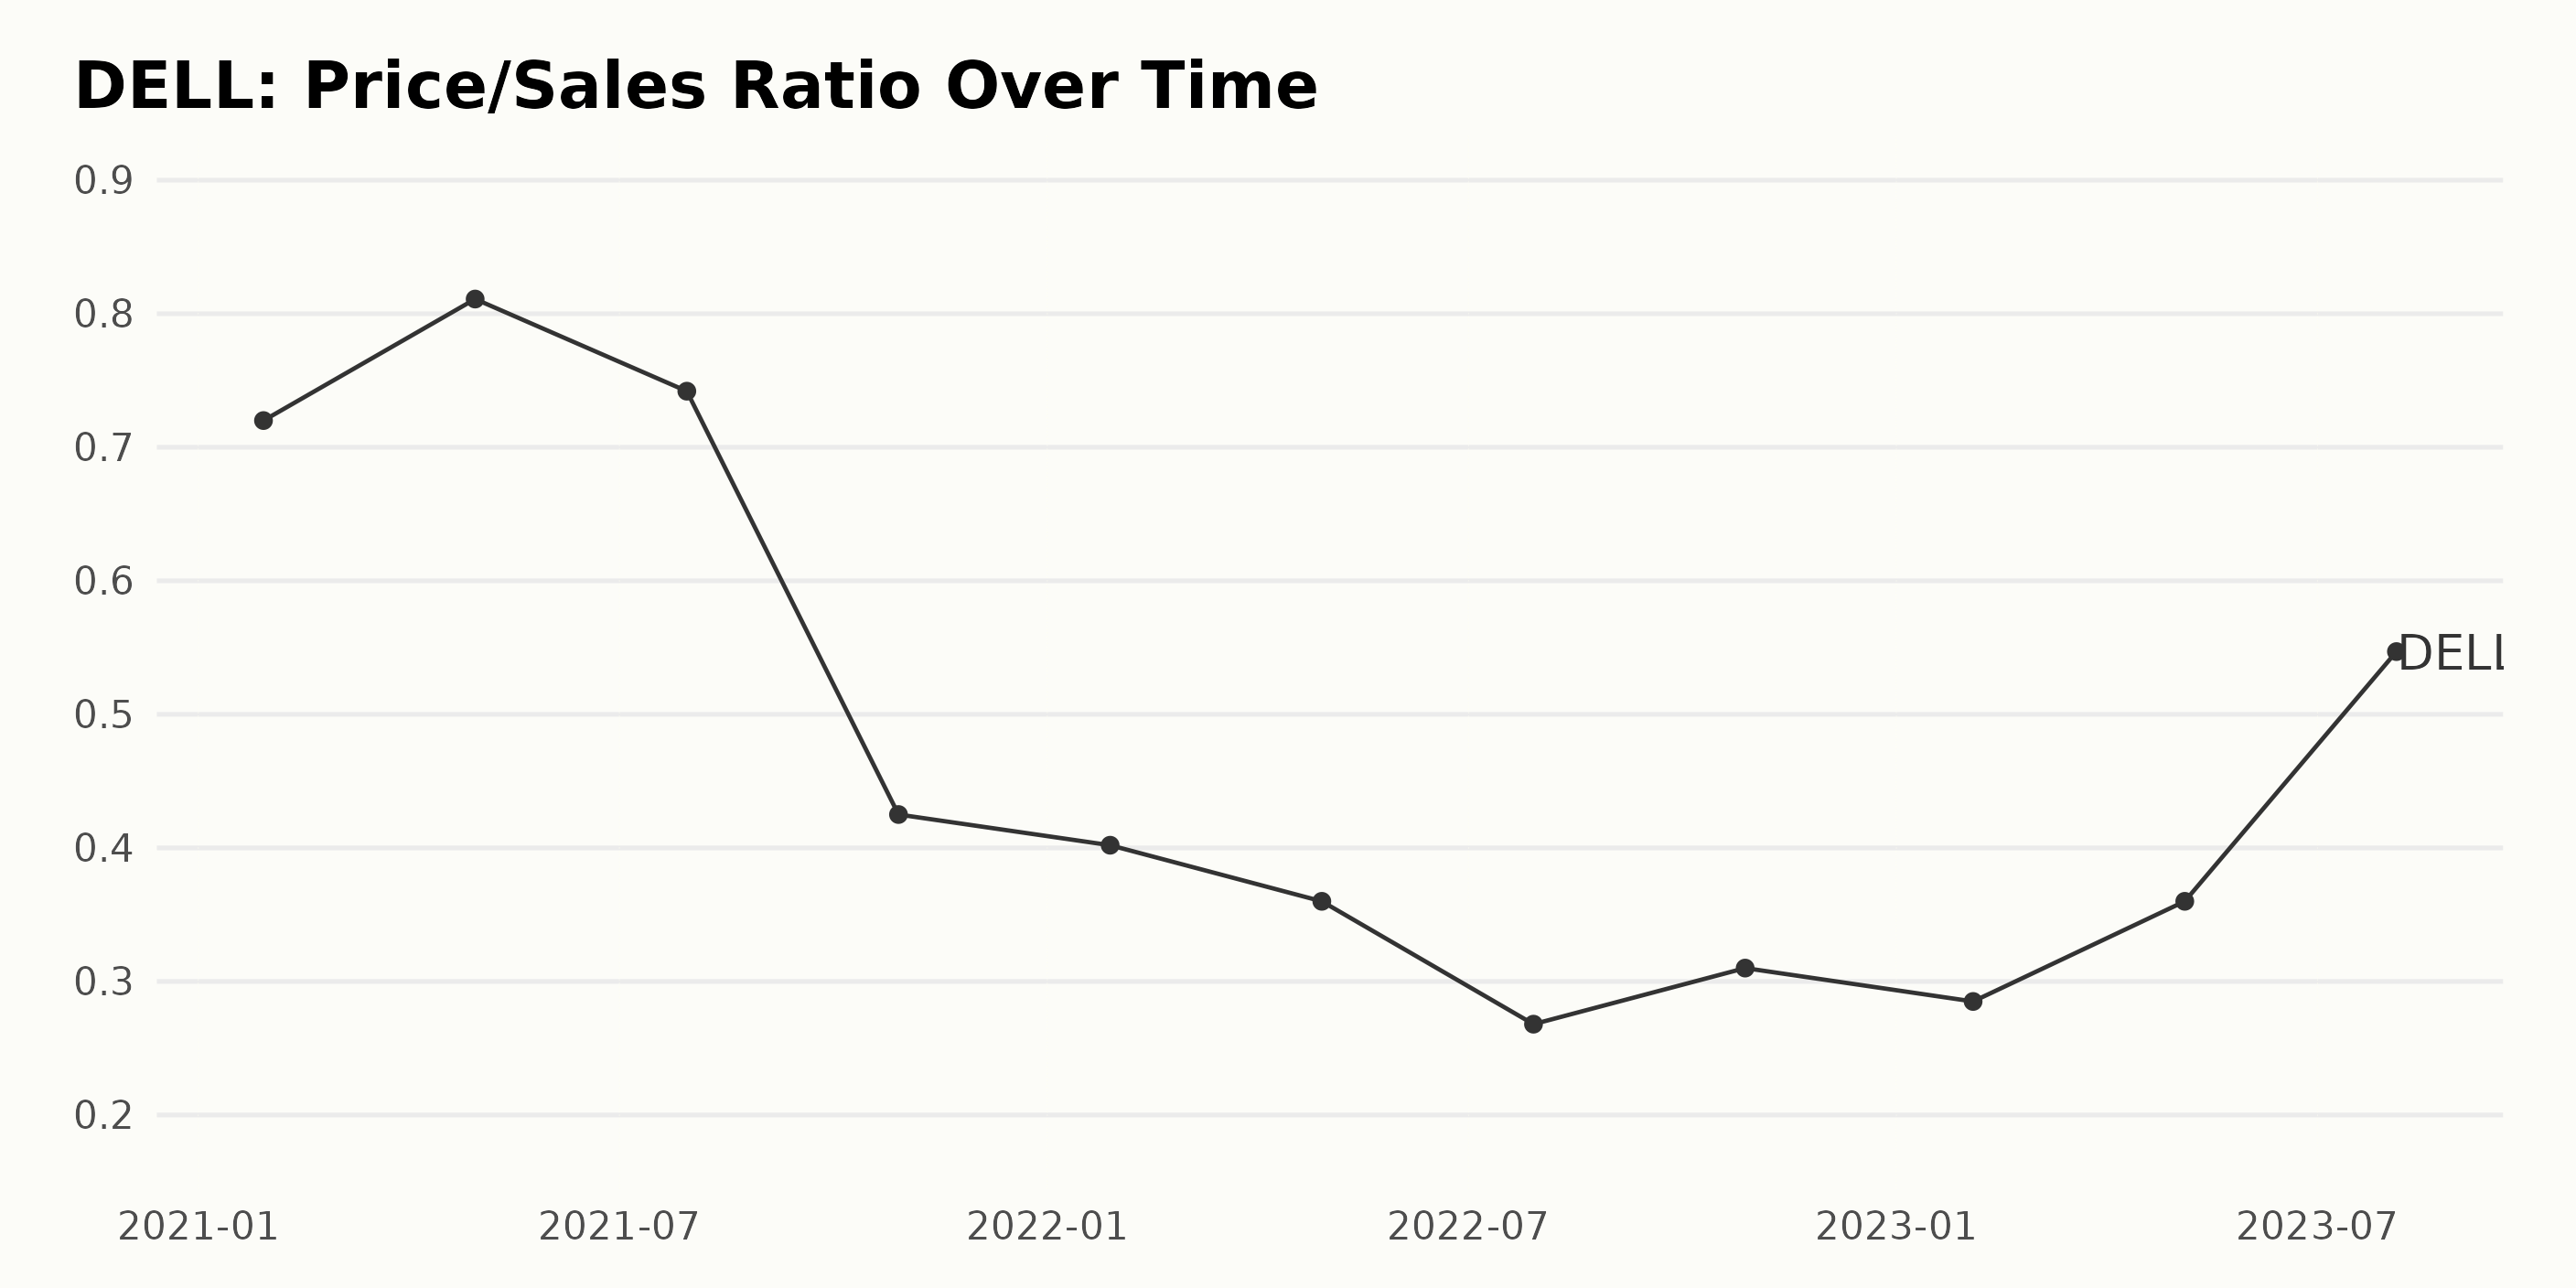
The Price/Sales Ratio (P/S) of DELL shows notable fluctuations over time. Here's the summarized trend:
- At the start of the data series on January 29, 2021, DELL's P/S was at 0.72.
- It peaked slightly to 0.81 by April 30, 2021.
- Then it dropped to 0.742 by July 30, 2021.
- A significant decrease in P/S was observed by October 29, 2021, when it reached 0.425.
- This declining trend continued into 2022, with P/S touching a low of 0.268 by July 29, 2022.
- However, it slightly picked up to 0.31 by October 28, 2022, but still remained lower compared to previous years.
- In 2023, P/S went through an upward trend, reaching 0.547 by August 4, which is the highest value for the year until now.
To calculate the growth rate, considering the first value (0.72 on January 29, 2021) and the last value (0.547 on August 4, 2023), there is a decline of approximately 24%. This indicates that overall, DELL's P/S has decreased within this timeframe. However, the most recent data in 2023 shows a rising trend.
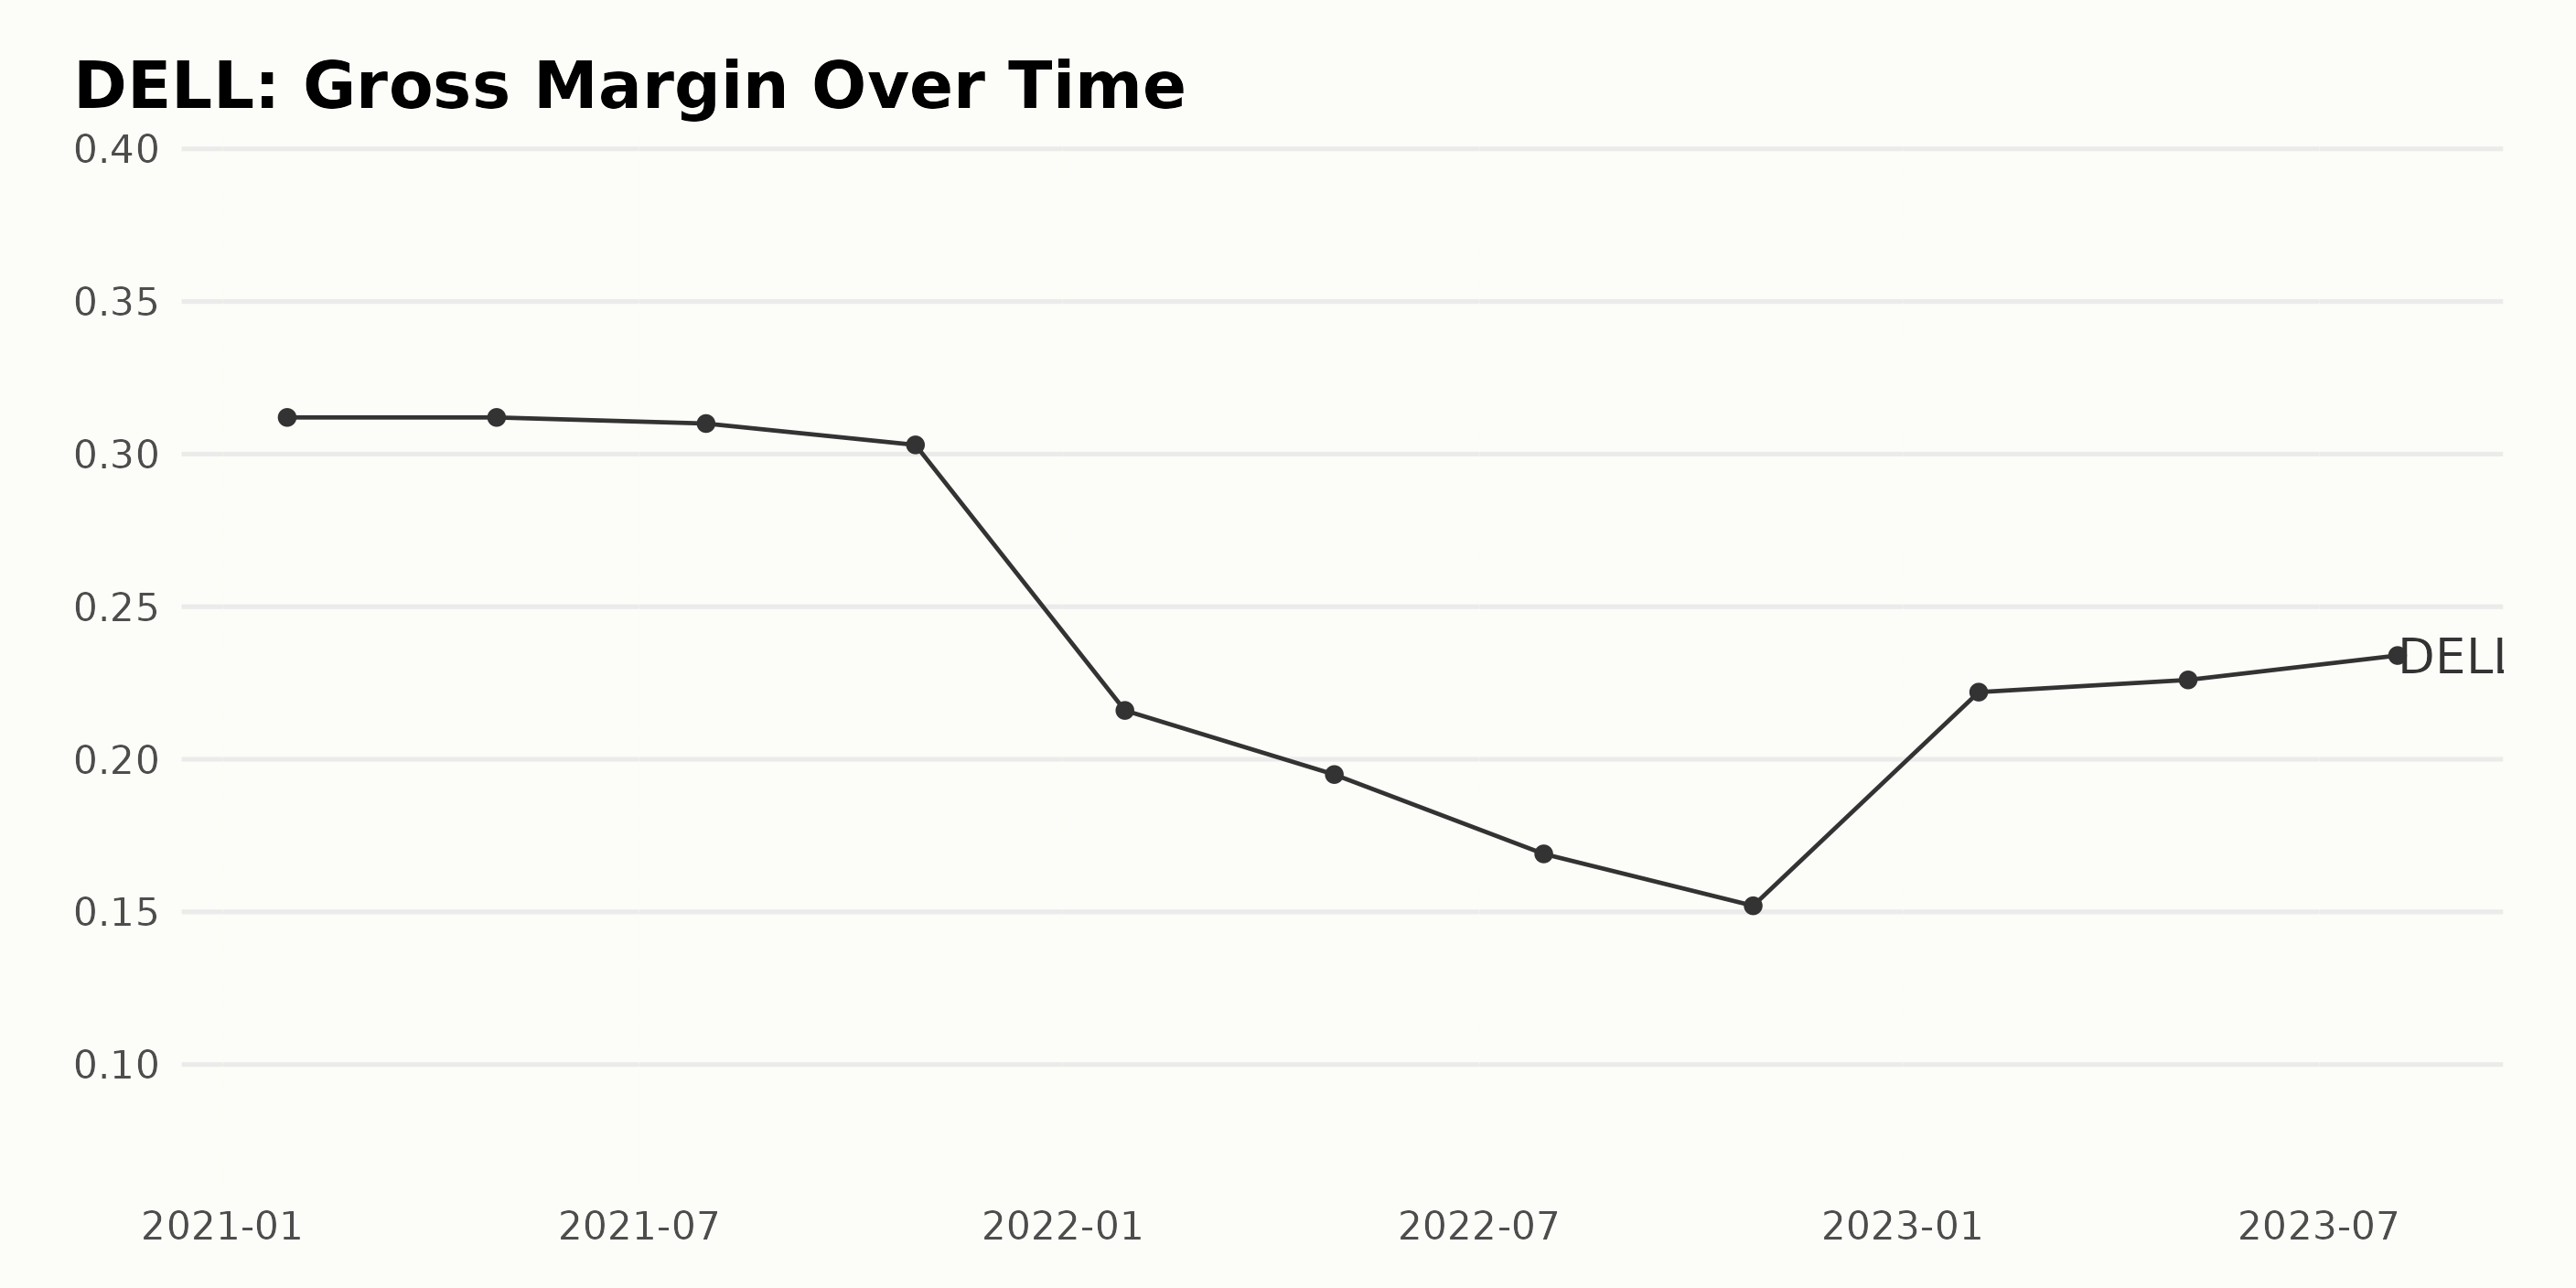
The gross margin of DELL demonstrated a substantial shift throughout the years from 2021 to 2023. The narrative painted by this data is classified by two different periods distinguished mainly by diverging trends.
- From January 29, 2021, to October 28, 2022, DELL's gross margin appeared to be on a declining trend. It started from a high of 31.2% in January 2021, maintaining a steady level until April 30, 2021. The period subsequent to April recorded decreasing gross margin rates going as low as 15.2% in October 2022.
- However, starting from February 3, 2023, the gross margin began to experience a rebound. Its value dramatically surged from 15.2% to 22.2% between October 2022 and February 2023. This upward trend continued, reaching 22.6% in May 2023 and then further improving to 23.4% by August 4, 2023, which was the last reported date.
Calculating the growth rate by comparing the first (31.2%) and the last value in this series (23.4%), there appears to be a decline of about 25% over this period. Despite the initial consistent downtrend, more recent data suggests a turn-around for DELL's gross margin as the company enters 2023 with an accelerating upward trend. The most recent reports indicate a gross margin of 23.4%.
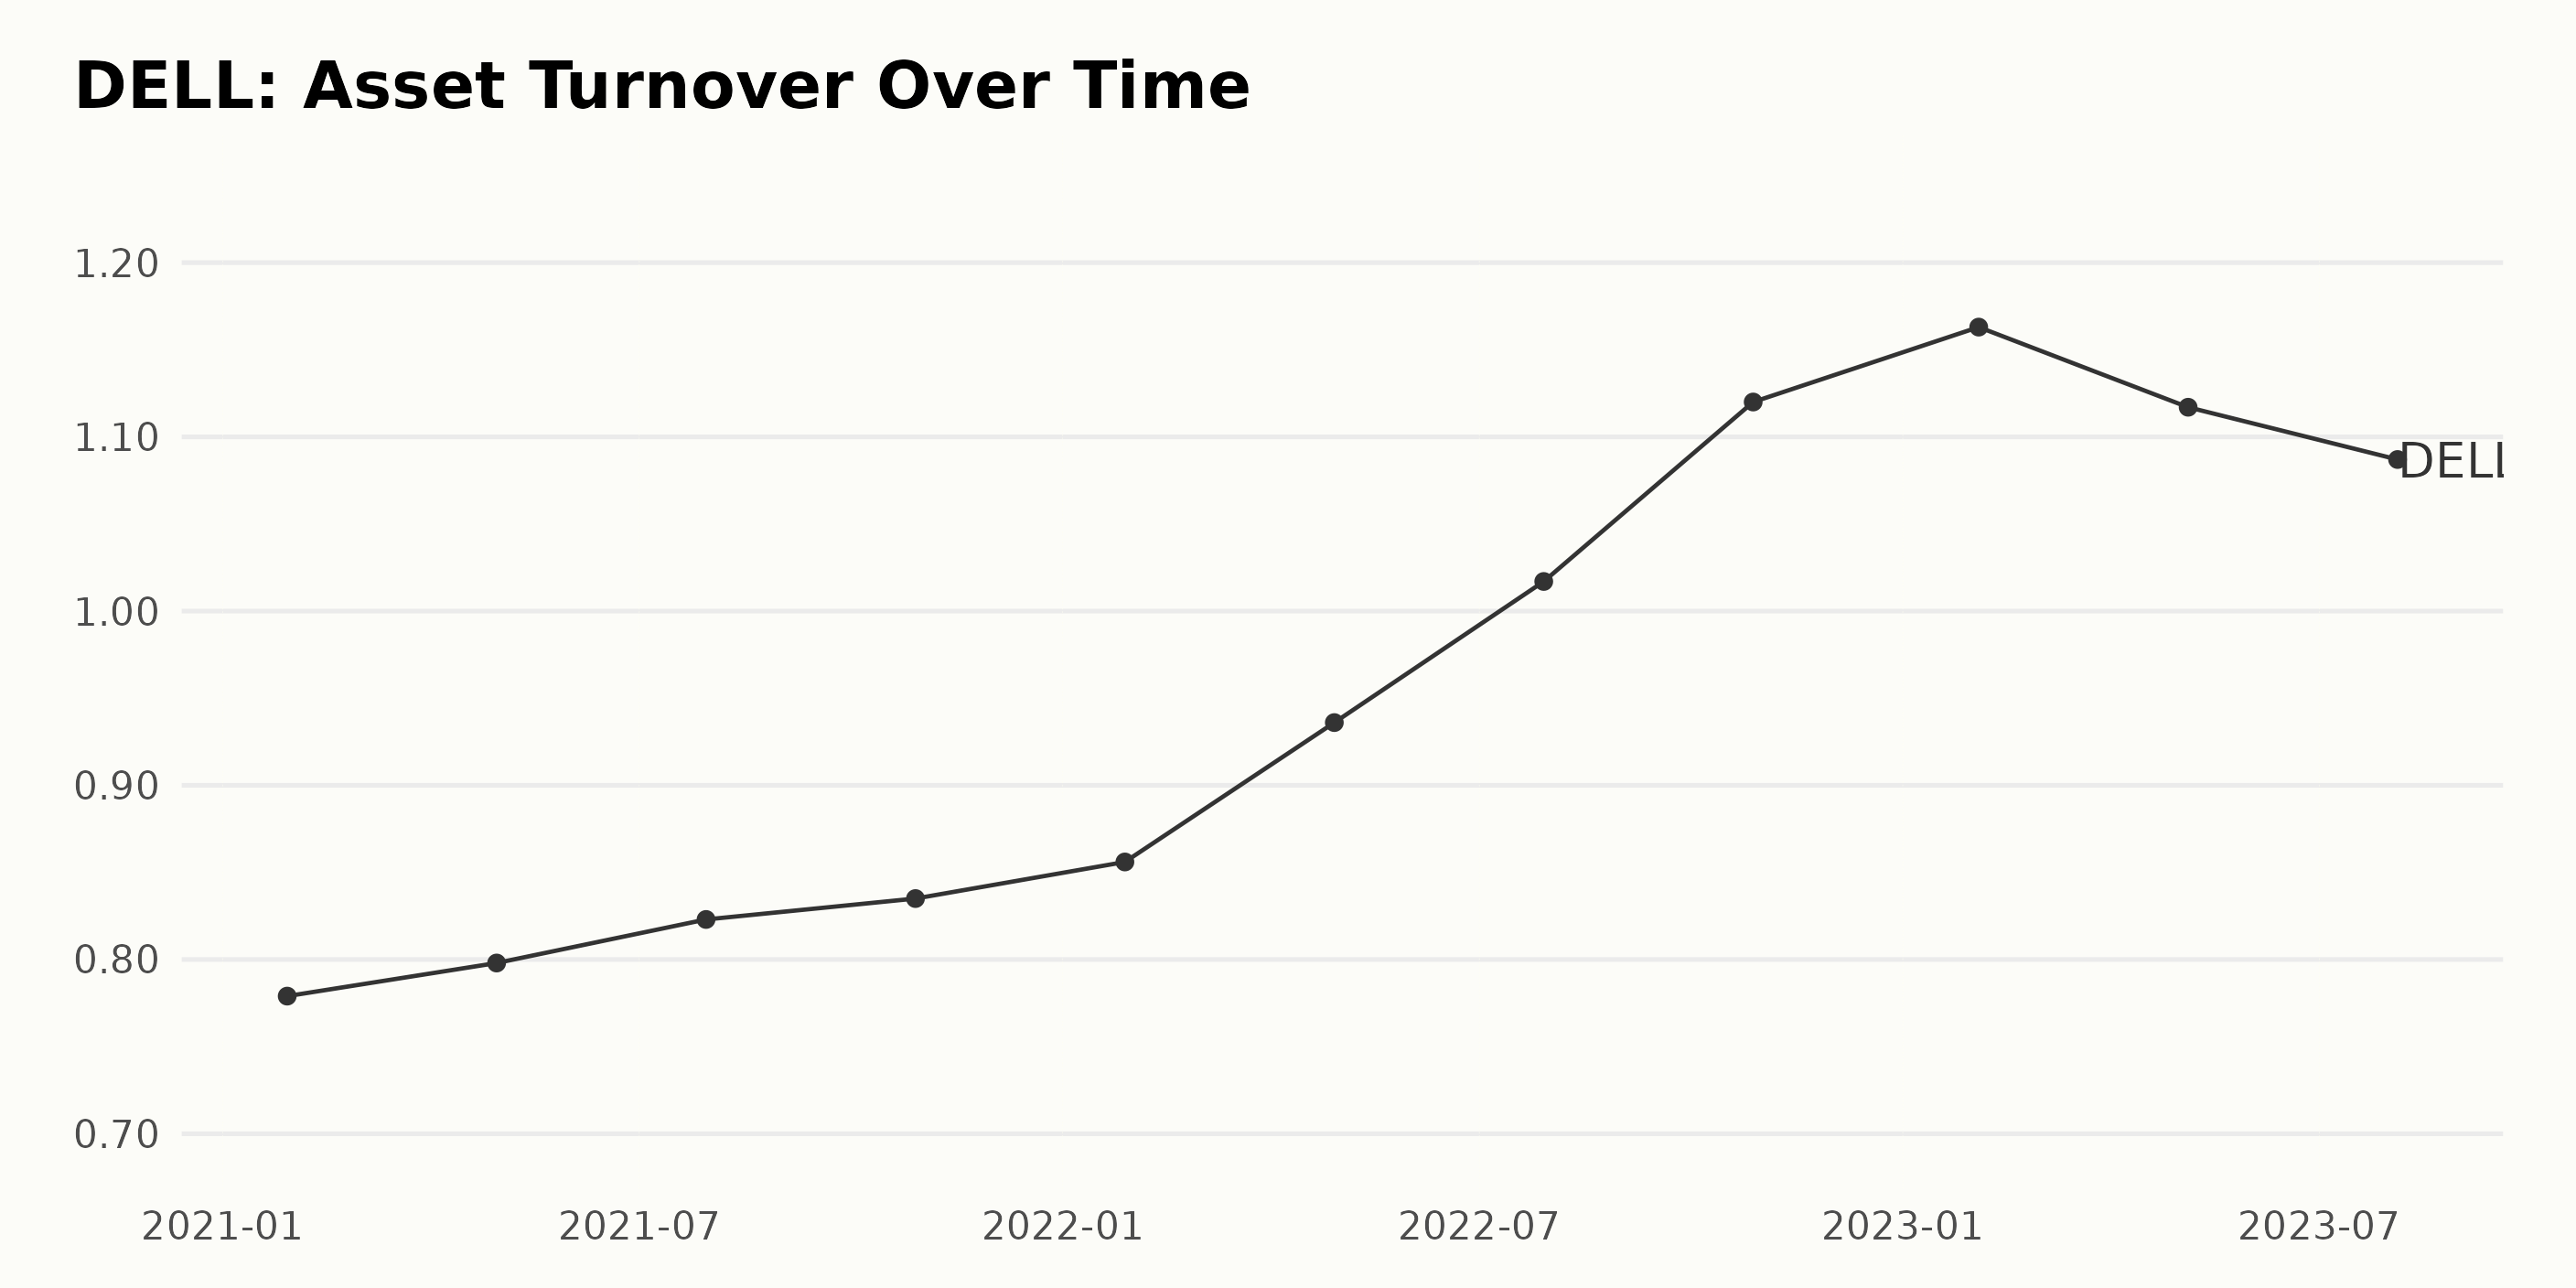
The data presented shows the trend and fluctuations in the asset turnover of DELL. It spans a timeline from January 29, 2021, to August 4, 2023. Here's a breakdown of key movements during this period:
- From January 29, 2021, when the asset turnover stood at 0.78, there has been an overall increase.
- By April 30, 2021, the figure had marginally increased to 0.80.
- A gradual increase was witnessed through 2021 until October 29, when the value had gone up to 0.84.
- The year 2022 saw considerable growth. By July 29, 2022, the reported figure was at 1.02.
- Peak of the series was achieved on February 3, 2023, with an asset turnover of 1.16.
- However, minor decreases were seen following February, registering figures of 1.12 on May 5, 2023, and 1.09 on August 4, 2023.
Over the observed period, there's been a net increase in DELL's asset turnover, recording a growth rate of approximately 39% when measuring the final number (~1.09) from the first (~0.78). Therefore, The general trend has been growth, albeit with small fluctuations.
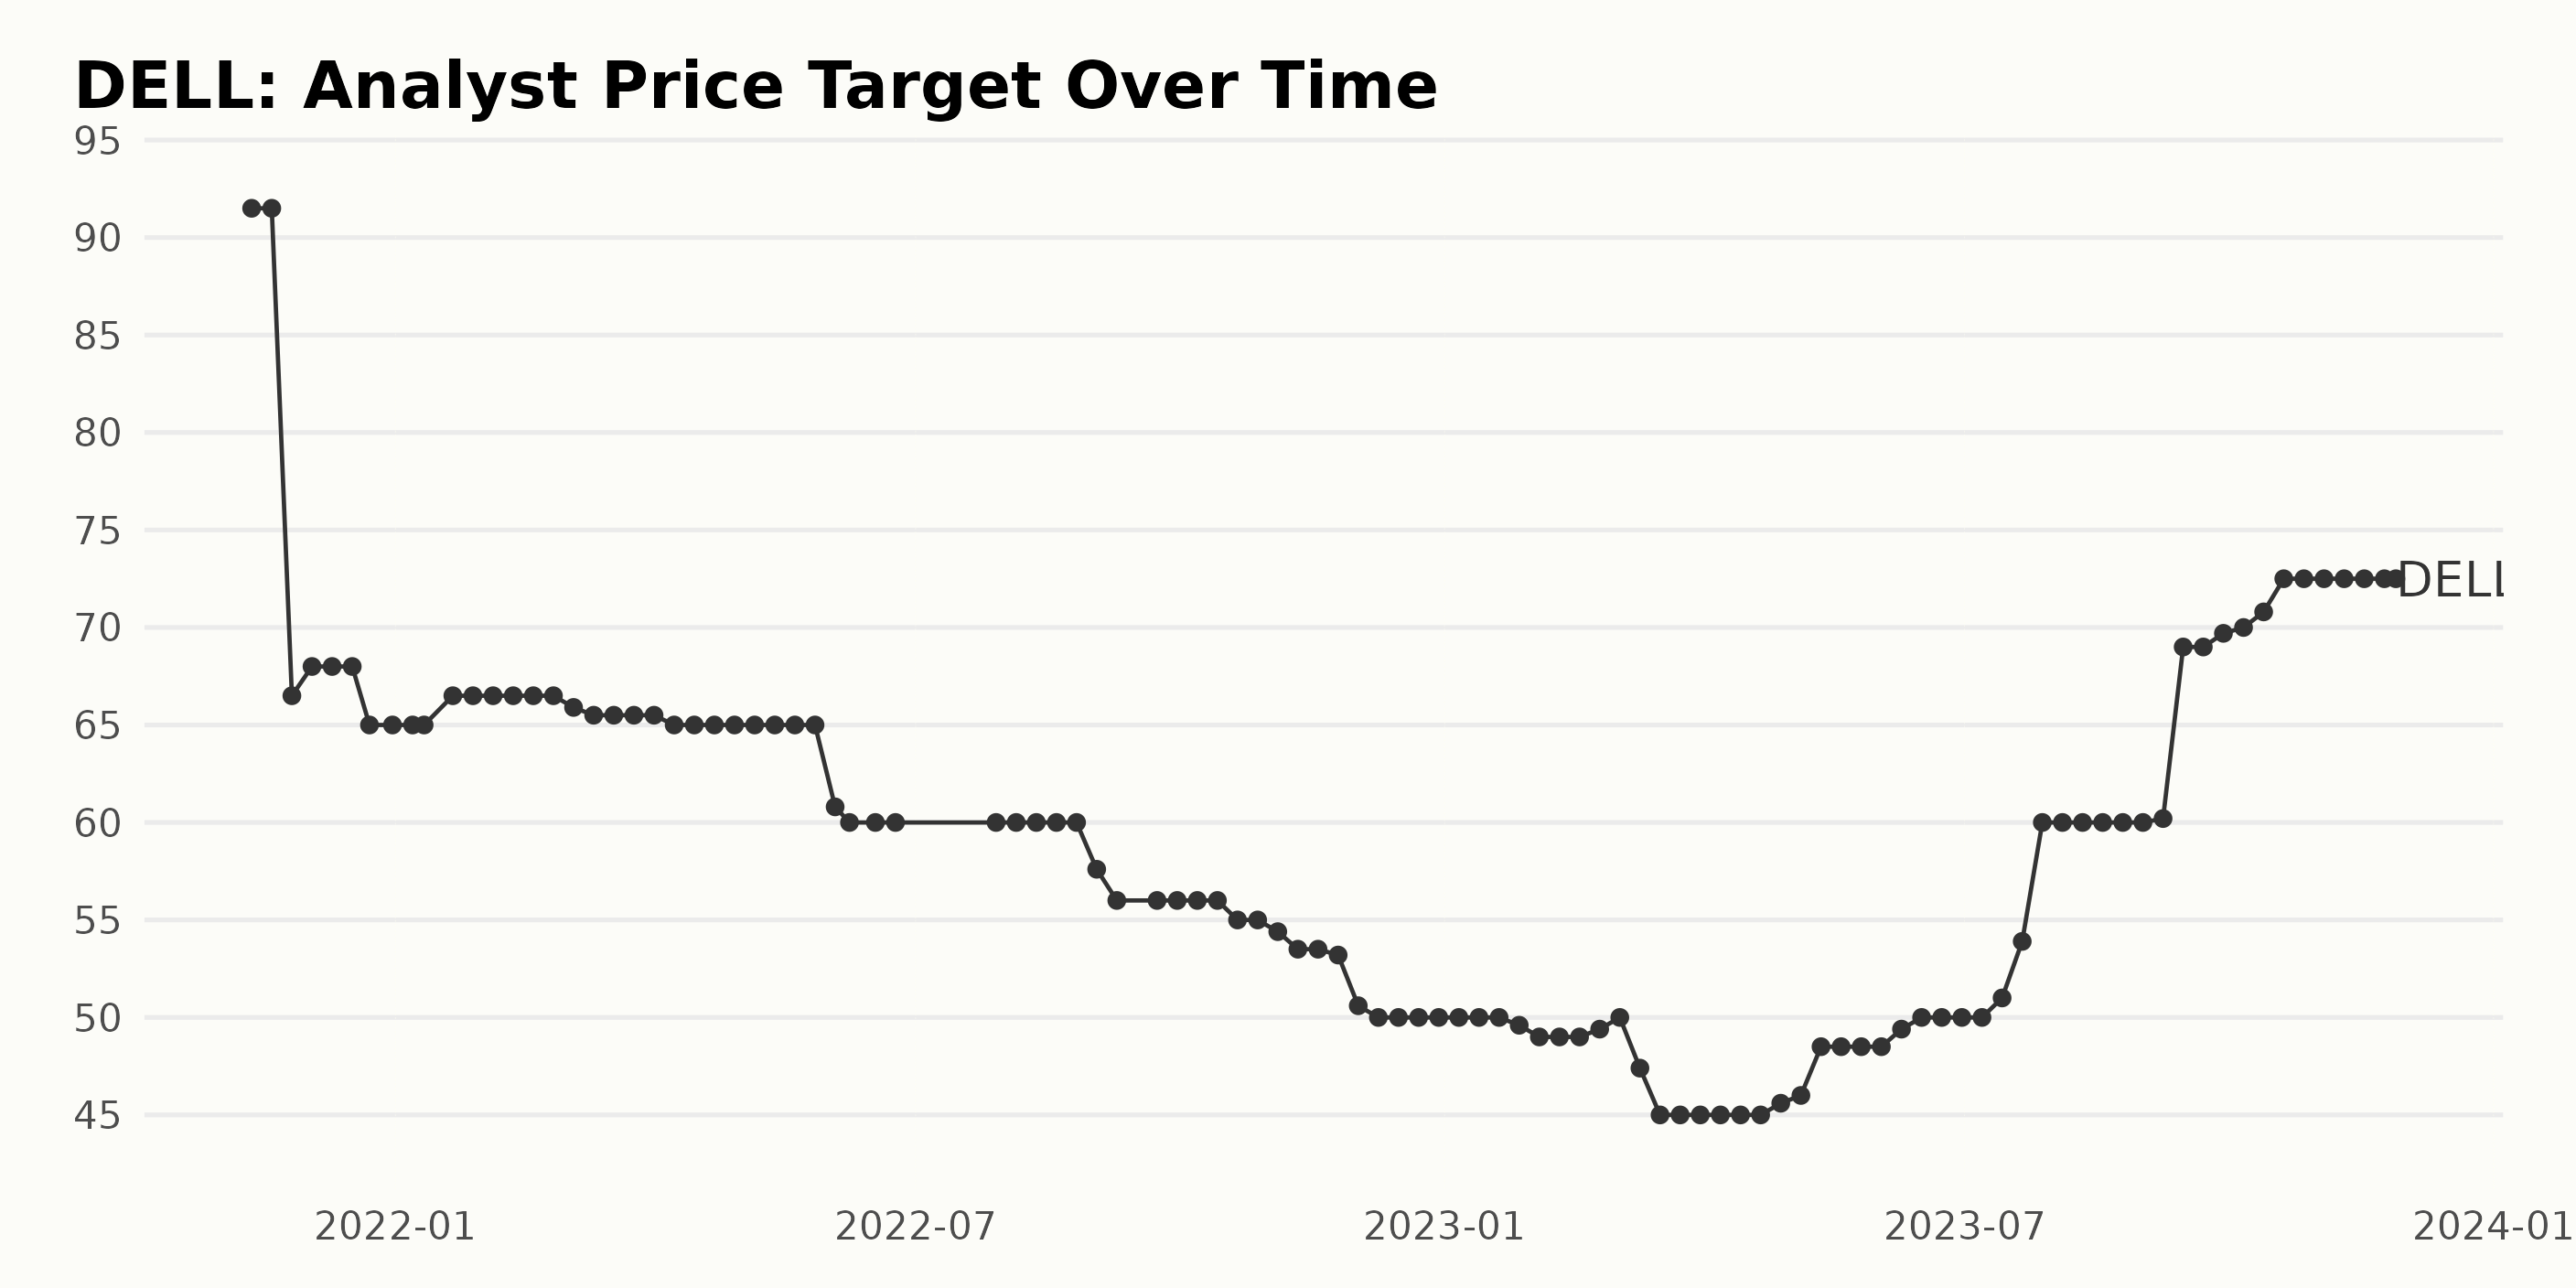
The analyst price target for DELL has shown a trend of fluctuations over the time period from November 12, 2021, to November 28, 2023.
- On November 12, 2021, DELL’s analyst price target was valued at $91.5. It was stable until November 19, 2021, after which it slipped to $66.5 on November 26, 2021.
- The value mildly rose to $68 in early December 2021 and stayed steady until mid-December before dropping once again to $65 by the end of December 2021.
- The initial months of 2022 saw some modest upticks, with the price creeping back to $66.5 in January and maintaining this rate well into February. By March, however, the rate had fluctuated down to $65.9.
- A period of slight decline followed with values falling below $61 by June 2022. The analyst price target stabilized at $60 throughout August 2022 before extending its downward trend, reaching $56 by the beginning of September 2022.
- There was again a significant drop in October 2022 to $55. The analyst price target continued to slide downward, reaching its lowest value in this series, $49, in early February 2023.
- This was, however, followed by a brief recovery period, with targets inching upwards once more and hitting $50 in March 2023. Yet, by the end of March 2023, the target had lowered again to $45.
- In May 2023, DELL’s analyst price target experienced an upswing and escalated continuously to reach $48.5. This trend continued gradually; by July 2023, the price target had been elevated to $53.9.
- The most significant jump in the series came in late July 2023, with the target spiking to $60 and maintaining this level until the beginning of September 2023.
- After slight fluctuations in early September 2023, DELL's analyst price target further increased, reaching $69 in mid-September and eventually hitting $72.5 in October 2023. This streak continued and settled at $72.5 by the end of the reported period on November 28, 2023.
Over the two-year period, the analyst price target of DELL experienced a downward trend, followed by an upward trend towards the end of the series. Therefore, it is evident that while there were periods of stability, the general trend was quite susceptible to changes.
Upward Trend Analysis: DELL Shares Surge from June-November 2023
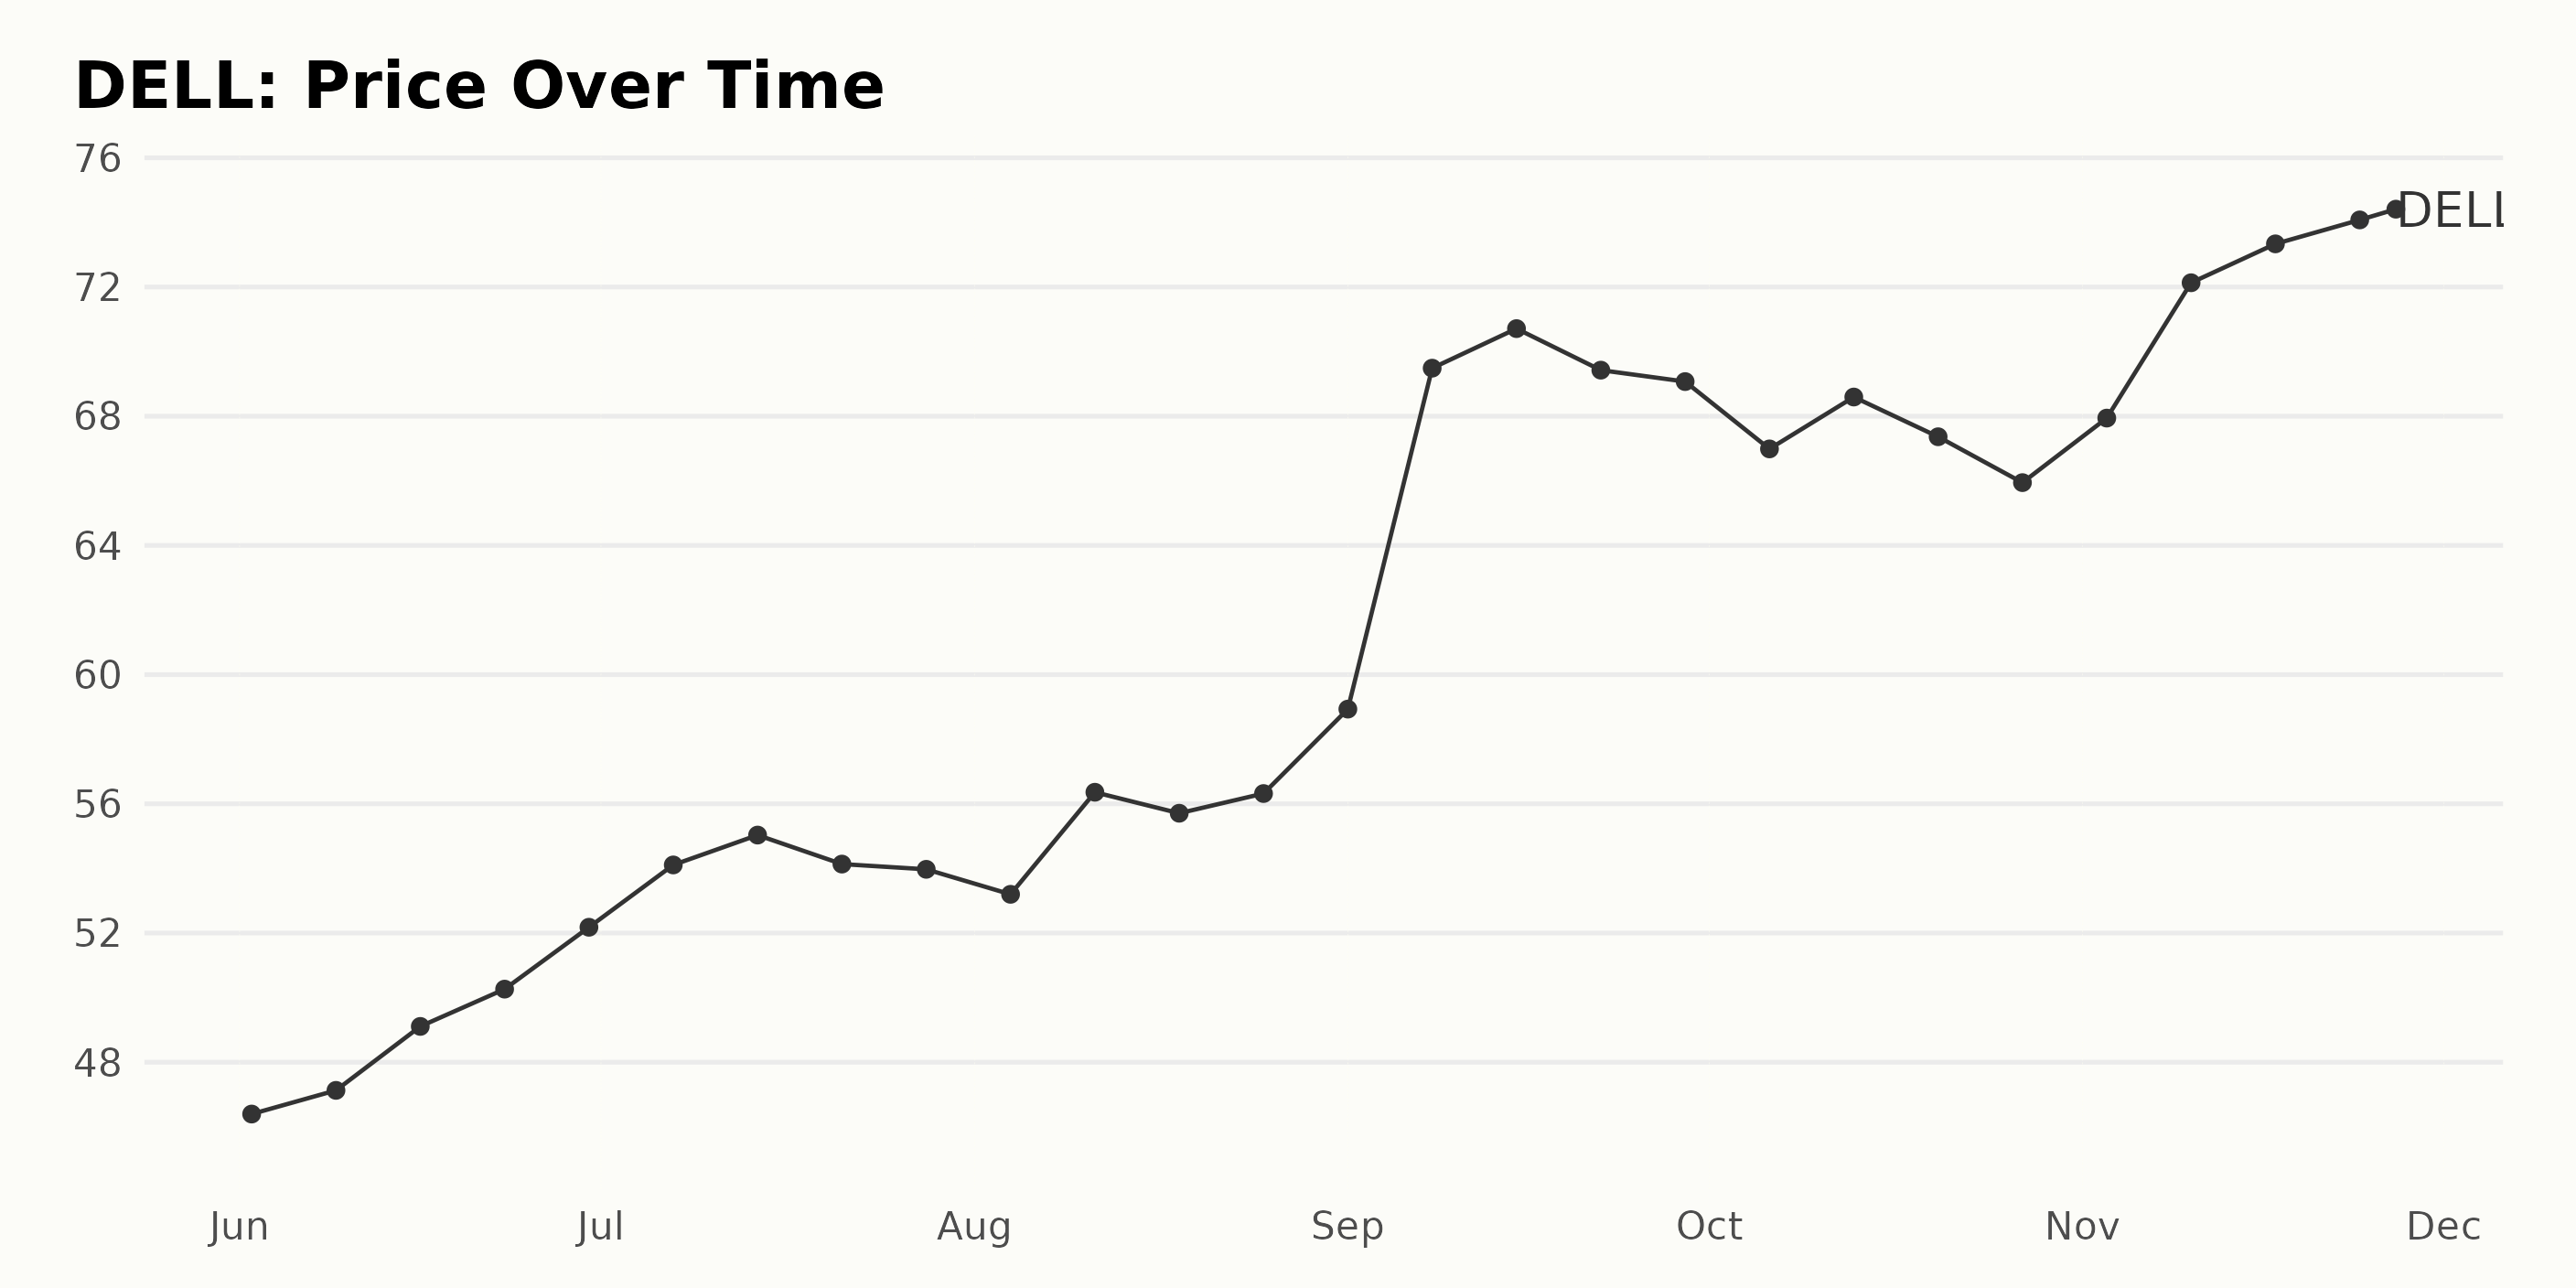
The available data reflects a generally upward trend in the share price of DELL between June and November 2023, with some fluctuation:
- On June 2, 2023, the share price was $46.40.
- The price consistently increases through June, reaching $52.18 by June 30, 2023.
- Prices continue to rise with slight fluctuations throughout July, with a peak at $55.03 on July 14, 2023, and then a drop to $53.97 by the end of the month.
- In August, the price briefly dipped to $53.20 before reaching another peak of $56.36 on August 11, 2023. It fluctuates in the mid-$50 range for the rest of August.
- The share price saw significant growth in September, jumping to a high of $70.71 on September 15, 2023.
- There's a decline in October, with the price dropping to $65.94 by the end of the month.
- November sees another climb, with the price reaching $74.41 by November 27, 2023. In terms of trends, the data seems to suggest an accelerating upward trend, starting at approximately $46 in June and ending at approximately $74 in November.
The growth rate, however, varies within this period, with the most profound increase noticed in September 2023. Despite certain temporary drops, the overall growth pattern is progressive in nature. Here is a chart of DELL's price over the past 180 days.
Evaluating DELL's Performance: Key Trends in Value, Sentiment, and Growth
Based on the provided data, DELL, which belongs to the Technology - Hardware category, sees a fluctuation in its POWR Ratings grade and rank within its category from June 2023 to November 2023. This analysis looks at a total of 37 stocks in this industry category. Here are some notable points from the data:
- DELL held a consistent POWR Grade of B (Buy) from June to mid-September 2023. During this period, its rank fluctuated between #10 and #8 in its category.
- In mid-September 2023, we see an upswing as DELL's POWR Grade rises to A (Strong Buy). This improvement continues until late October 2023, with DELL maintaining a stronghold at rank #6 within its category.
- However, by the end of October 2023, DELL's POWR Grade drops back to B (Buy). From early November to late November 2023, DELL consistently remained at B (Buy) for its POWR grade. Its ranking fluctuated slightly between #6 and #8.
To summarize, as of the latest available data, from November 25, 2023, the POWR Grade given to DELL stands at B (Buy), and its rank in the category is #8. It should be acknowledged that DELL has mostly remained in the top third of the Technology - Hardware category during the noted timeline.
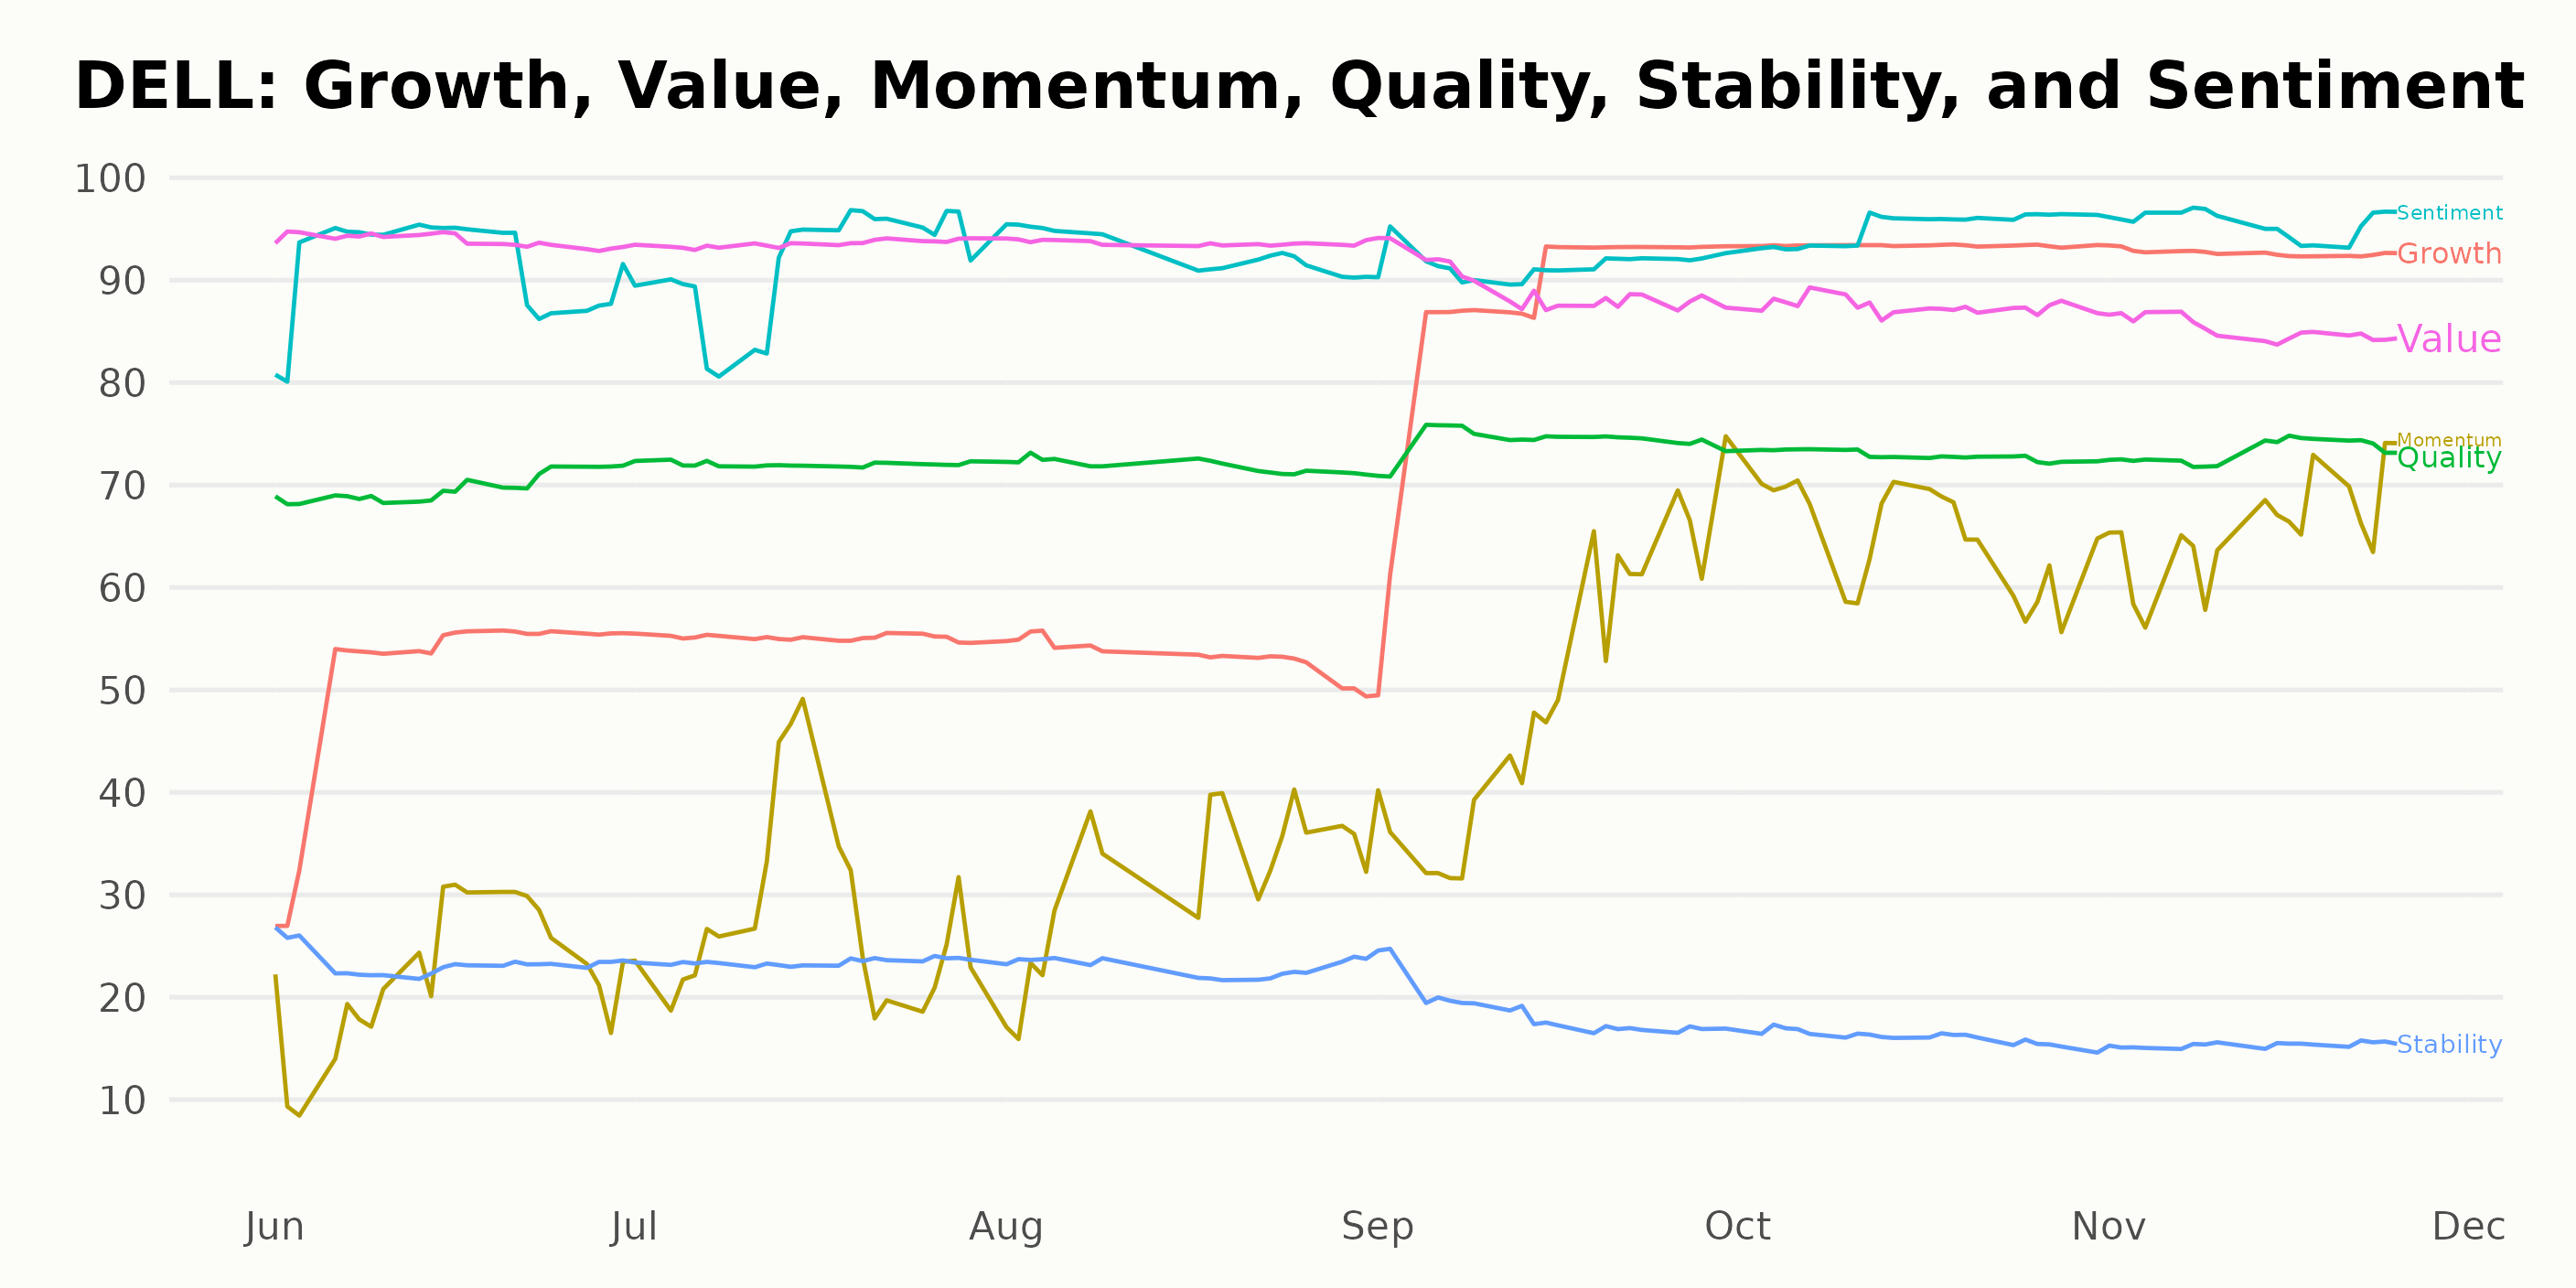
Based on the given data, the three most noteworthy dimensions of the POWR Ratings for DELL are Value, Sentiment, and Growth.
Value: This dimension continuously received the highest ratings from June 2023 to August 2023, with a score of 94. However, a noticeable downward trend started in September 2023 when the score dropped to 89 and continued to decline, reaching 85 by November 2023.
Sentiment: In terms of Sentiment, it generally maintained high scores, indicating positive market sentiment towards DELL. There was a slight increase over time, starting at 91 in June 2023 and peaking at 96 in November 2023.
Growth: The Growth dimension shows the most significant trend among the three. It started at 51 in June 2023, steadily increased to 93 in October 2023, and remained there until November 2023. This indicates a substantial positive growth trend for DELL during this period.
How does Dell Technologies Inc. (DELL) Stack Up Against its Peers?
Other stocks in the Technology - Hardware sector that may be worth considering are Vtech Holdings Limited (VTKLY), Daktronics Inc. (DAKT), and Panasonic Holdings Corporation (PCRFY) - they have better POWR Ratings. Click here to explore more Technology - Hardware stocks.
What To Do Next?
43 year investment veteran, Steve Reitmeister, has just released his 2024 market outlook along with trading plan and top 11 picks for the year ahead.
DELL shares were trading at $74.31 per share on Tuesday afternoon, down $0.15 (-0.20%). Year-to-date, DELL has gained 90.24%, versus a 20.24% rise in the benchmark S&P 500 index during the same period.
About the Author: Anushka Dutta

Anushka is an analyst whose interest in understanding the impact of broader economic changes on financial markets motivated her to pursue a career in investment research.
The post Dell Technologies Inc. (DELL) Earnings Spotlight: Tech Stock Gameplan appeared first on StockNews.com