


Canadian insurance company Sun Life Financial Inc. (SLF) reported its third-quarter financials this week, registering a 5.6% year-over-year rise in its Assets Under Management (AUM) to C$1.34 trillion ($976.40 billion). However, its underlying net income declined 2% from the prior-year quarter to C$930 million ($677.58 million).
Moreover, its underlying EPS of C$1.59 compares to the year-ago value of C$1.62 but topped the analyst estimate of C$1.57. Furthermore, while the company has been trying to expand its footprint across the United States through dental care, the U.S. dental insurance market is facing a setback due to the impact of Medicaid renewal.
Given this uncertain backdrop, let’s look at the trends of SLF’s key financial metrics to understand why it could be wise to wait for a better entry point in the stock.
Fluctuating Trends and Growth Patterns in Sun Life Financial Inc.'s Performance Metrics (2020-2023)
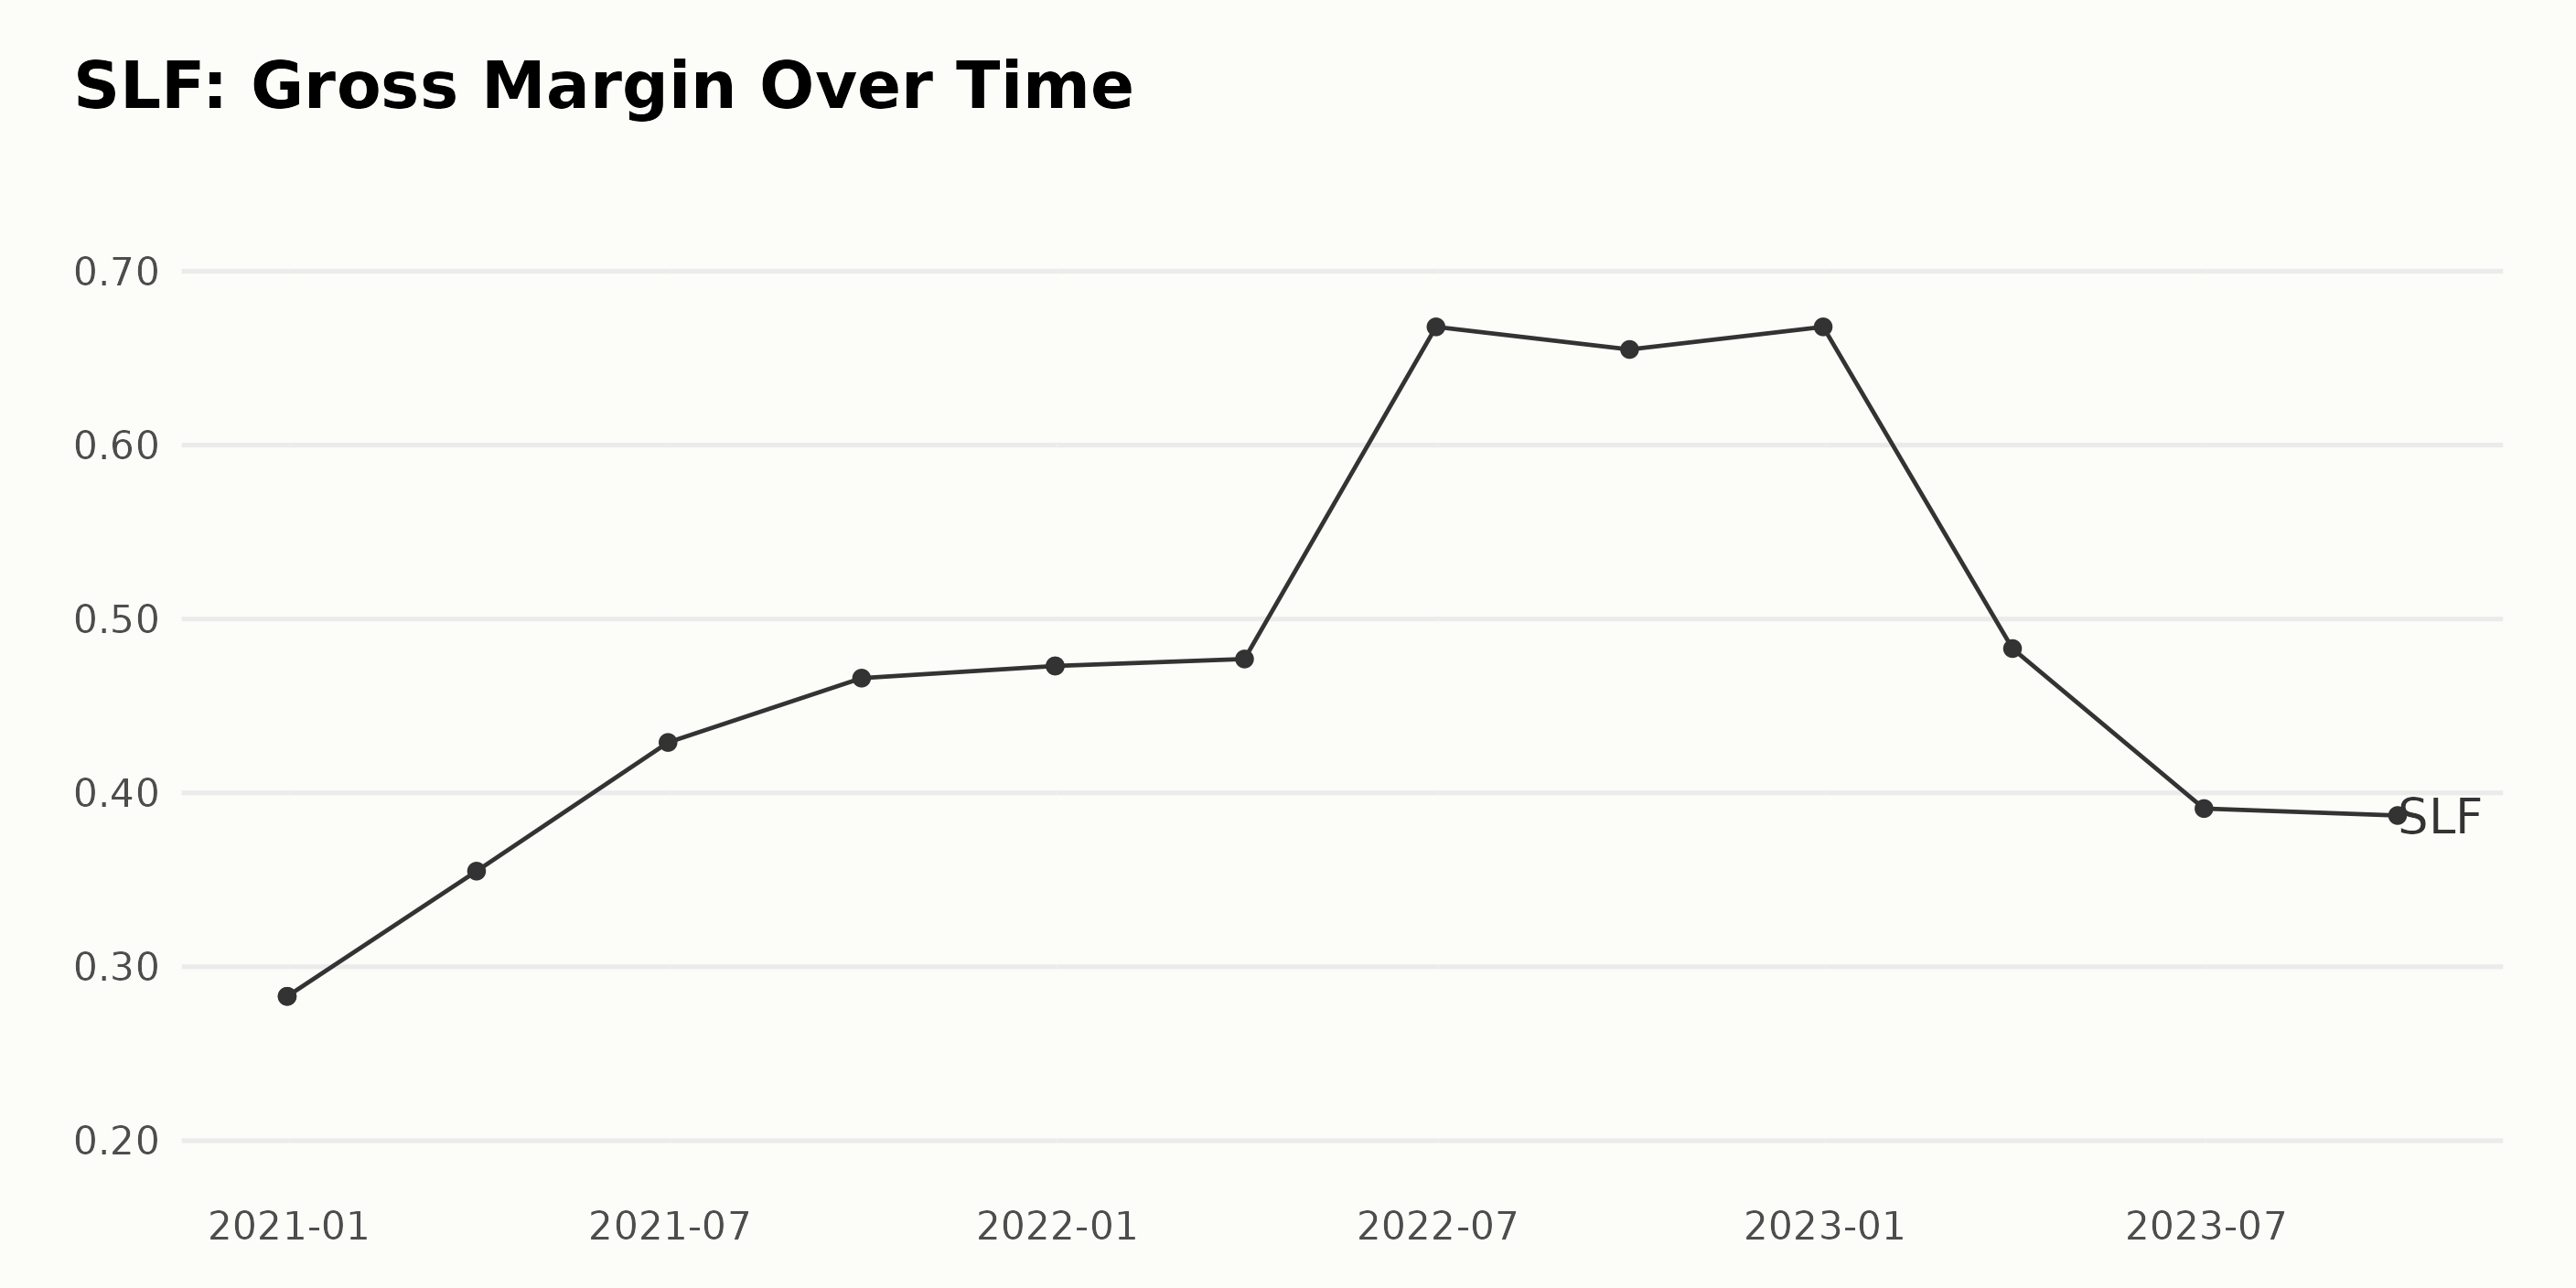
The gross margin of SLF shows a general upward trend but with significant periodic fluctuations throughout the data set. Here are the key points:
- The gross margin began at 28.3% on December 31, 2020.
- It experienced subsequent increases, reaching a peak of 47.3% by December 31, 2021.
- This continuous rising trend was, however, broken in March 2022 when the gross margin slightly dipped to 47.7%, only to rise sharply again to 66.8% by June 2022.
- Between June 2022 and September 2022, there was a slight decline to 65.5% before it increased back to 66.8% on December 31, 2022.
- However, the gross margin experienced a drastic decrease in 2023, hitting a low of 38.7% by September 30, 2023.
Looking at these numbers, SLF's gross margin has shown an increase of approximately 10.4 percentage points from 28.3% in December 2020 to 38.7% as of September 2023.
The final data point recorded for September 2023 indicates a decrease compared to the same period the previous year, suggesting a reversal in the previous trend. The fluctuation in gross margins reflects the volatility in the company's operational efficiency over the observed time period.
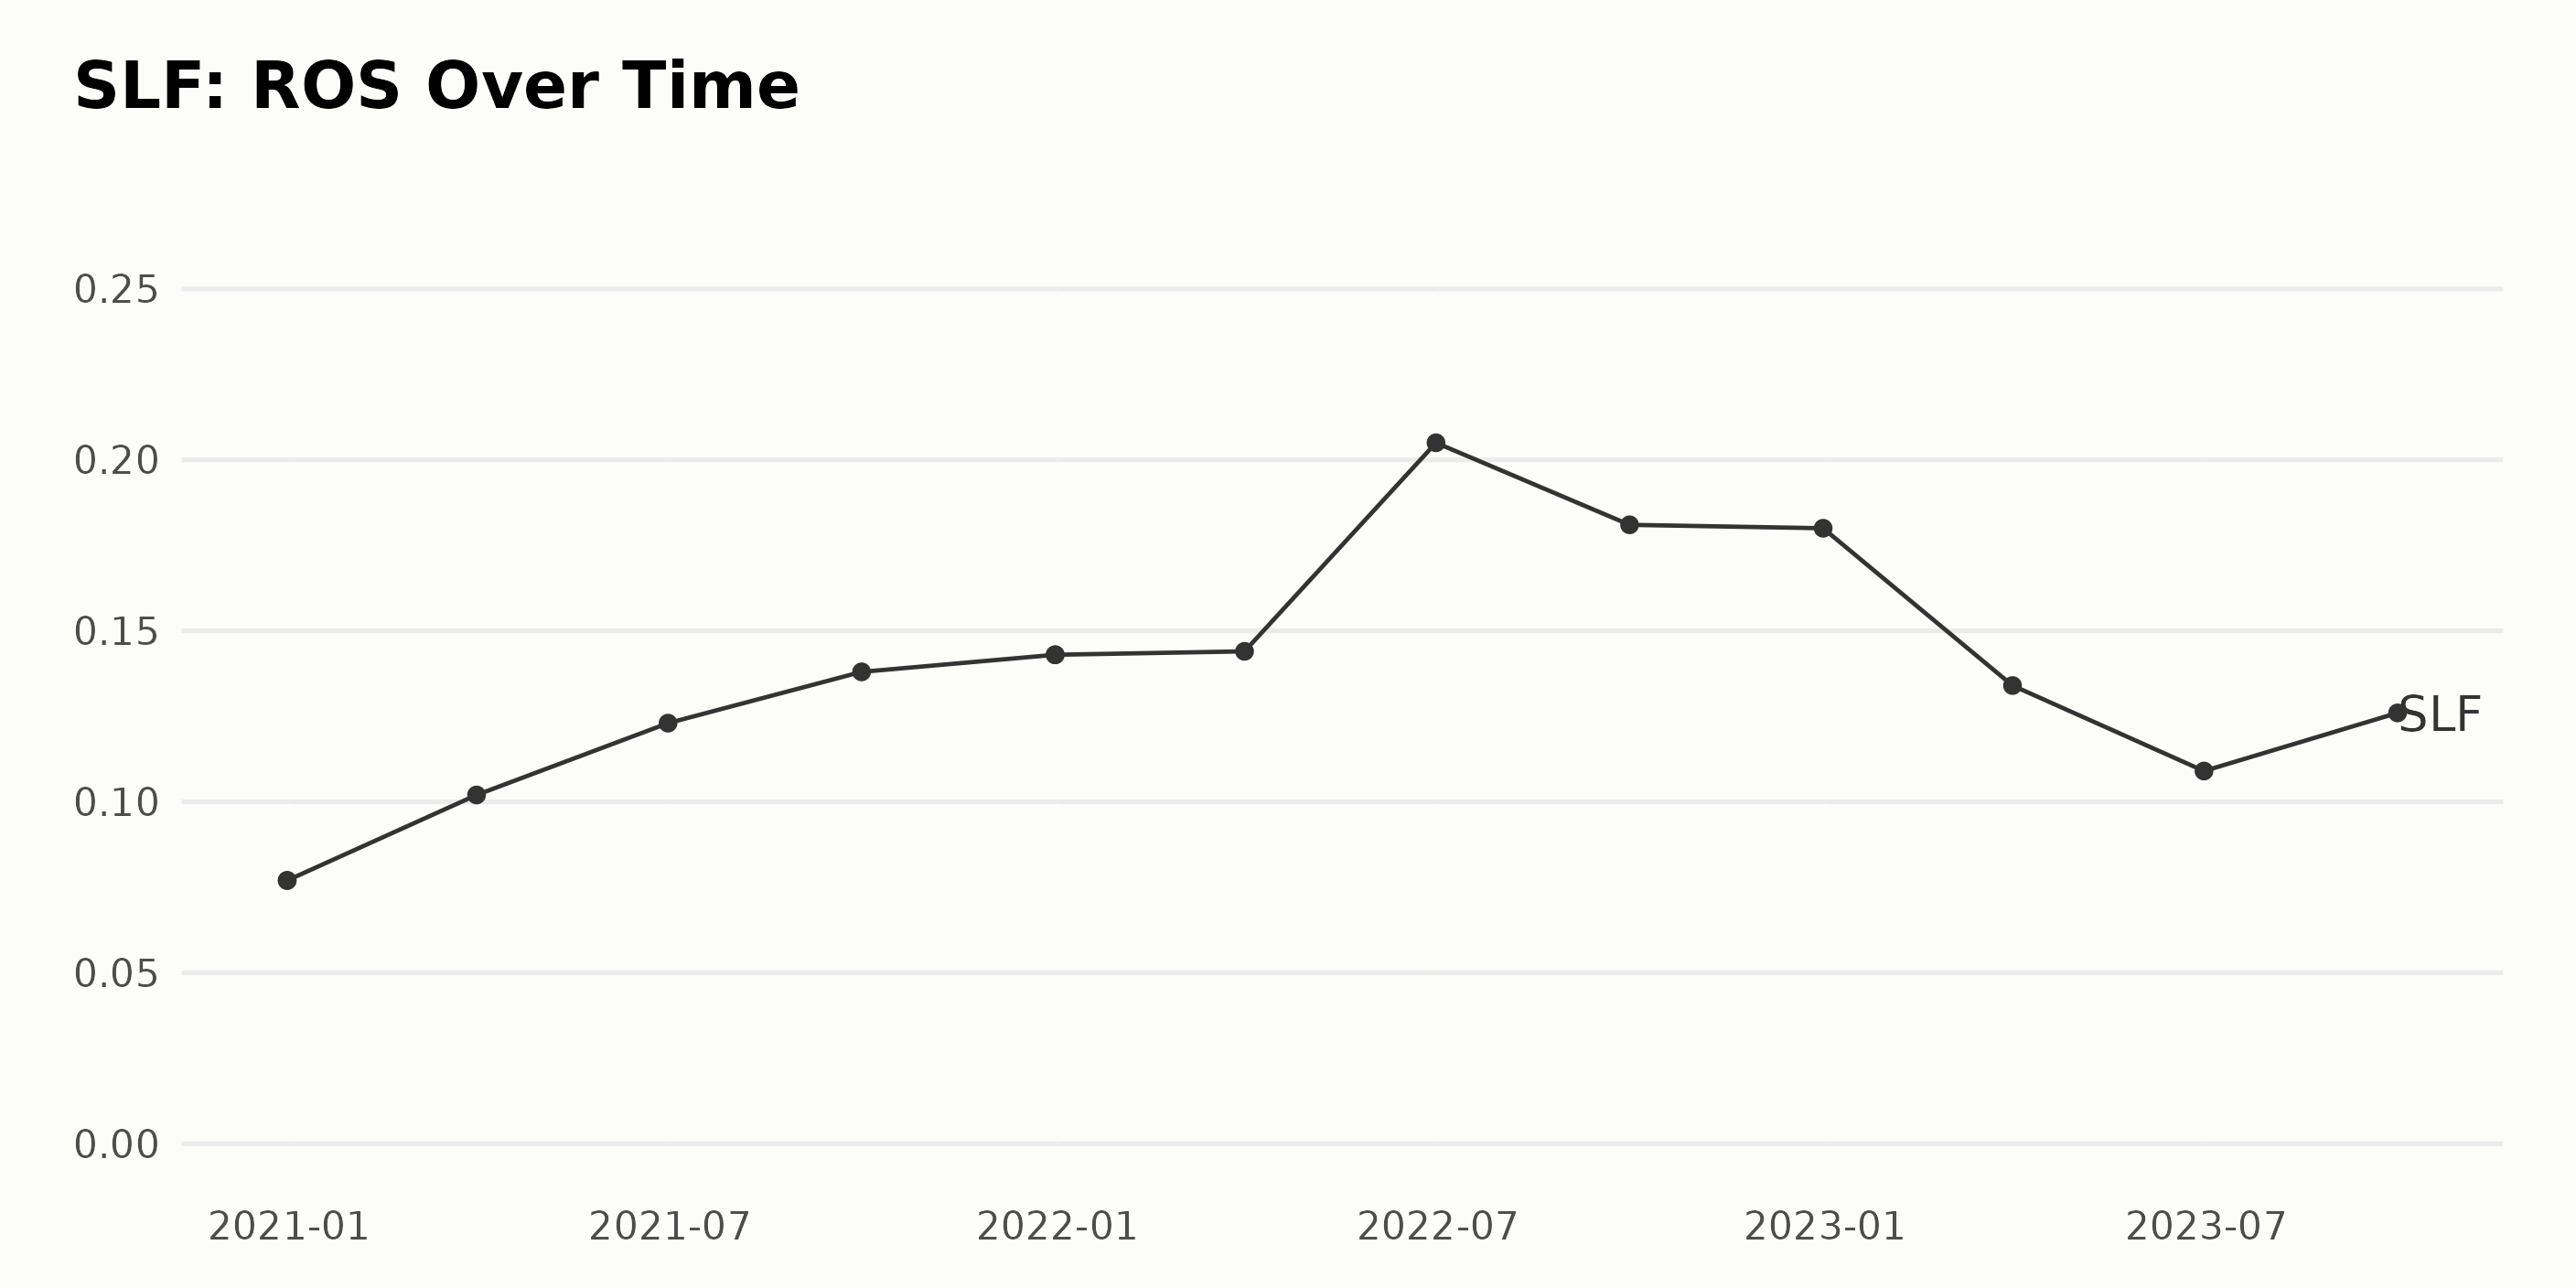
SLF's Return On Sales (ROS) has shown a fluctuating trend over the observed period.
- At the start of the recording period on December 31, 2020, the ROS was 0.077.
- This rose steadily through 2021, with minor dips and peaks, culminating in a value of 0.144 by March 2023.
- The ROS peaked significantly at 0.205 in June 2022. This sharp increase was followed by a slight dip to 0.181 in September 2022.
- It further decreased to 0.18 by the end of the year in December 2022.
- In the first quarter of 2023, the ROS saw a noticeable drop to 0.134 and further down to 0.109 in June 2023.
- By the final recorded time point on September 30, 2023, the ROS had risen slightly to 0.126.
The overall growth rate, measured from the first value to the last, indicates an increase of about 64.9%. The recent data and the last value in the series have been emphasized.
Despite the fluctuations, the general upward trend suggests positive performance for SLF during the recorded period. However, the decline in ROS through 2023 may imply potential headwinds ahead.
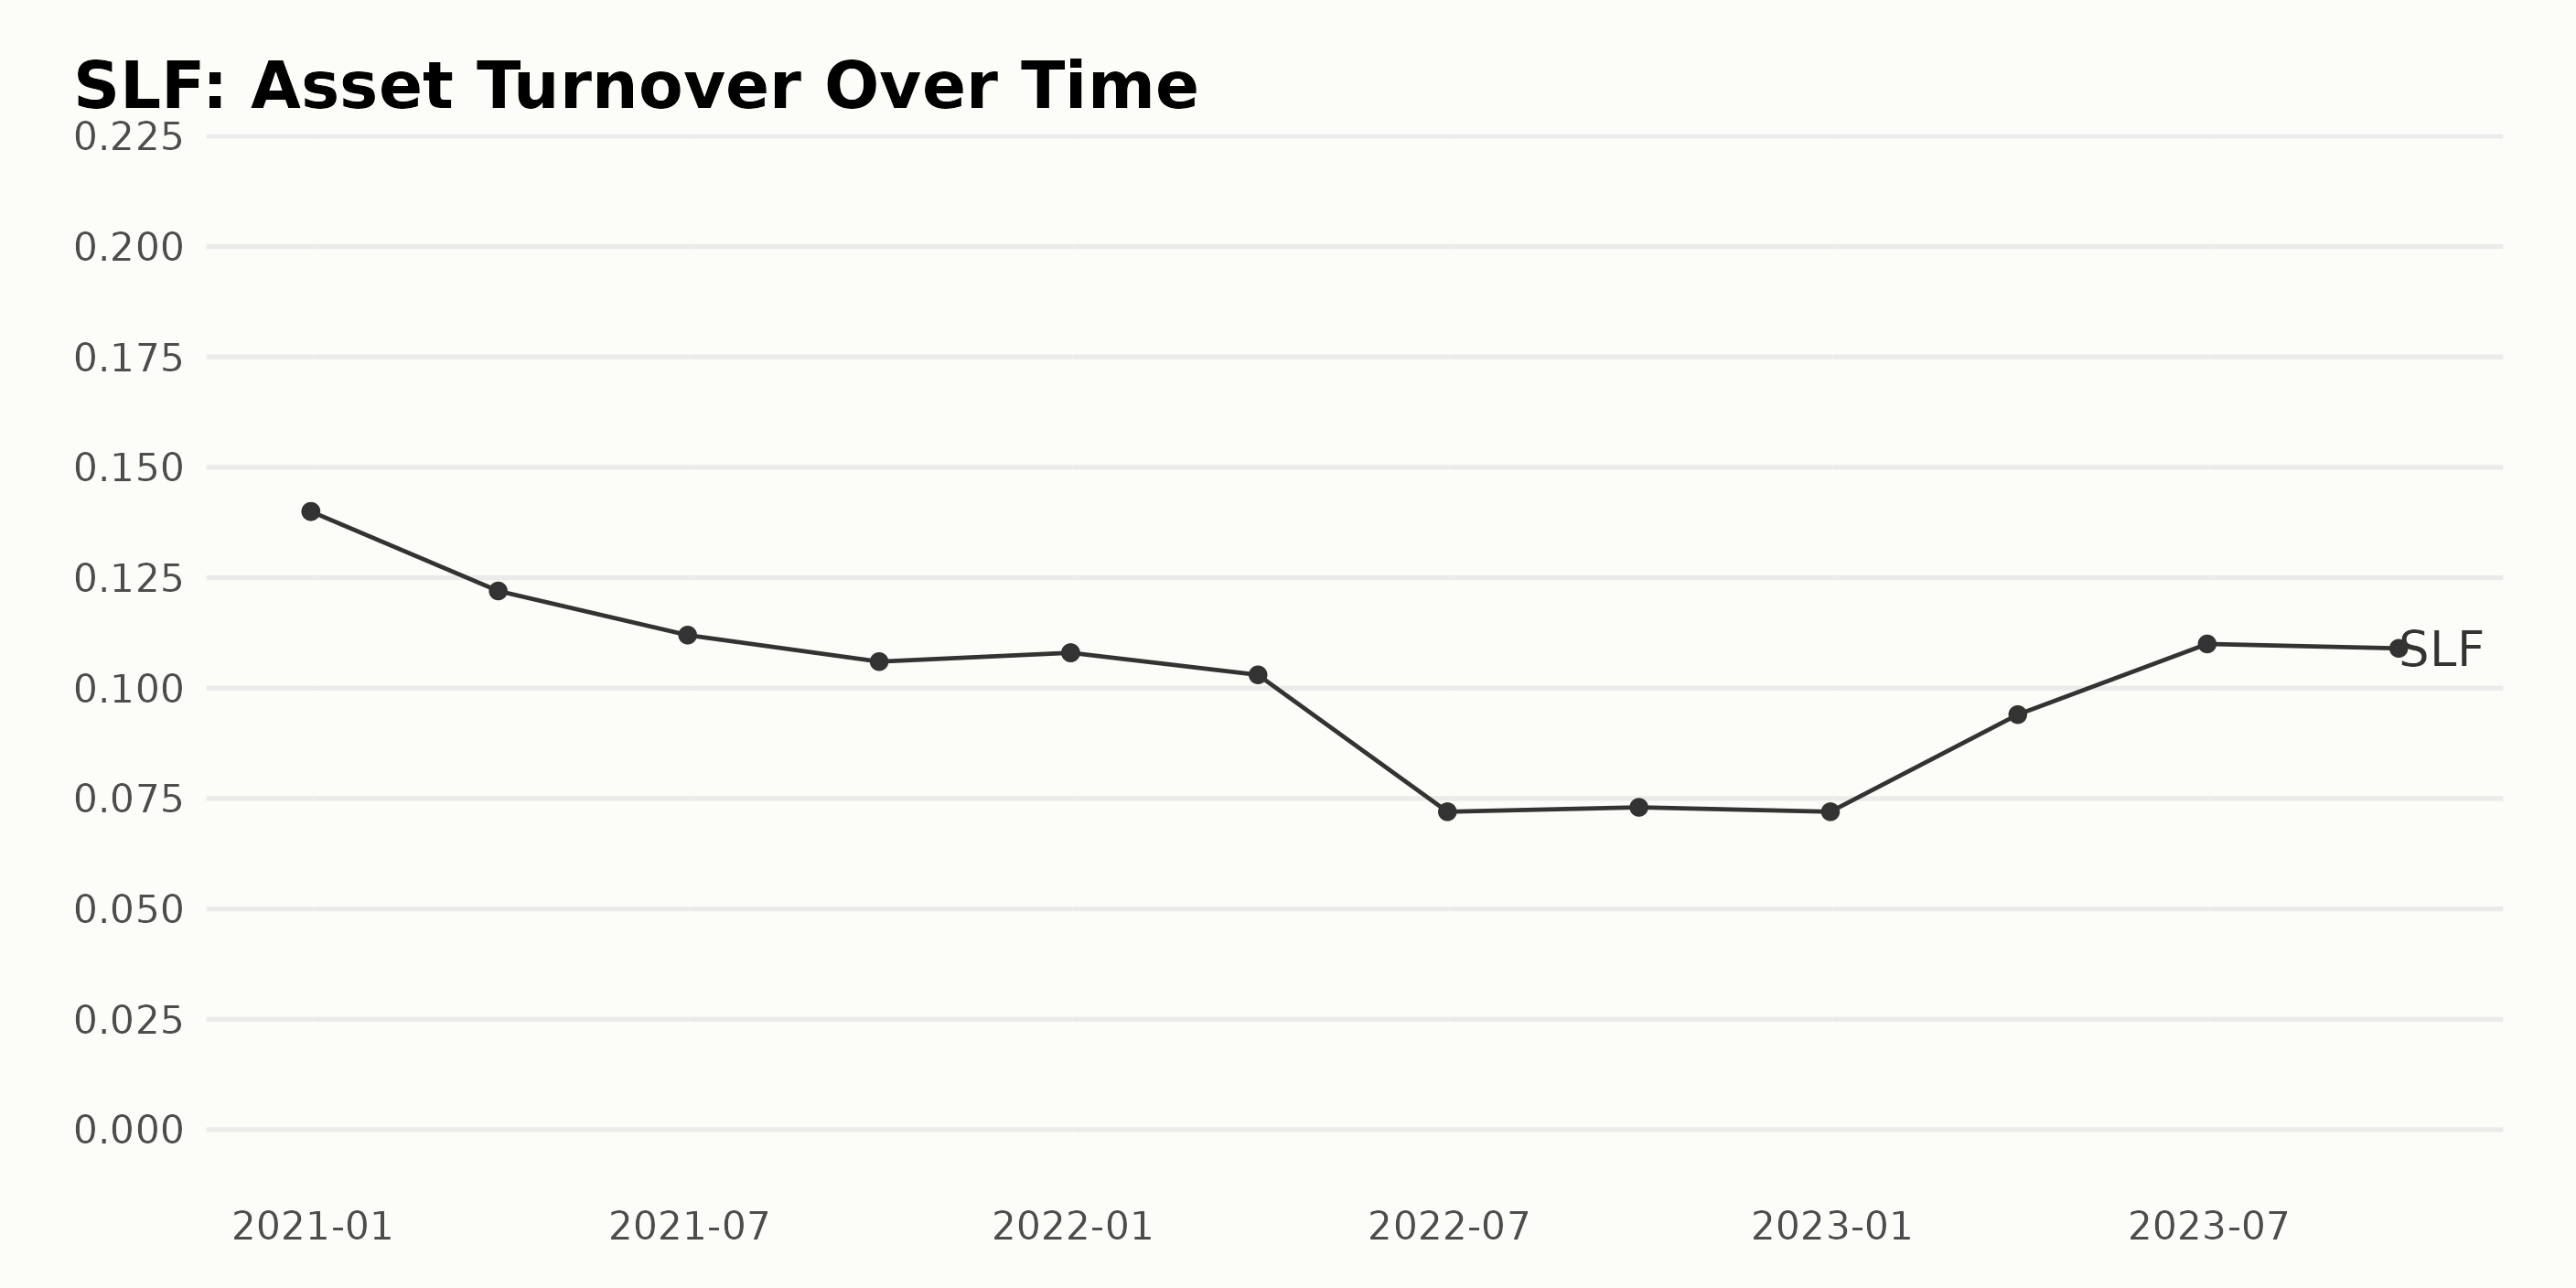
SLF's asset turnover shows a general decline over the years, demonstrating how efficiently the company is using its assets to produce sales.
- The asset turnover was reported at 0.14 on December 31, 2020.
- After an initial decrease to 0.12 on March 31, 2021, there was a steady decline during 2021, reaching a low of 0.11 in June 2021.
- SLF's asset turnover saw a slight upturn towards the end of 2021, reaching 0.108 by December 31, which represents a decline of approximately 21% from the start of that year.
- The trend continued downwards into 2022 with a significant drop to 0.072 in June, a further decrease of about 33% from the beginning of the year, and remained relatively stable for the rest of 2022.
- Results for the first three quarters of 2023 indicate an improving trend, with the asset turnover increasing to 0.11 by June 30, demonstrating a growth rate of approximately +53% from the end of 2022.
In summary, SLF's asset turnover has been declining over time, representing a decrease in the efficiency of assets' usage to generate revenues. However, recent data suggests a possible turning point with improved performance in the first half of 2023. Future data is needed to establish whether this positive trend will continue.
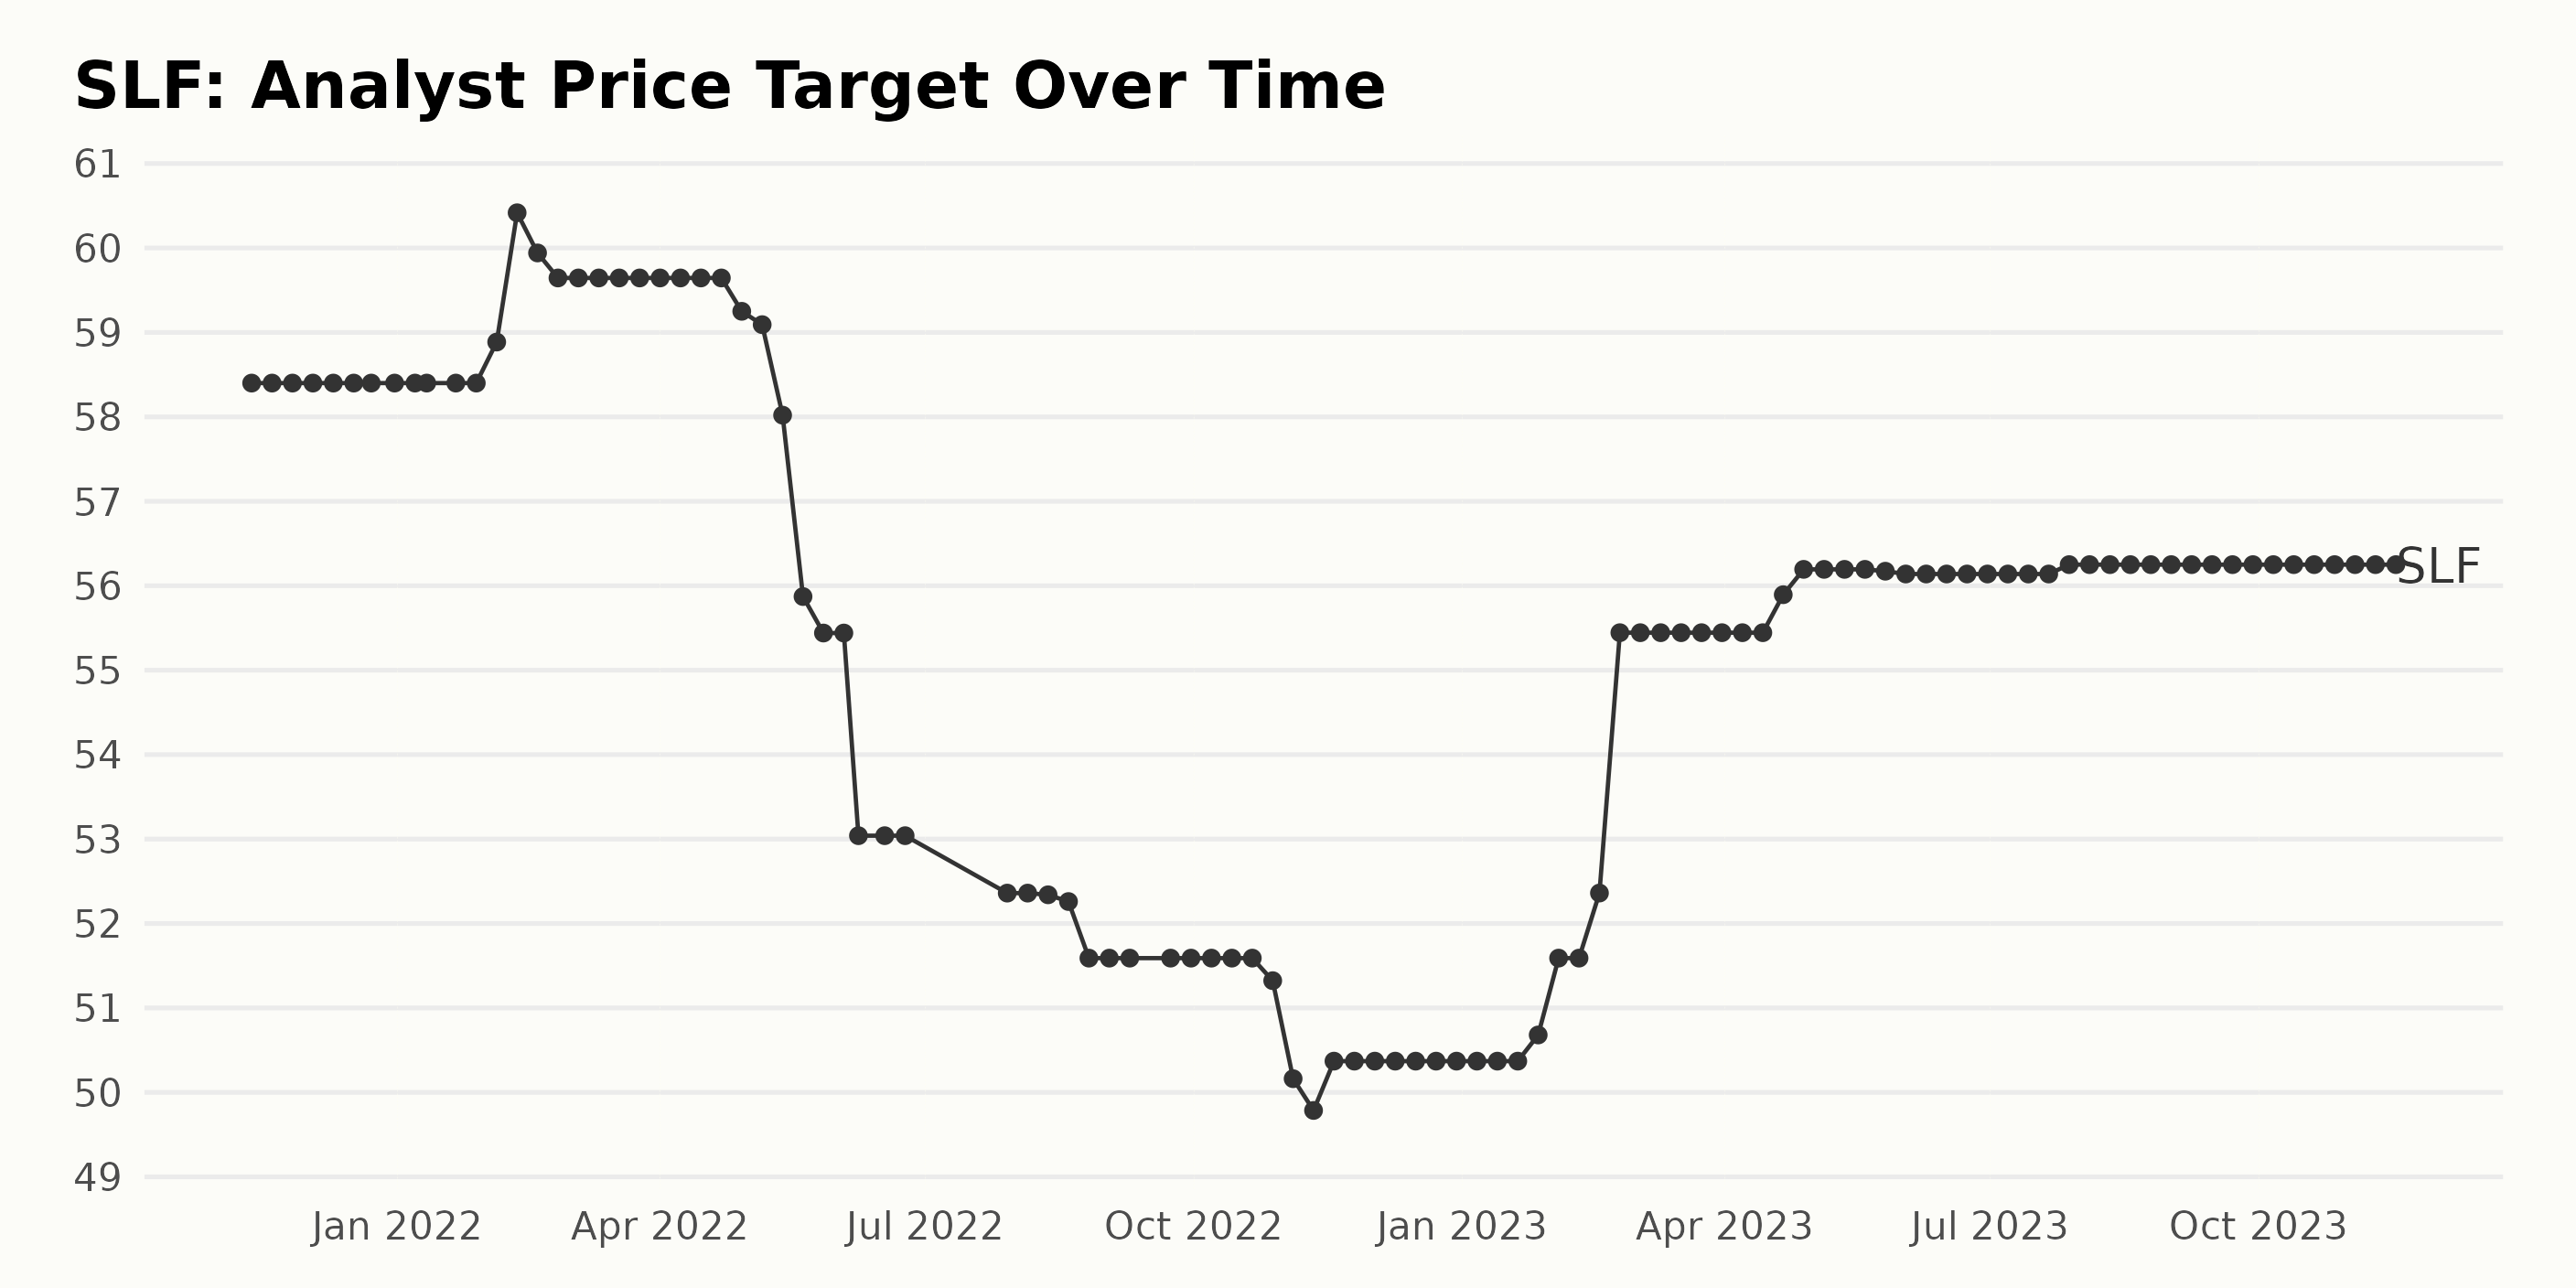
The analyst price target of SLF demonstrates a trend of fluctuation over the two-year period from November 2021 to November 2023. Key highlights include:
- The target commenced at $58.4 in November 2021, maintaining a static value until February 2022, when it started to escalate, reaching a peak of $60.42 on February 11, 2022.
- Subsequently, a downward trend was observed, where the price target fell significantly to its lowest point of $49.79 in November 2022.
- From early 2023, the price target embarked on an application, rising to $56.25 in July 2023 and holding steady through November 2023.
In terms of growth rate calculated from the first to last value, the analyst price target exhibited a mere -3.68% decrease across the two years. Over recent data, especially the last quarter of 2023, the price target remained constant at $56.25, suggesting stability during this period.
Analyzing the Fluctuation and Downward Trend in Sun Life Financial's Share Price
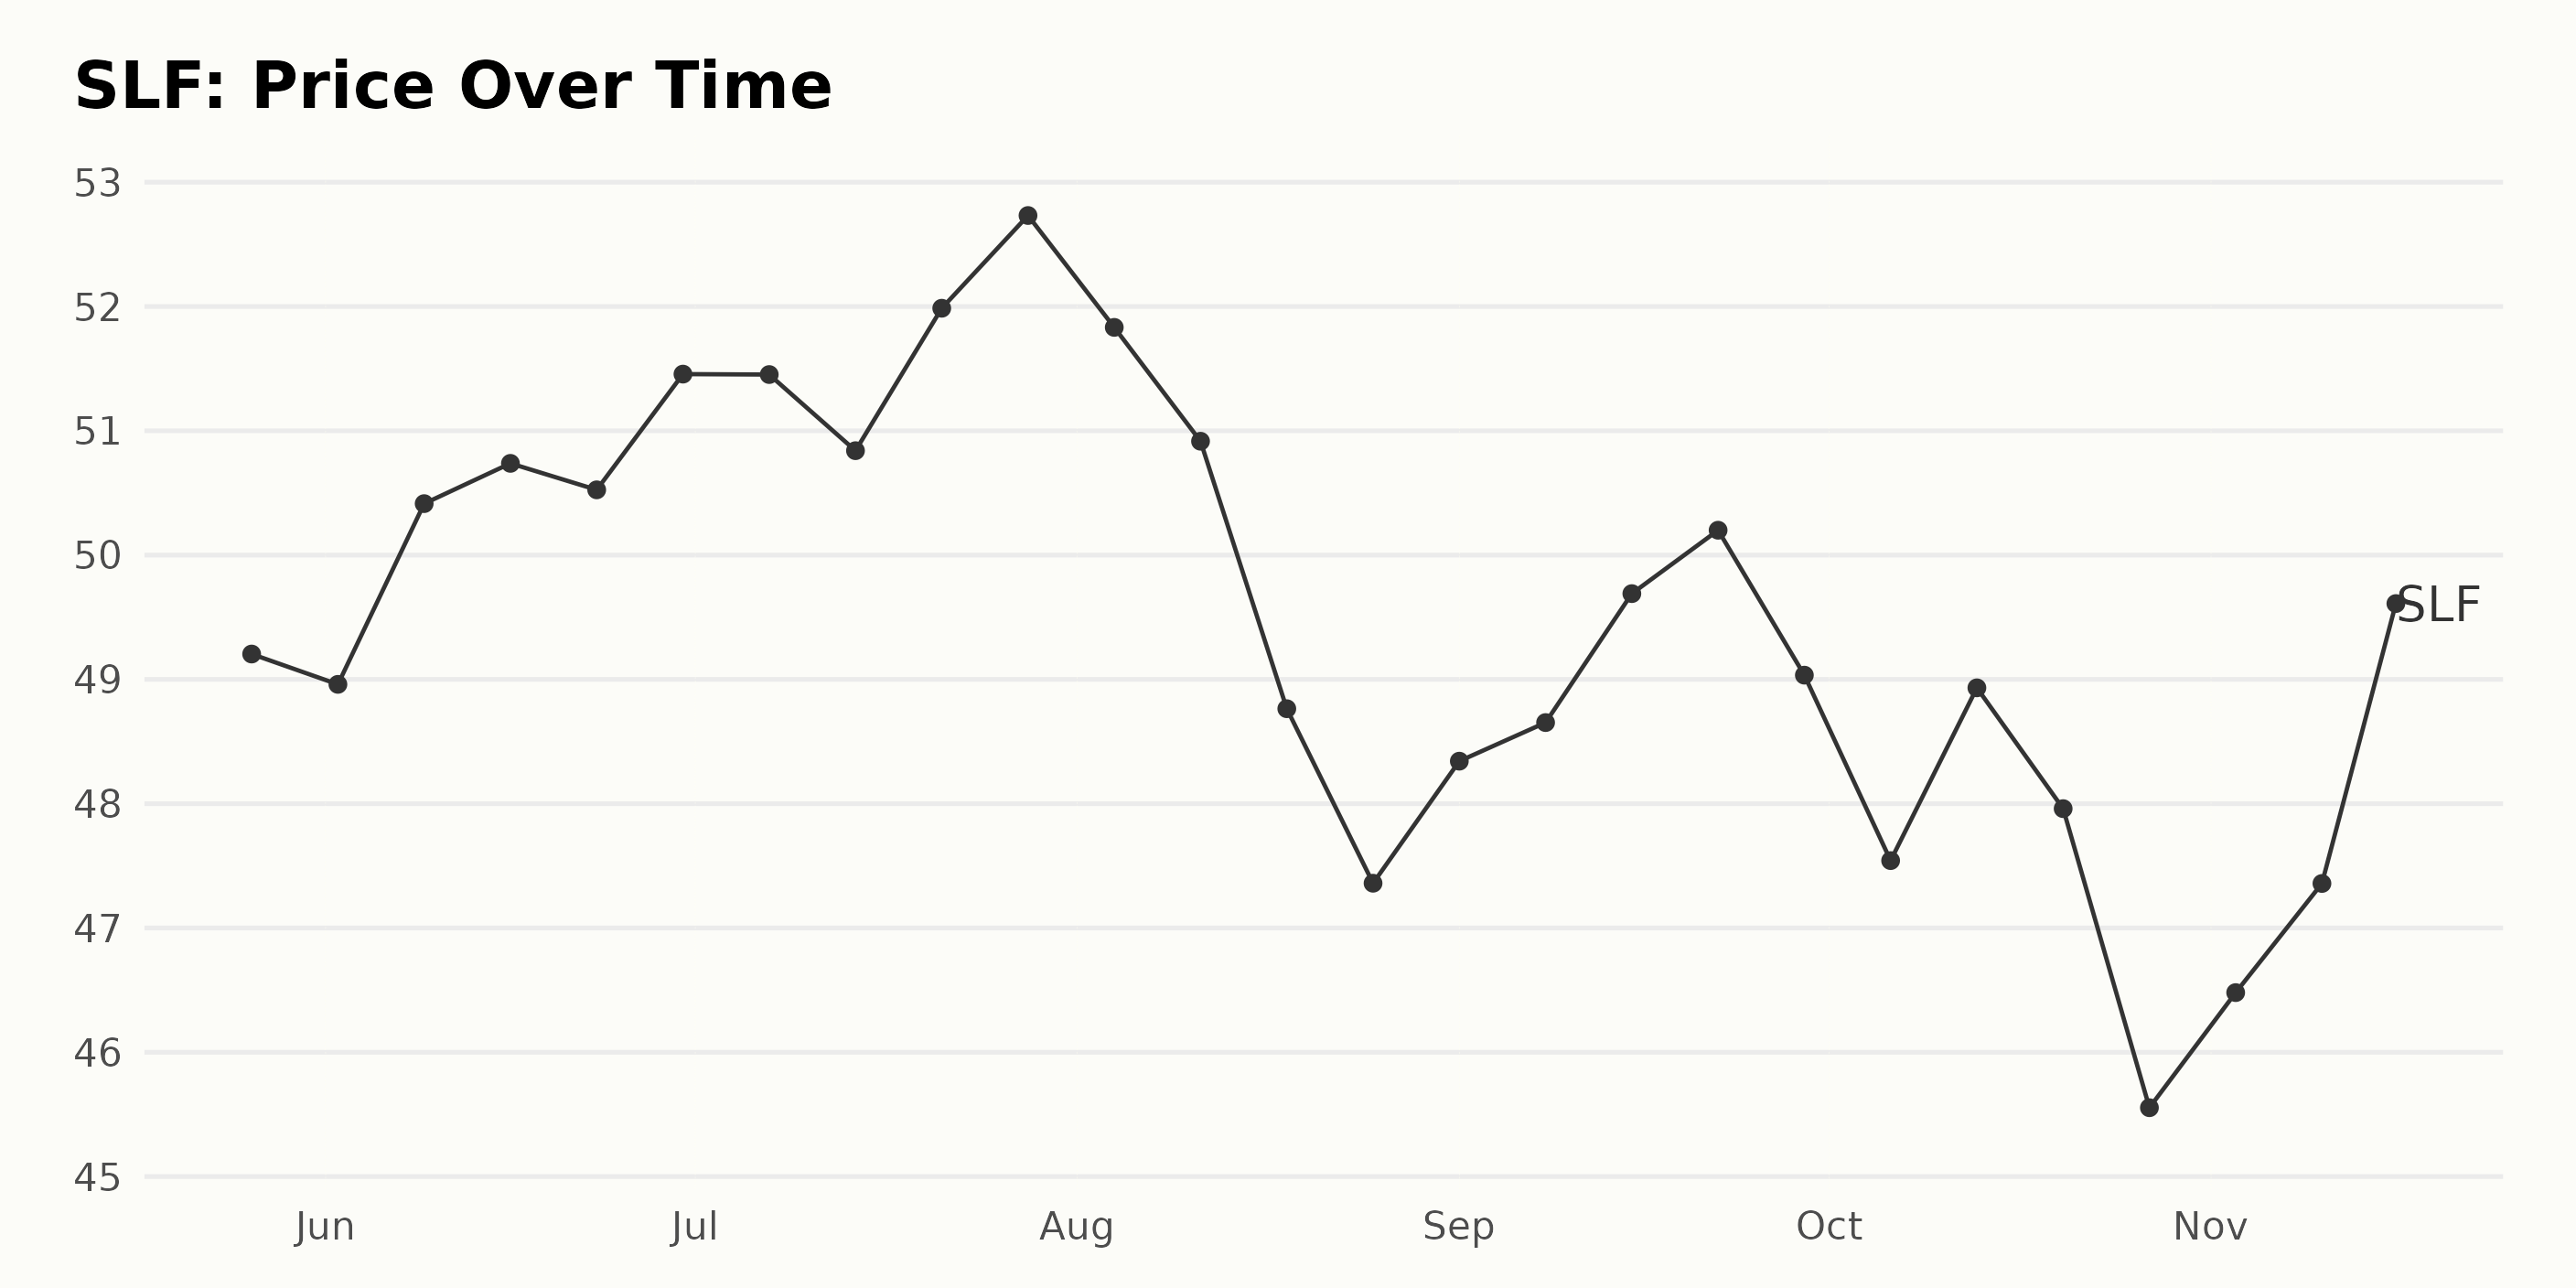
The share price of SLF has been fluctuating throughout the several months recorded in the data, with a moderate downward trend towards the end. Here are the significant points to note:
- On May 26, 2023, the share price was $49.20.
- The price dropped slightly to $48.96 on June 2 before climbing to a peak at $50.73 on June 16.
- By June 30, 2023, it climbed higher to $51.45 and maintained a similar level until mid-July.
- A minor decrease was seen in late July at $50.84, but it rose again to its highest point on July 28 at $52.73.
- Thereafter, there was a consistent decline in August, bottoming out at $47.36 on August 25, 2023.
- In early September, the price started climbing again, reaching $50.20 by September 22, 2023.
- Unfortunately, the end of September through October saw a declining trend, with the share price dipping to a low of $45.55 on October 27, 2023.
- The last few recorded weeks, in November 2023, show a slight recovery as it increased to $50.25 by November 16.
Overall, after an initial period of stability and modest growth, a clear trend of deceleration can be observed starting from August until November with temporary inclines. However, it is important to note the slight recovery in the price toward the end of the provided dataset. Here is a chart of SLF's price over the past 180 days.
Analyzing Sun Life Financial Inc.'s Ratings: Momentum, Stability, and Growth Trends
The POWR Ratings grade for SLF, which is within the Insurance - Property & Casualty sector encompassing 56 stocks, had a consistent grade of C (Neutral) throughout the provided timeframe from May 27, 2023, to November 17, 2023. Some key observations include:
- On May 27, 2023, it was ranked #28 out of 56 among the category, placing it almost mid-way in the rankings.
- Over the weeks, its category ranking significantly varied. Though it enjoyed slight enhancements at times, such as getting to #27 by July 2023, the overall trend indicated a gradual slip in its rank.
- By the end of the data set on November 17, 2023, it had a much lower performance, ranking #45 within the category.
Notably, while the POWR grade maintained a steady C (Neutral), suggesting mediocre performance, the fluctuations in its ranking within the category underline an unstable position amidst its peers over time. This could potentially indicate variability in the company's performance relative to other companies within the Insurance - Property & Casualty category.
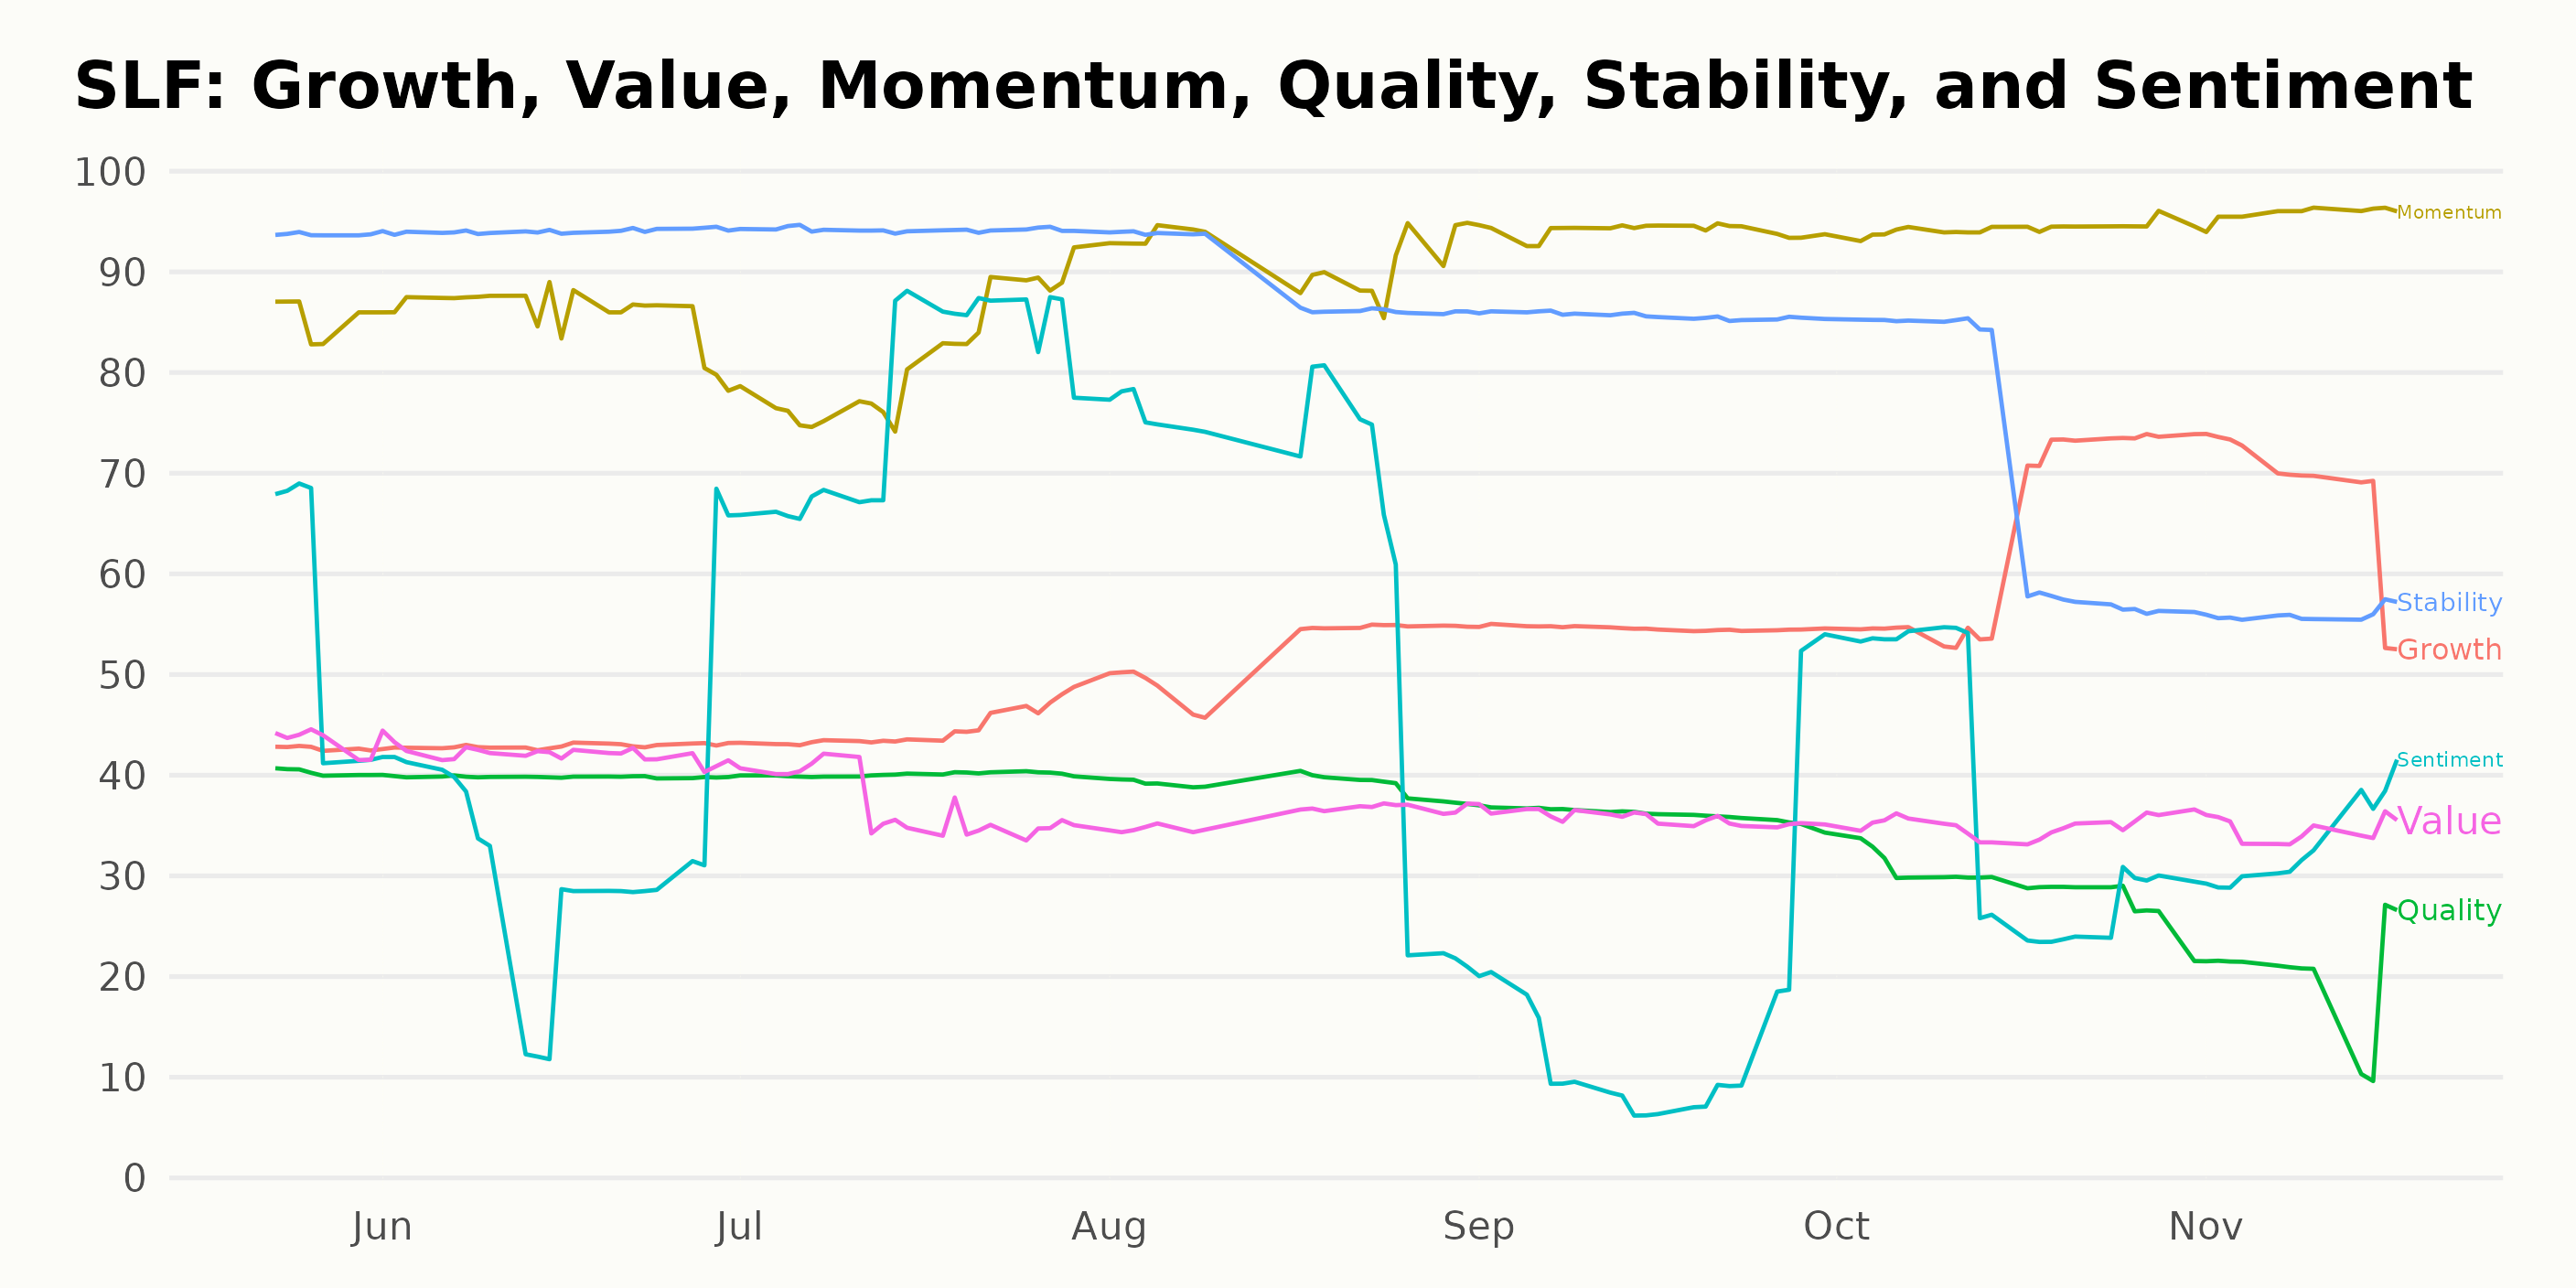
The three most noteworthy dimensions for SLF, according to the POWR Ratings, are Momentum, Stability, and Growth.
Momentum: The Momentum rating for SLF has been consistently high. In May 2023, it was at 86, and despite a minor dip to 81 in July 2023, it sharply climbed back up, peaking at a strong 96 by November 17, 2023.
Stability: Initially starting with the highest value, the Stability rating showcased a remarkable consistency with a score of 94 from May through July 2023. However, over time, there has been a noticeable decline in this dimension's performance, sliding gradually down to 56 by November 17, 2023.
Growth: The Growth dimension showed a clear upward trend. Starting with a moderate score of 43 in May 2023, it steadily improved month by month, reaching a high of 68 by November 17, 2023.
It is vital to monitor these trends consistently to assess the performance of SLF effectively. The data indicates a steady rise in momentum and growth over the period, suggesting the company is on a positive trajectory. However, the decreasing stability rating may be a point of concern requiring further exploration.
How does Sun Life Financial Inc. (SLF) Stack Up Against its Peers?
Other stocks in the Insurance - Property & Casualty sector that may be worth considering are The Hartford Financial Services Group, Inc. (HIG), Loews Corporation (L), and Universal Insurance Holdings, Inc. (UVE) - they have better POWR Ratings. Click here to explore more Insurance - Property & Casualty stocks.
What To Do Next?
Get your hands on this special report with 3 low priced companies with tremendous upside potential even in today’s volatile markets:
3 Stocks to DOUBLE This Year >
SLF shares were trading at $50.78 per share on Friday afternoon, up $0.53 (+1.05%). Year-to-date, SLF has gained 13.19%, versus a 19.05% rise in the benchmark S&P 500 index during the same period.
About the Author: Anushka Dutta

Anushka is an analyst whose interest in understanding the impact of broader economic changes on financial markets motivated her to pursue a career in investment research.
The post Decoding Sun Life Financial's (SLF) Q3 Earnings: Is It Time to Invest? appeared first on StockNews.com