


BJ's Wholesale Club Holdings, Inc. (BJ) has emerged as a business to watch, consistently surpassing the Street earnings per share (EPS) estimates for the trailing four quarters. This successful trend stirs investor anticipation as the company is slated to release its third-quarter report on November 17.
The company has been strategically strengthening its market stance and financial health, notably enhancing omnichannel capabilities and branching out into high-demand categories.
For the third quarter, BJ is projected to record a rise in its top line figures. Conversely, the bottom line is expected to depict a year-over-year decline. Industry analysts forecast BJ’s revenue at $4.91 billion, signifying a 2.7% year-over-year increase. However, its EPS is anticipated to witness a 4.4% dip from the same period last year, to $0.95.
Meanwhile, significant insider sell-offs occurred in October 2023. Jeff Desroches, Executive Vice President and Chief Operating Officer of BJ, offloaded 33,934 of his shares on October 16. Shortly before this, on October 10, Laura Felice, Executive Vice President and Chief Financial Officer, sold 46,586 company shares. These transactions mark a series of insider sales throughout the past year with no corresponding insider purchases, hinting at a potential trepidation regarding the corporation's future performance among its high-ranking personnel.
Given that past year saw 17 insider sells and zero insider buys, this could indicate a wavering confidence internally.
Considering these multifaceted signals, it could be judicious to wait for a more favorable entry point for investment. To glean further insights into BJ's financial health and prospects, let us delve into a comprehensive analysis of key financial metrics.
Examining BJ Financial Performance: An In-depth Analysis from 2021 to 2023
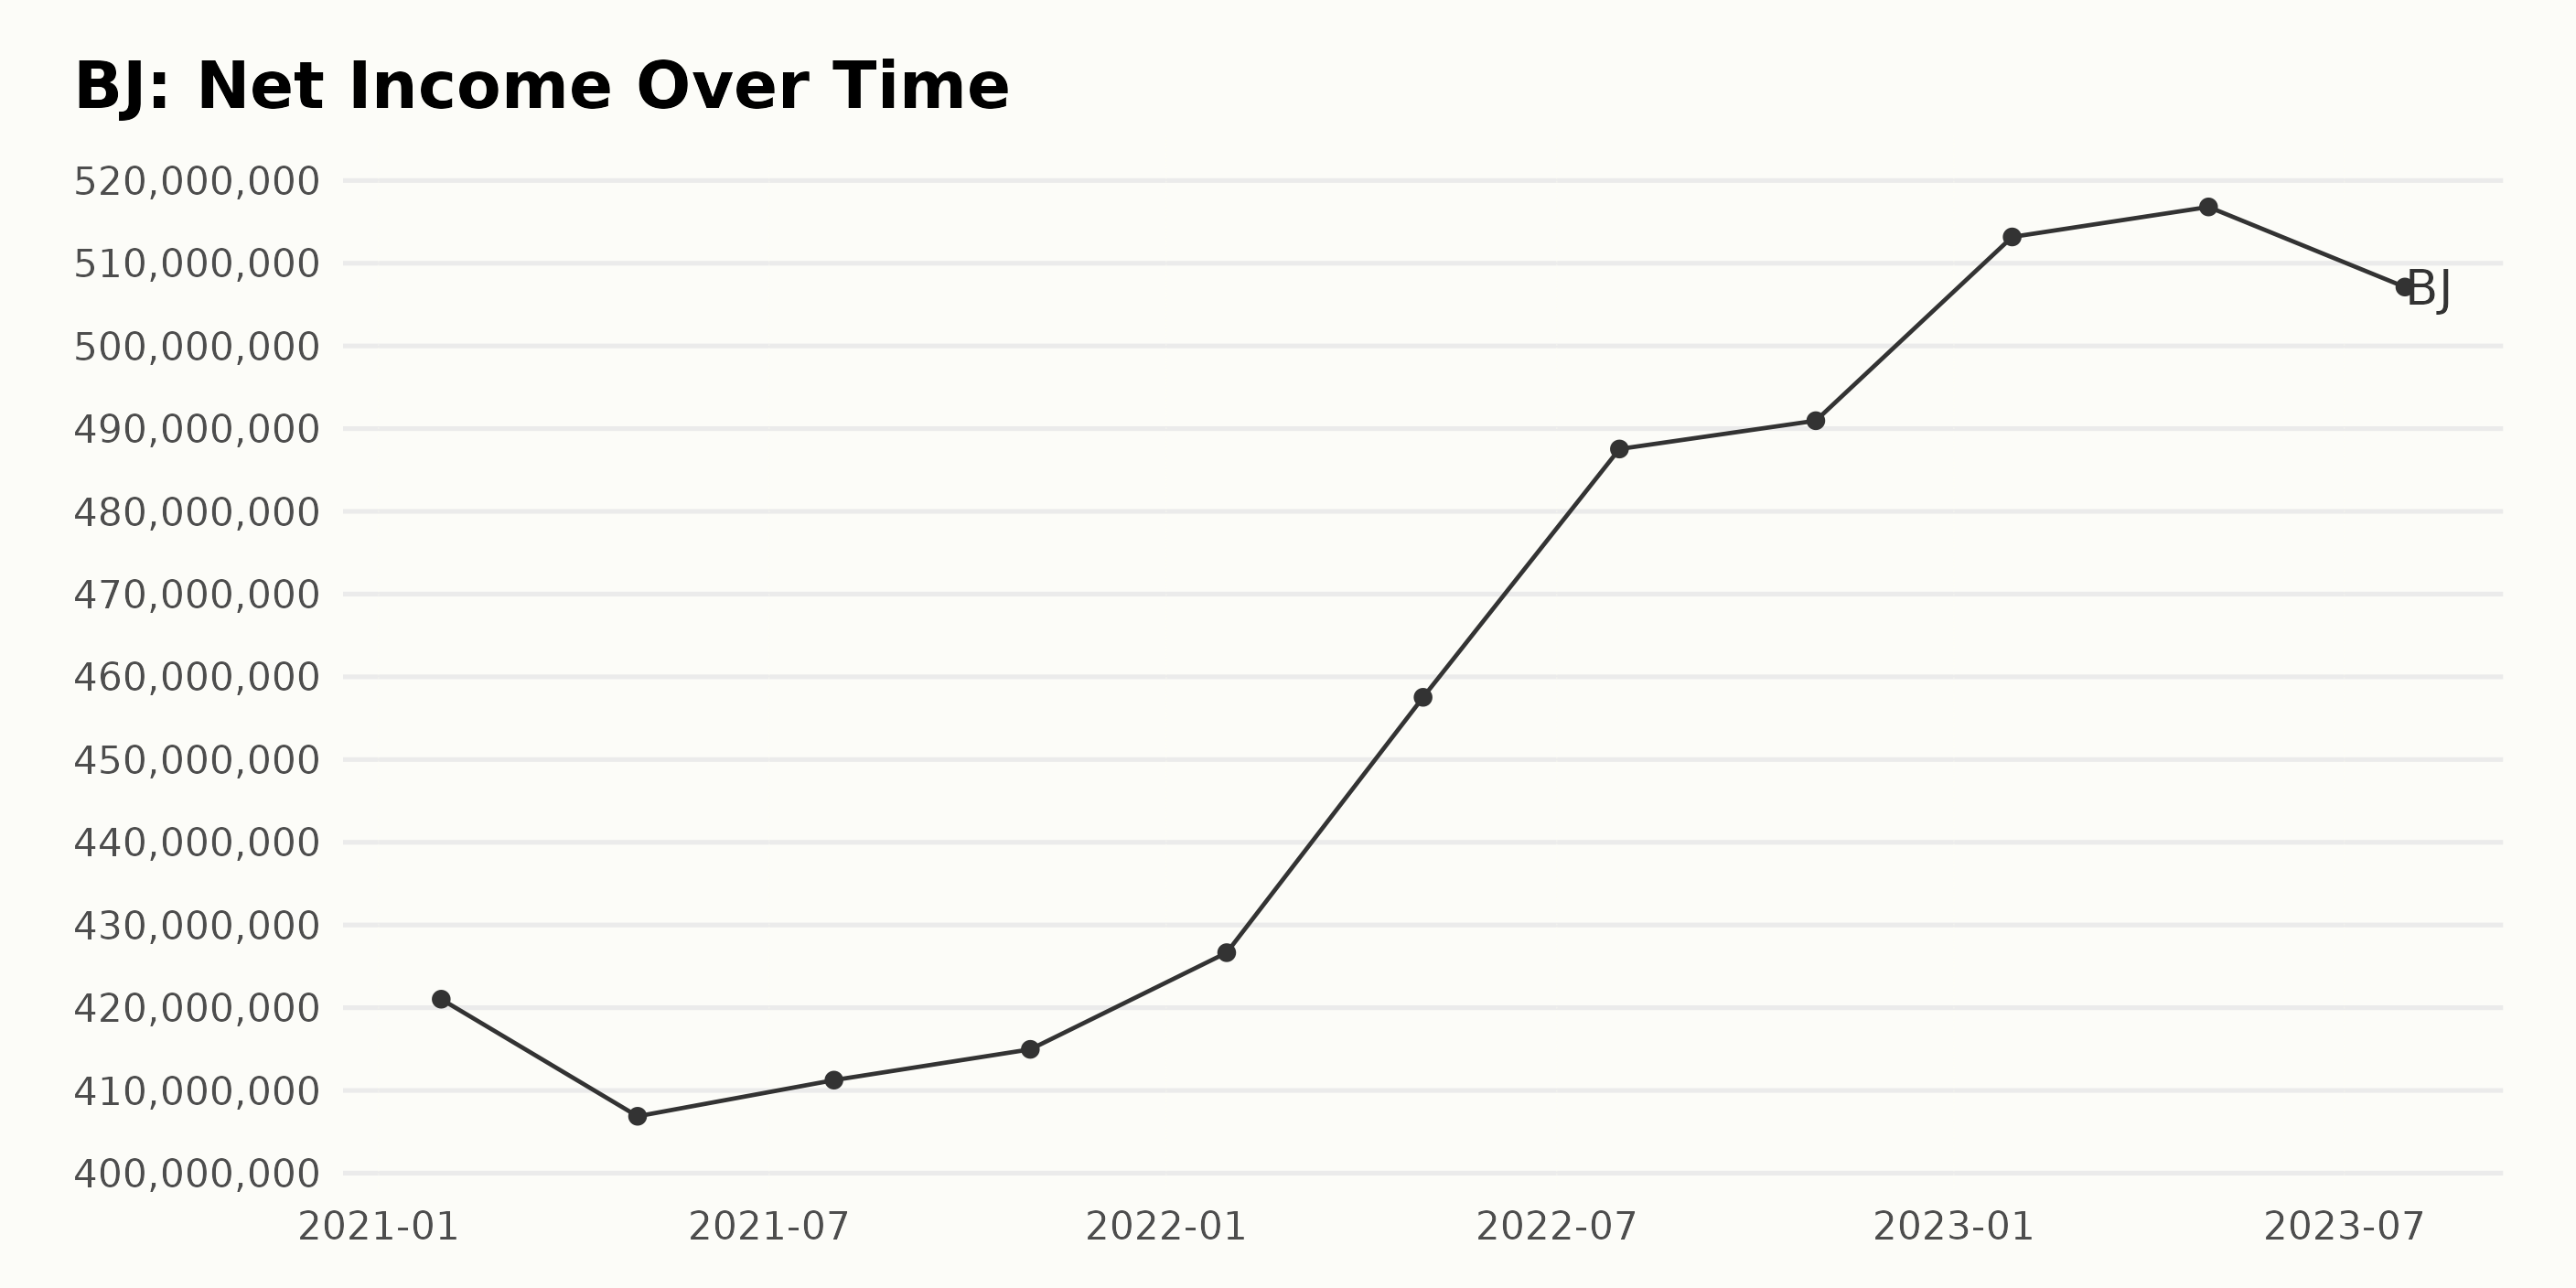
The data shows that BJ has seen a steady and considerable increase in its trailing-12-month Net Income over a period from January 2021 to July 2023.
- On January 30, 2021, the Net Income was $421.03 million.
- The Net Income displayed a slight decrease to $406.88 million by May 1, 2021, but then started a steady upward climb.
- By October 30, 2021, the reported Net Income was $414.96 million.
- A peak at the beginning of 2022 is noticed when Net Income hits $426.65 million in January, and it continues to rise to $457.52 million by April.
- There's a significant jump during the mid of 2022 with July's Net Income reaching $487.54 million.
- However, by October 2022, the growth rate slows down a bit with the Net Income only slightly increasing to $490.96 million.
- In 2023, despite some fluctuations, the overall trend continued to be positive with January reporting a Net Income of $513.17 million followed by a minor increase to $516.80 million by end of April.
- The series ends with July 2023 reporting a slight dip in Net Income to $507.12 million.
Overall, there's a gradual rise in Net Income of BJ across the timeline. There are minor fluctuations, but the general trajectory is upward. From the first value in January 2021 ($421.03 million) to the last value in July 2023 ($507.12 million), BJ’s income has grown by approximately 20.4%.
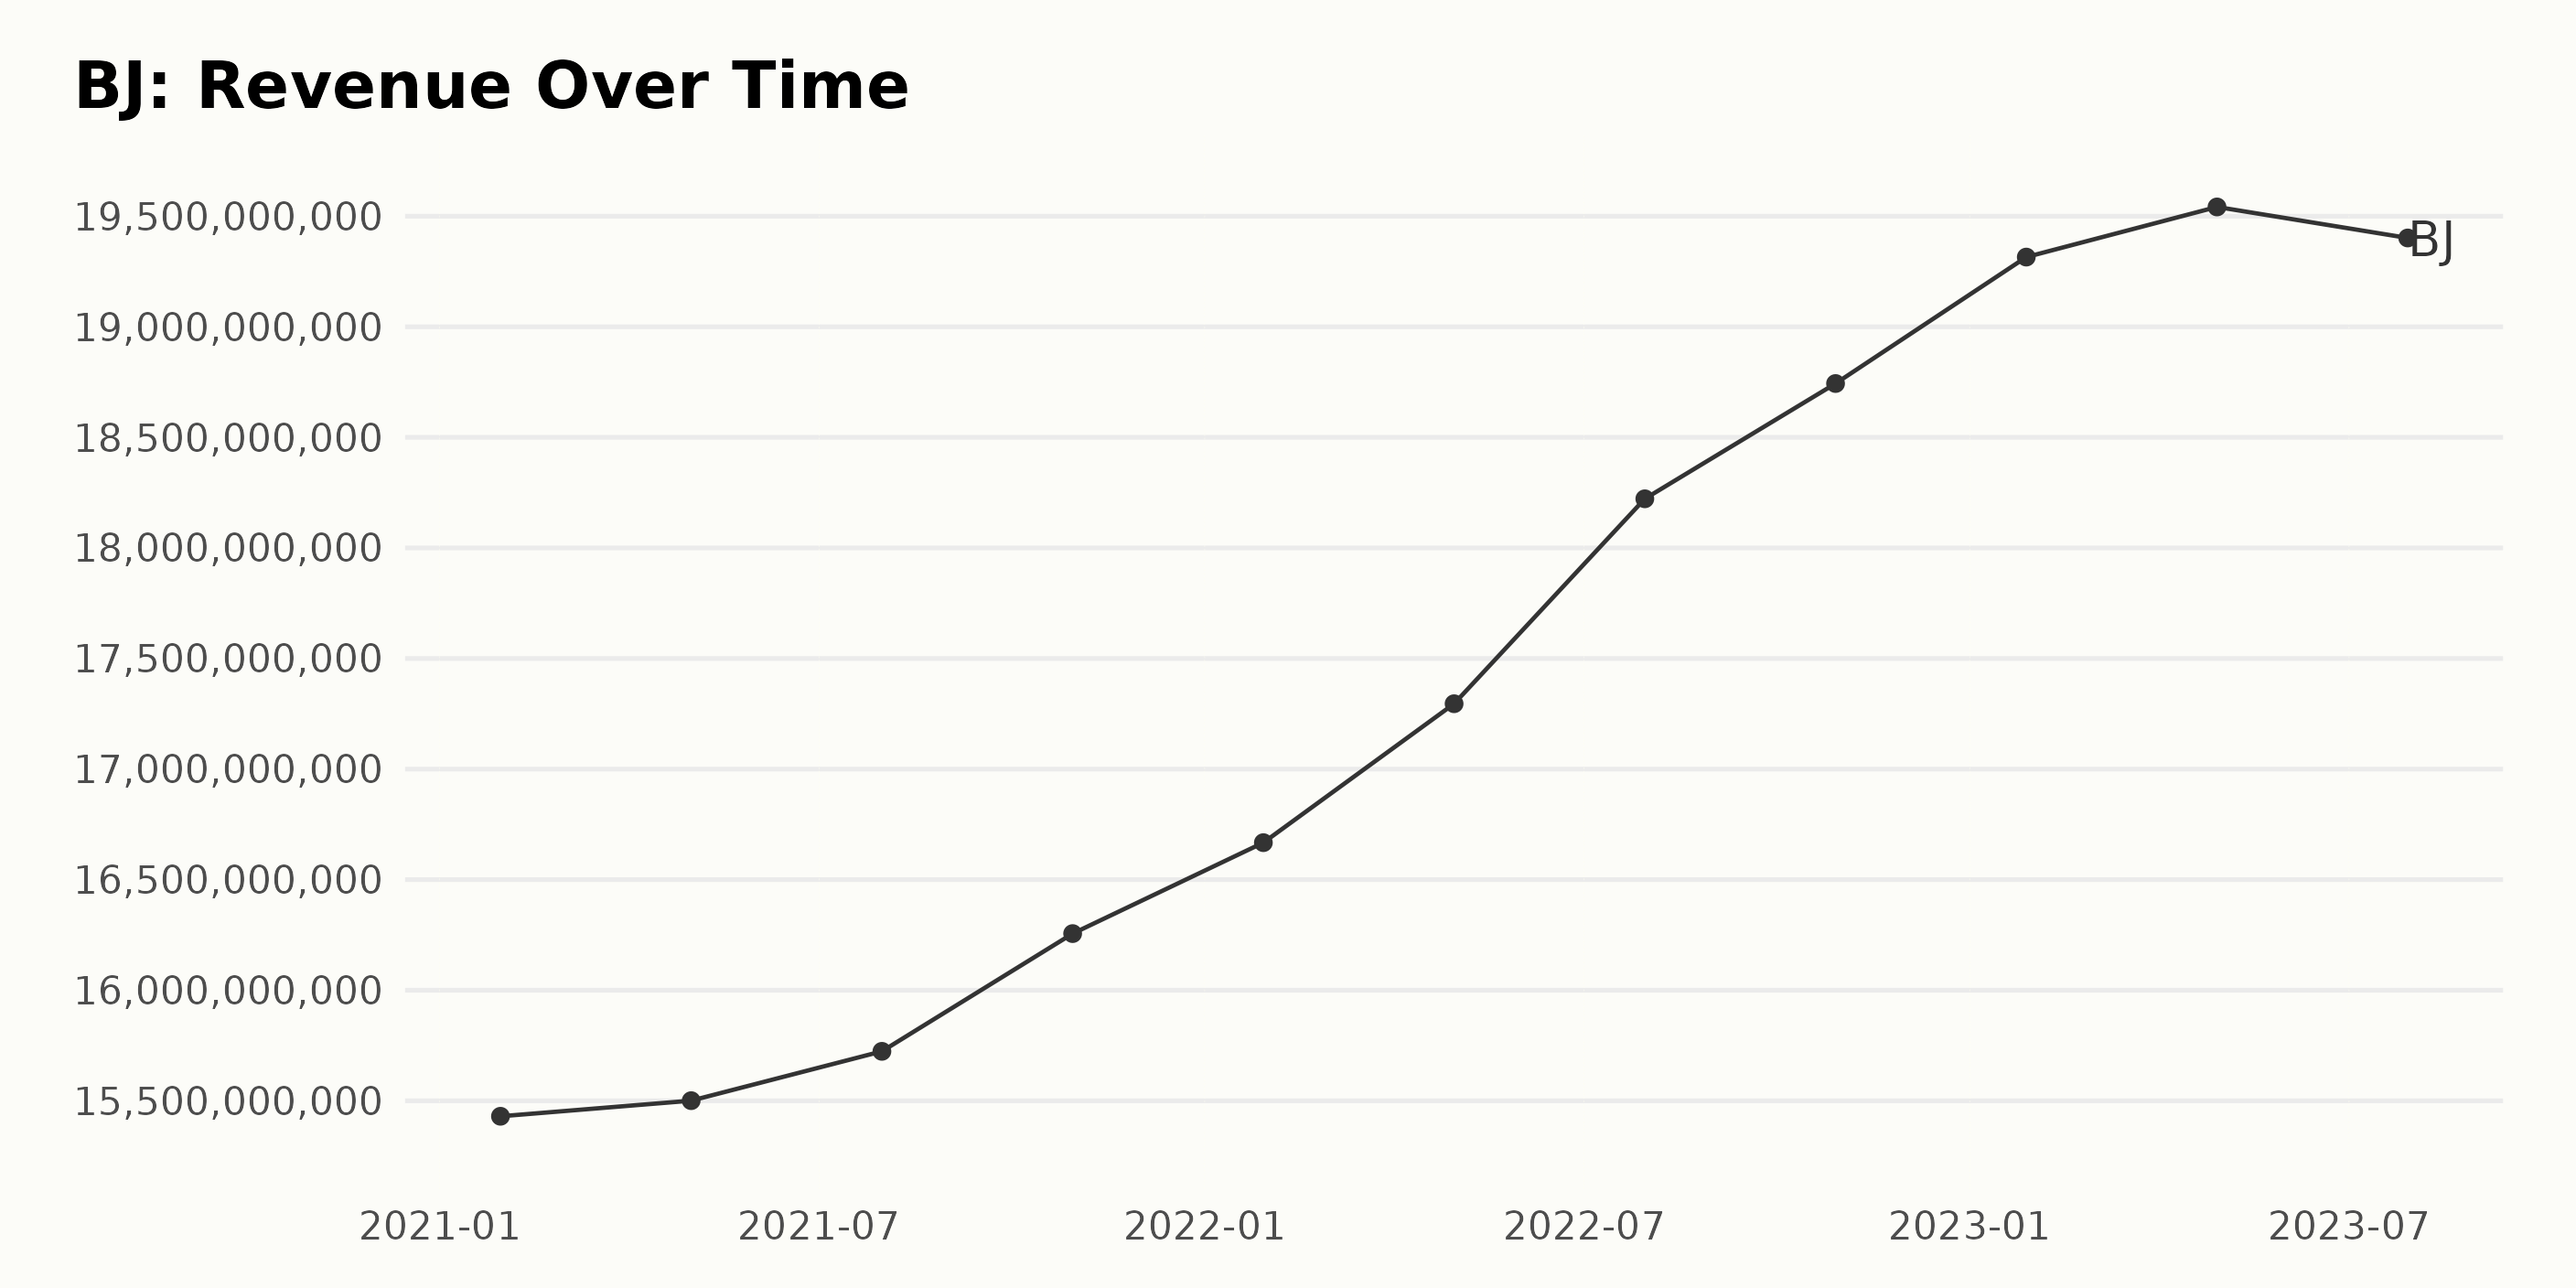
The trend of BJ's reported trailing-12-month revenue shows consistent growth over the date range from January 2021 through July 2023.
- Starting at a value of $15.43 billion in January 2021, the revenue continued to experience modest increases throughout the year, reaching $16.25 billion in October.
- The subsequent year, 2022, brought remarkable growth, with revenue levels soaring to $18.22 billion by July and $18.74 billion by the end of October.
- In 2023, BJ's recorded revenue reached new heights, with the values reported in January and April being $19.31 billion and $19.54 billion, respectively. A minor fluctuation was observed in July with a slight decrement to $19.40 billion, which deviates from the general trend.
From January 2021 to July 2023, BJ's revenue has grown significantly, implying an overall positive growth rate. It's also important to note the fluctuations present in this data. BJ's revenue frequently sees minor fluctuations throughout the years, with the most significant decline observed between April and July of 2023, where revenue dropped from $19.54 billion to $19.40 billion despite the consistent prior growth trend.
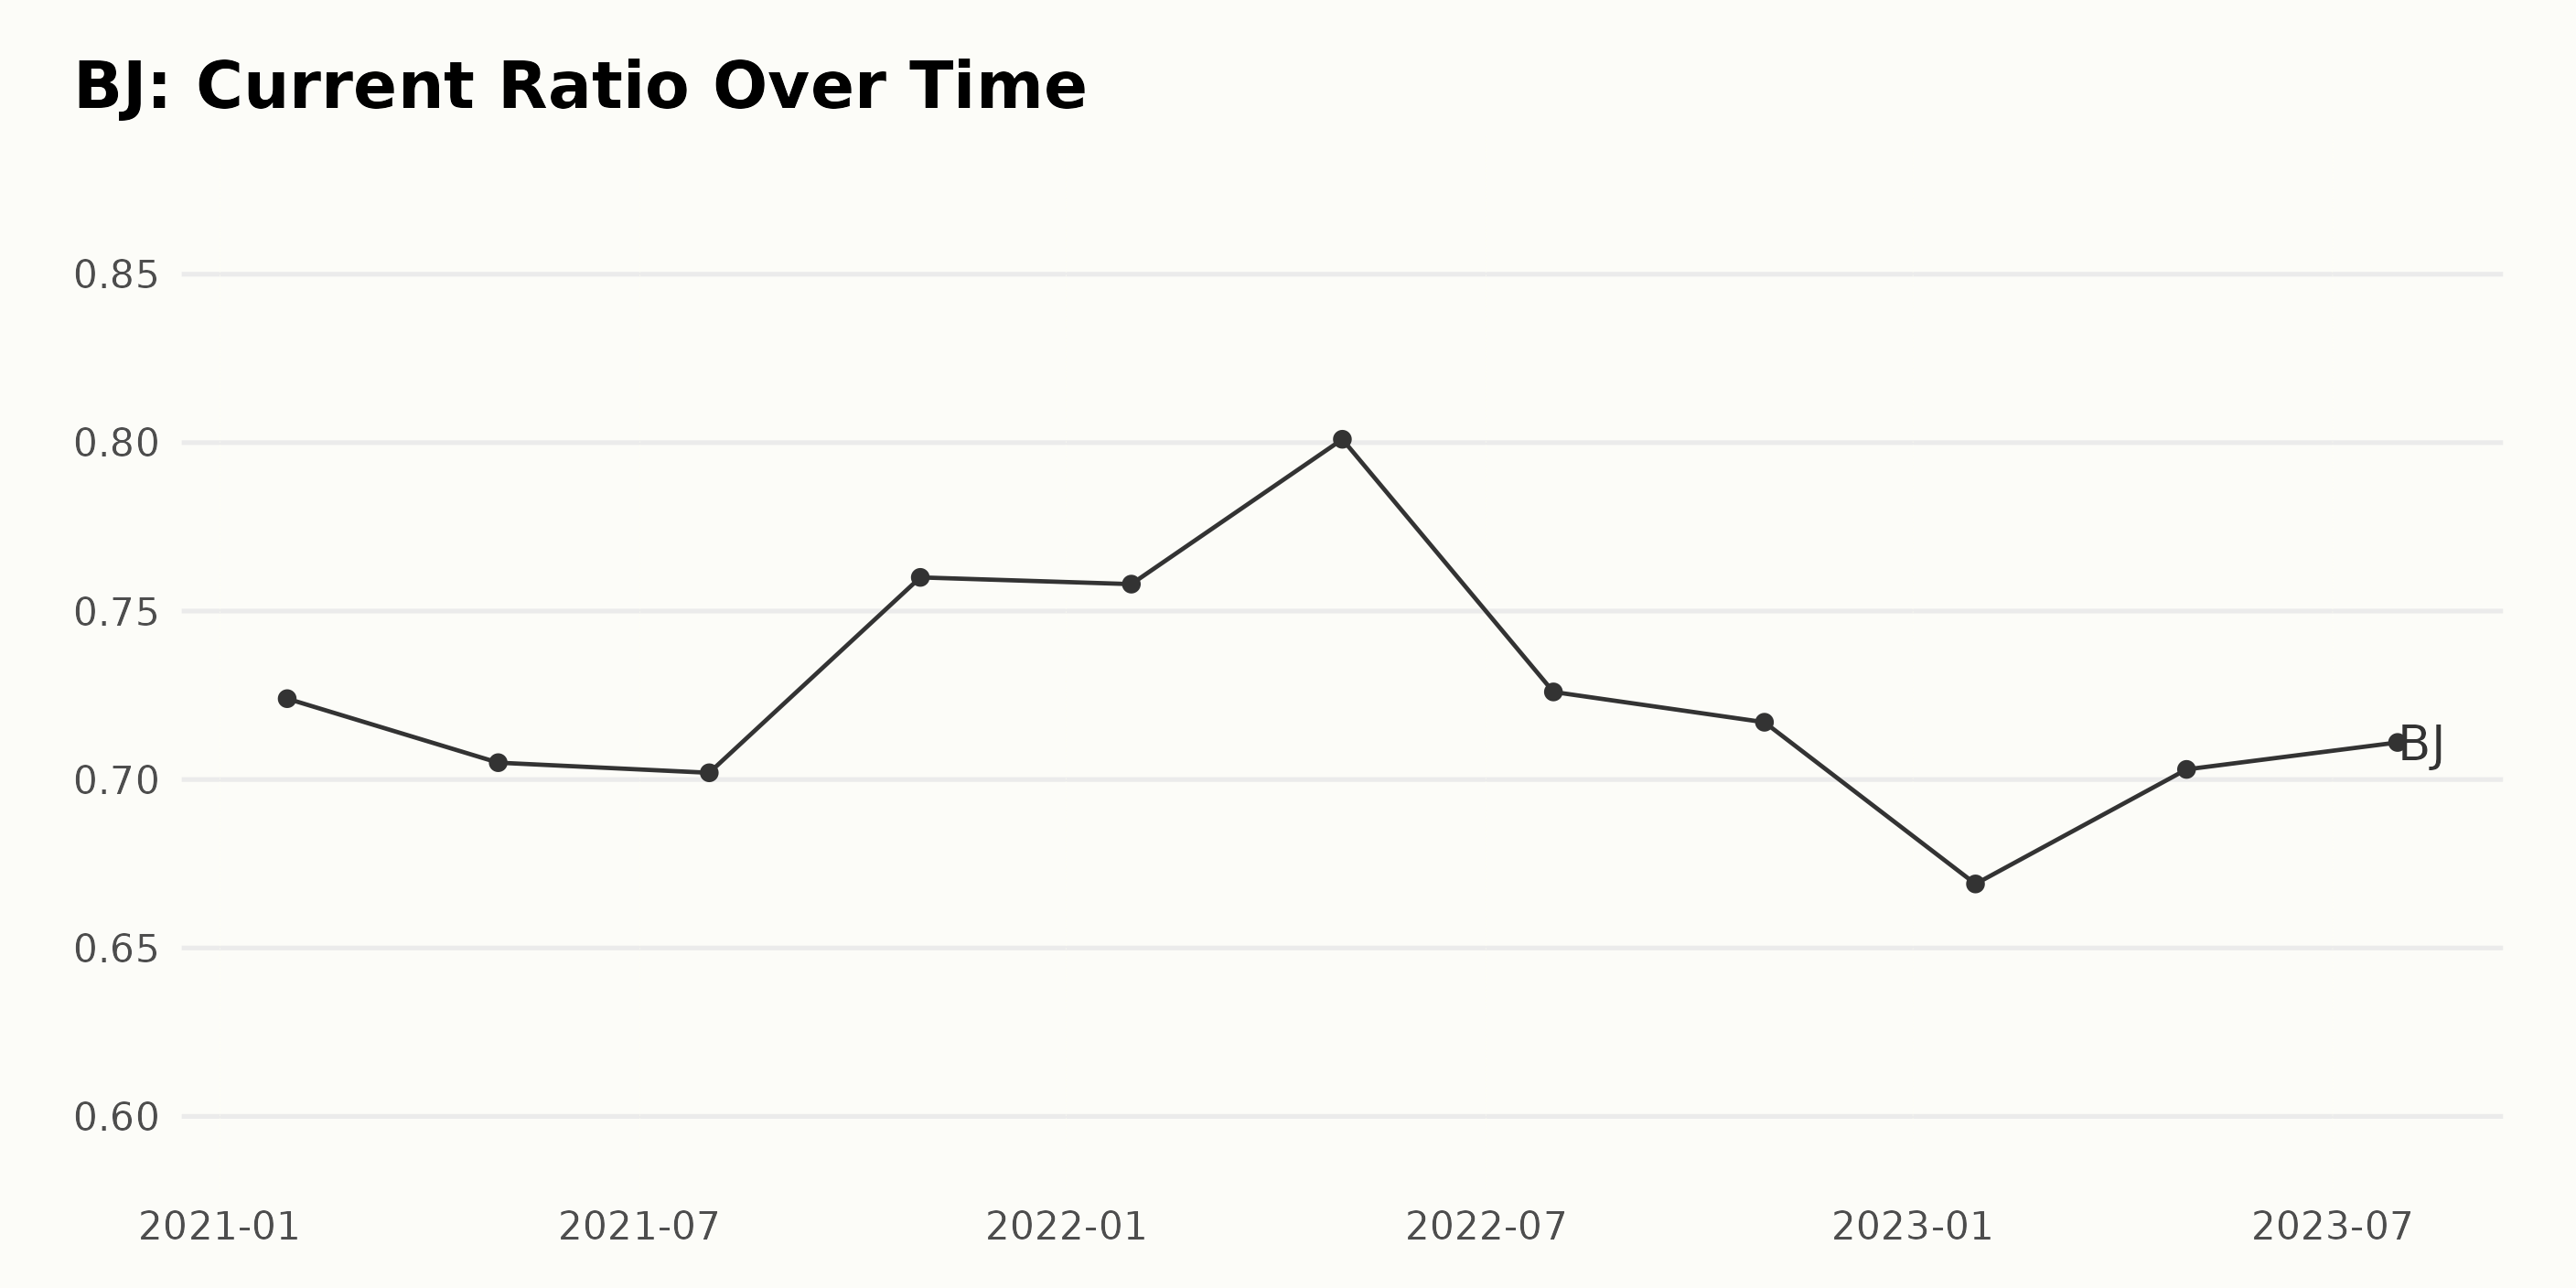
The trend and fluctuations of BJ's Current Ratio from January 2021 to July 2023 can be summarized as follows: - The Current Ratio for BJ started at 0.72 on January 30, 2021, with a slight decrease to 0.70 in May 2021, and saw a further marginal drop to 0.70 by the end of July 2021.
- In the last quarter of 2021 (October 30), there was a noticeable increase in Current Ratio to 0.76.
- The value remained almost steady at 0.76 in January 2022, followed by an increase to 0.80 by April 2022.
- However, a significant downfall in the Current Ratio was observed in the next few months, reaching 0.73 in July 2022 and then 0.72 in October 2022.
- In early 2023, the Current Ratio saw another dip to 0.67 by the end of January.
- From this point, it then began to slowly rebound, reaching 0.70 in April 2023, and further rose to 0.71 by July 2023.
Calculating change by measuring the last value from the first value, the Current Ratio of BJ has decreased by approximately -0.01 or -1% over this analyzed period. Greater emphasis on the most recent data shows relative stability in the Current Ratio for BJ, albeit with some fluctuation, in the later part of the series from 2022 onwards.
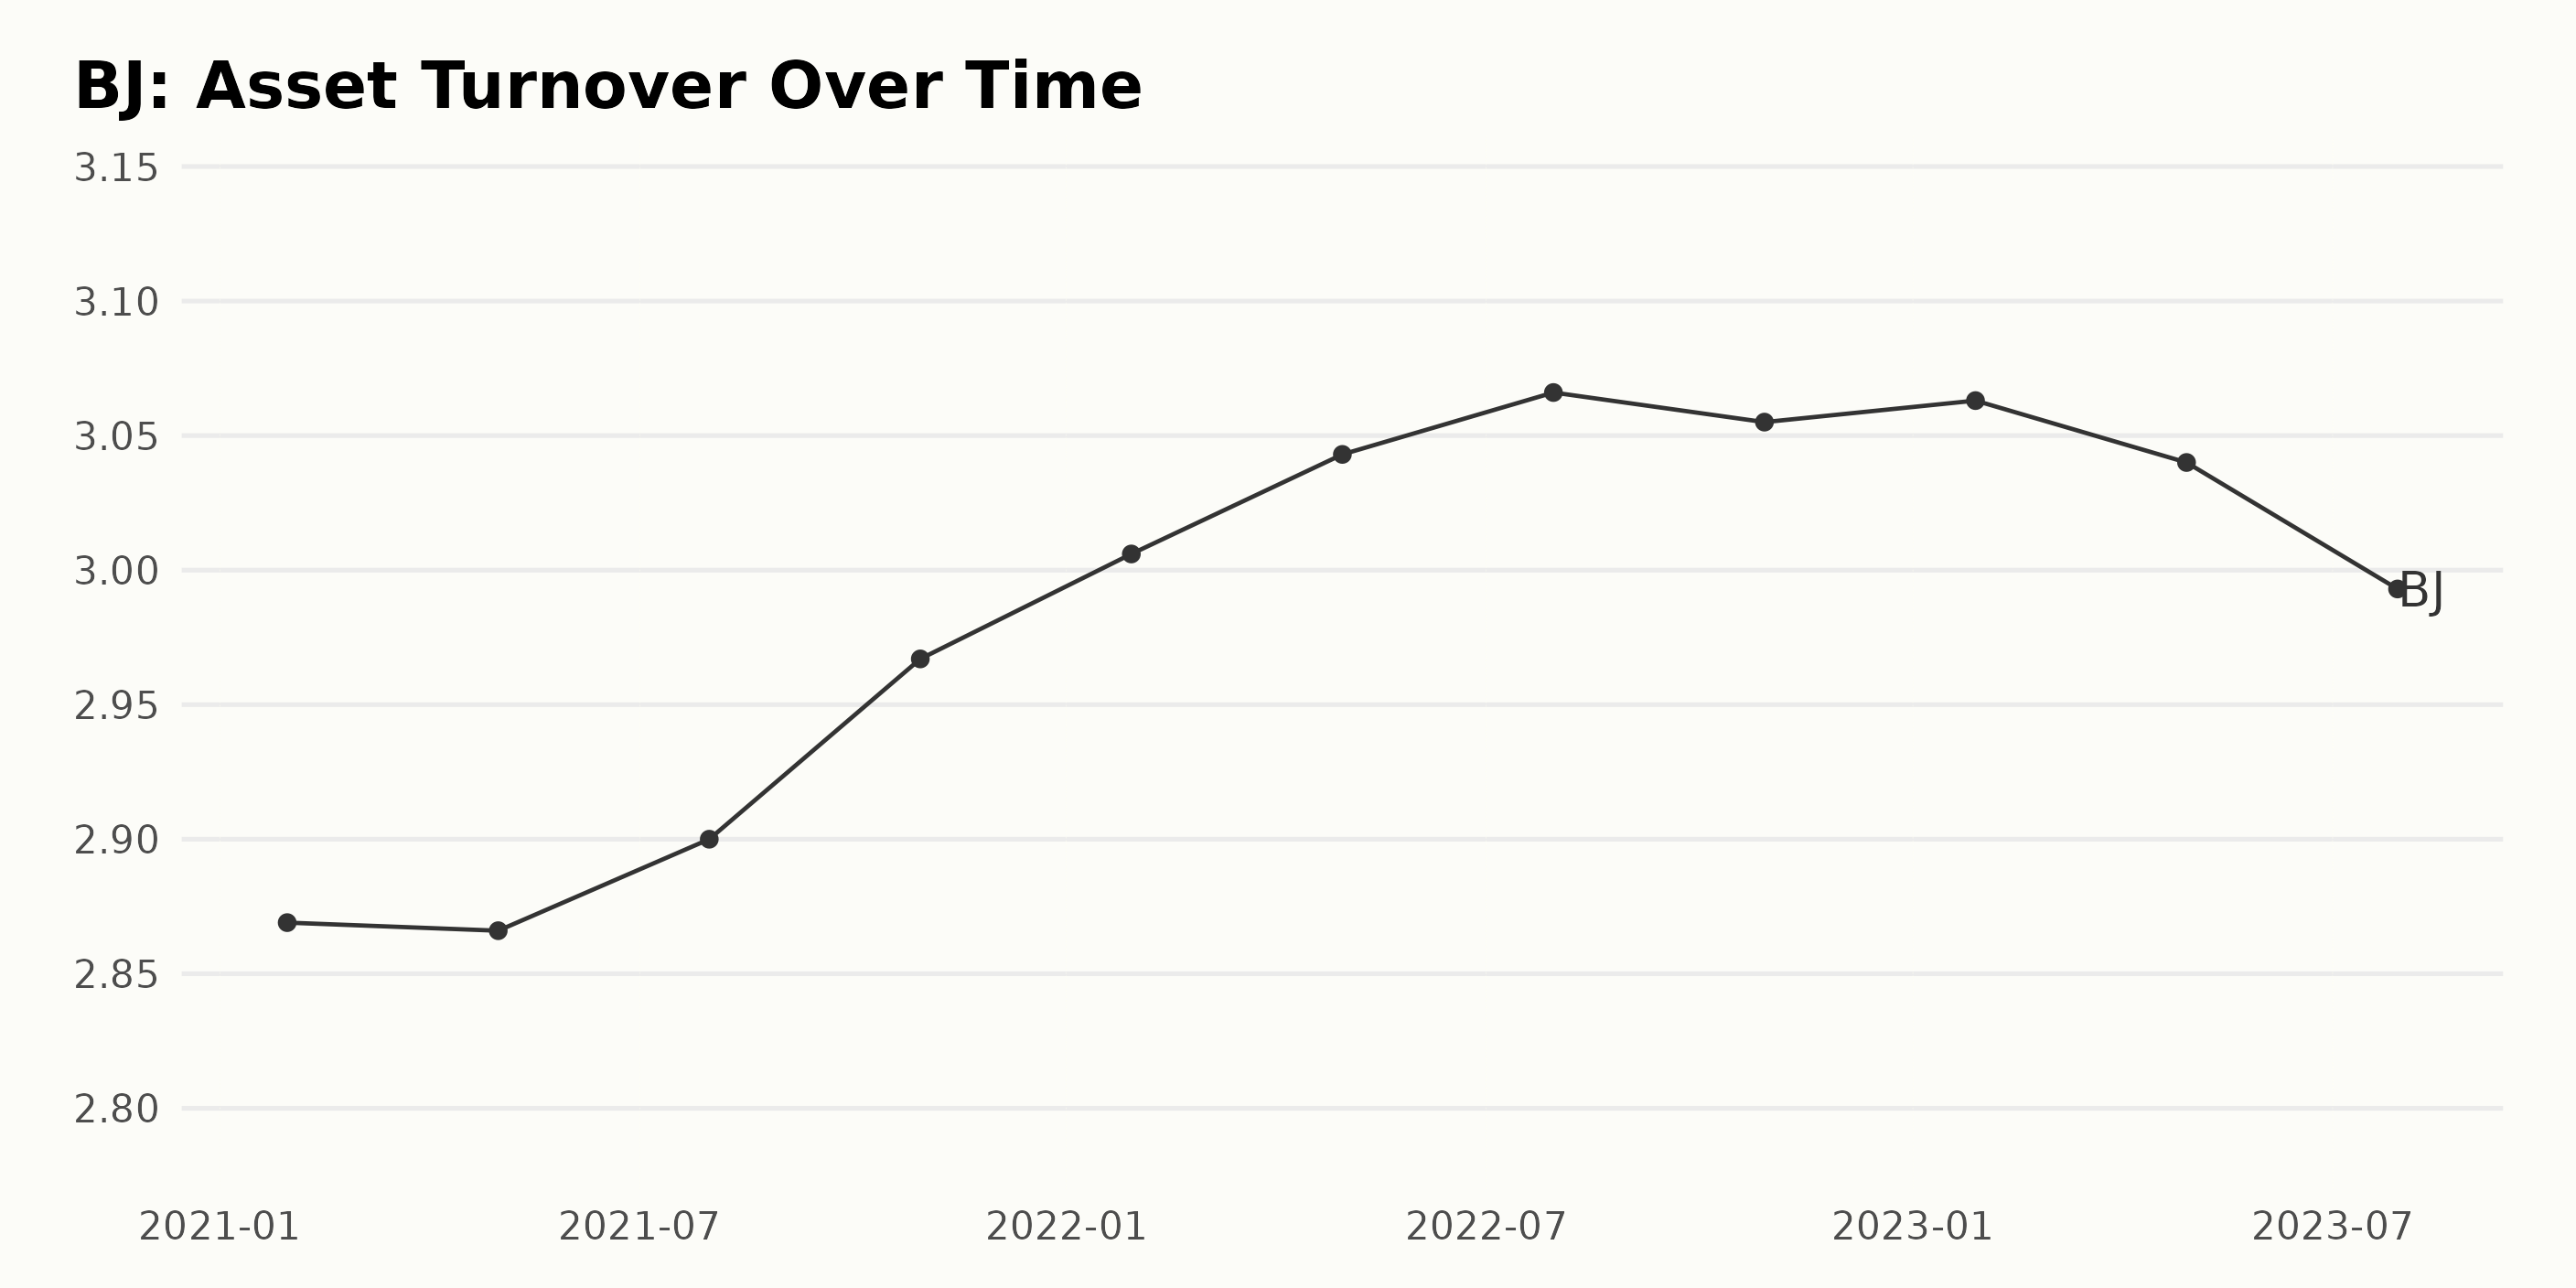
The following shows the trend and fluctuations in the Asset Turnover of BJ based on the data: -
- In January 2021, BJ's Asset Turnover was at 2.87.
- Within the year, there were slight peaks and drops observed. The Asset Turnover decreased slightly to 2.87 in May 2021 but then increased to 2.9 in July 2021.
- By October 2021, the Asset Turnover took a significant uptick to 2.97.
- In the following year, 2022, the value increased consecutively in the first three quarters, reaching 3.07 by July but slightly dipped to 3.06 in October.
- In 2023, a decline set in, starting at 3.06 in January, dropping to 3.04 in April and further down to 2.99 in July.
To summarize, the Asset Turnover of BJ witnessed an overall upward trend from January 2021 (2.87) through July 2022 (3.07). This represents a growth rate of approximately 6.95% over a one-year span. However, a falling trend ensued from January 2023 (3.06) to July 2023 (2.99).
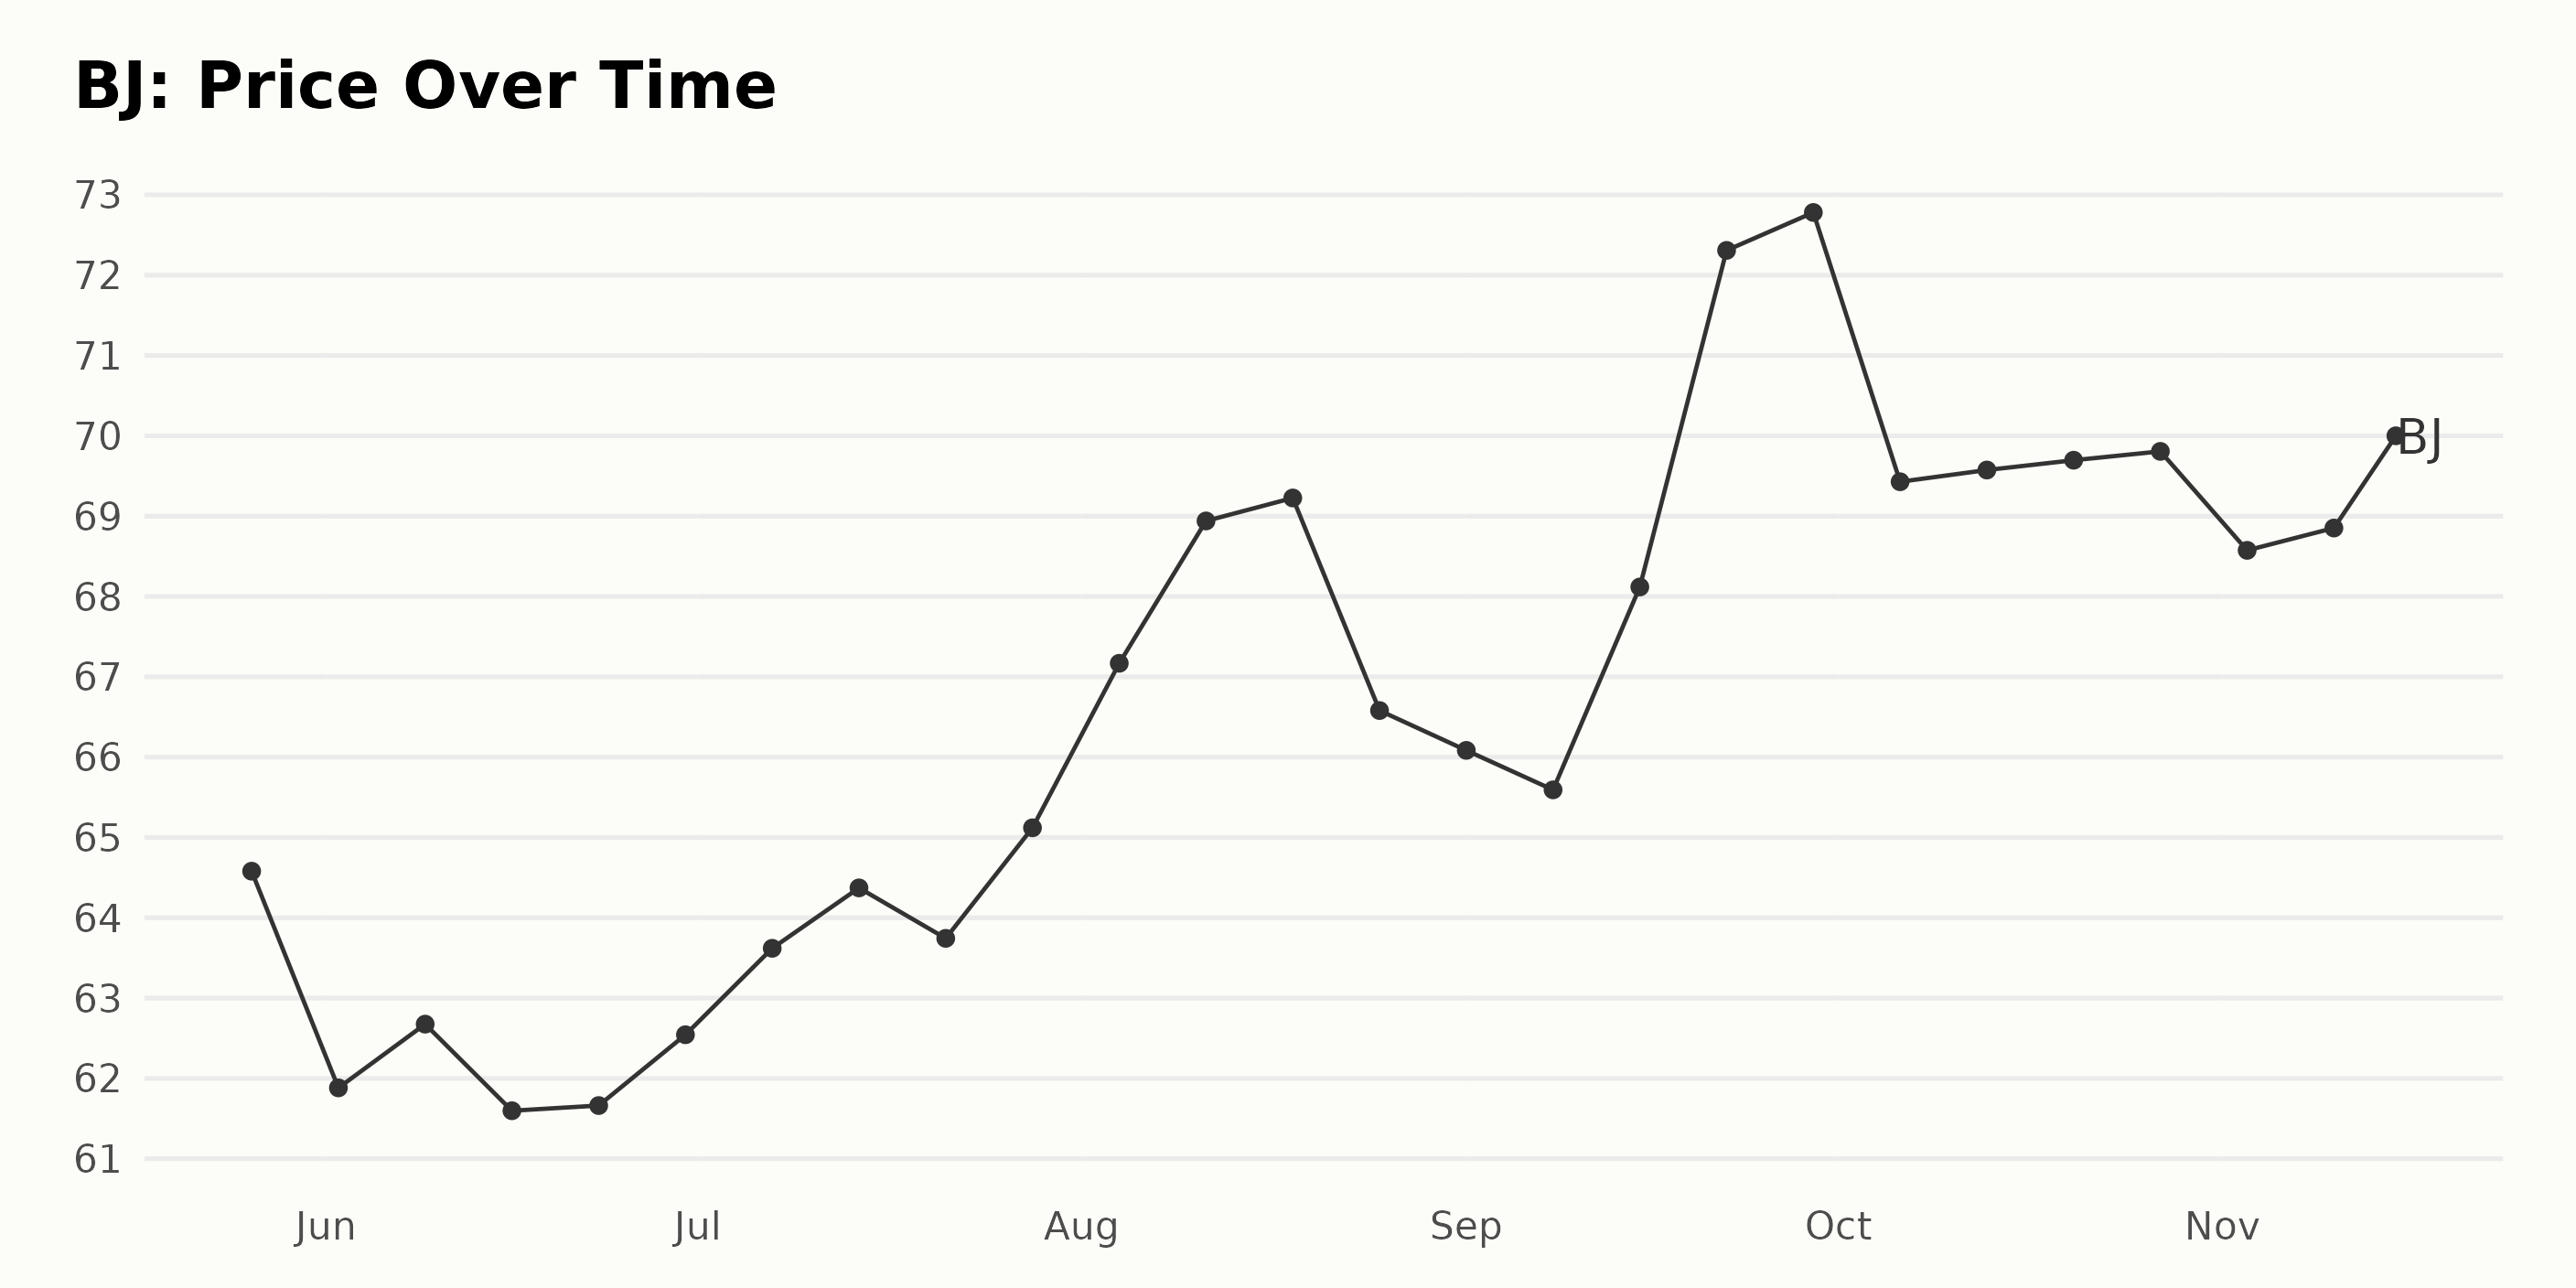
Analyzing the Dynamics of BJ's Share Price Trends from May to November 2023
Looking at the data on the share price of BJ, there seem to be some clear trends and fluctuations during the period from May to November 2023.
- On May 26, 2023, the price was at $64.58.
- In June 2023, it dropped slightly and fluctuated around the $61-$63 mark.
- Starting in July, there was noticeable growth with the price reaching from $62.54 to $65.12 by the end of that month.
- This upward trend continued in August, with the share price increasing from $67.17 to a peak of $69.23 towards mid-August before declining moderately to $66.58 at month's end.
- In September, there was an initial slight decrease but the growth resumed later in the month, peaking at $72.78 by the end of September. This indicates a significant growth rate from the beginning of the month.
- In October, the price moderately decreased and maintained at about $69.
- November saw a small upward trend in the share price, ending at $70 on November 15, 2023.
In general, the market exhibited a predominantly upward trend in the share price of BJ over this period. After an initial drop, the price grew significantly, aside from brief periods of moderate decline. The rate of growth accelerated noticeably particularly in the last week of September before settling into steadier levels for the remainder of the time period. Here is a chart of BJ's price over the past 180 days.
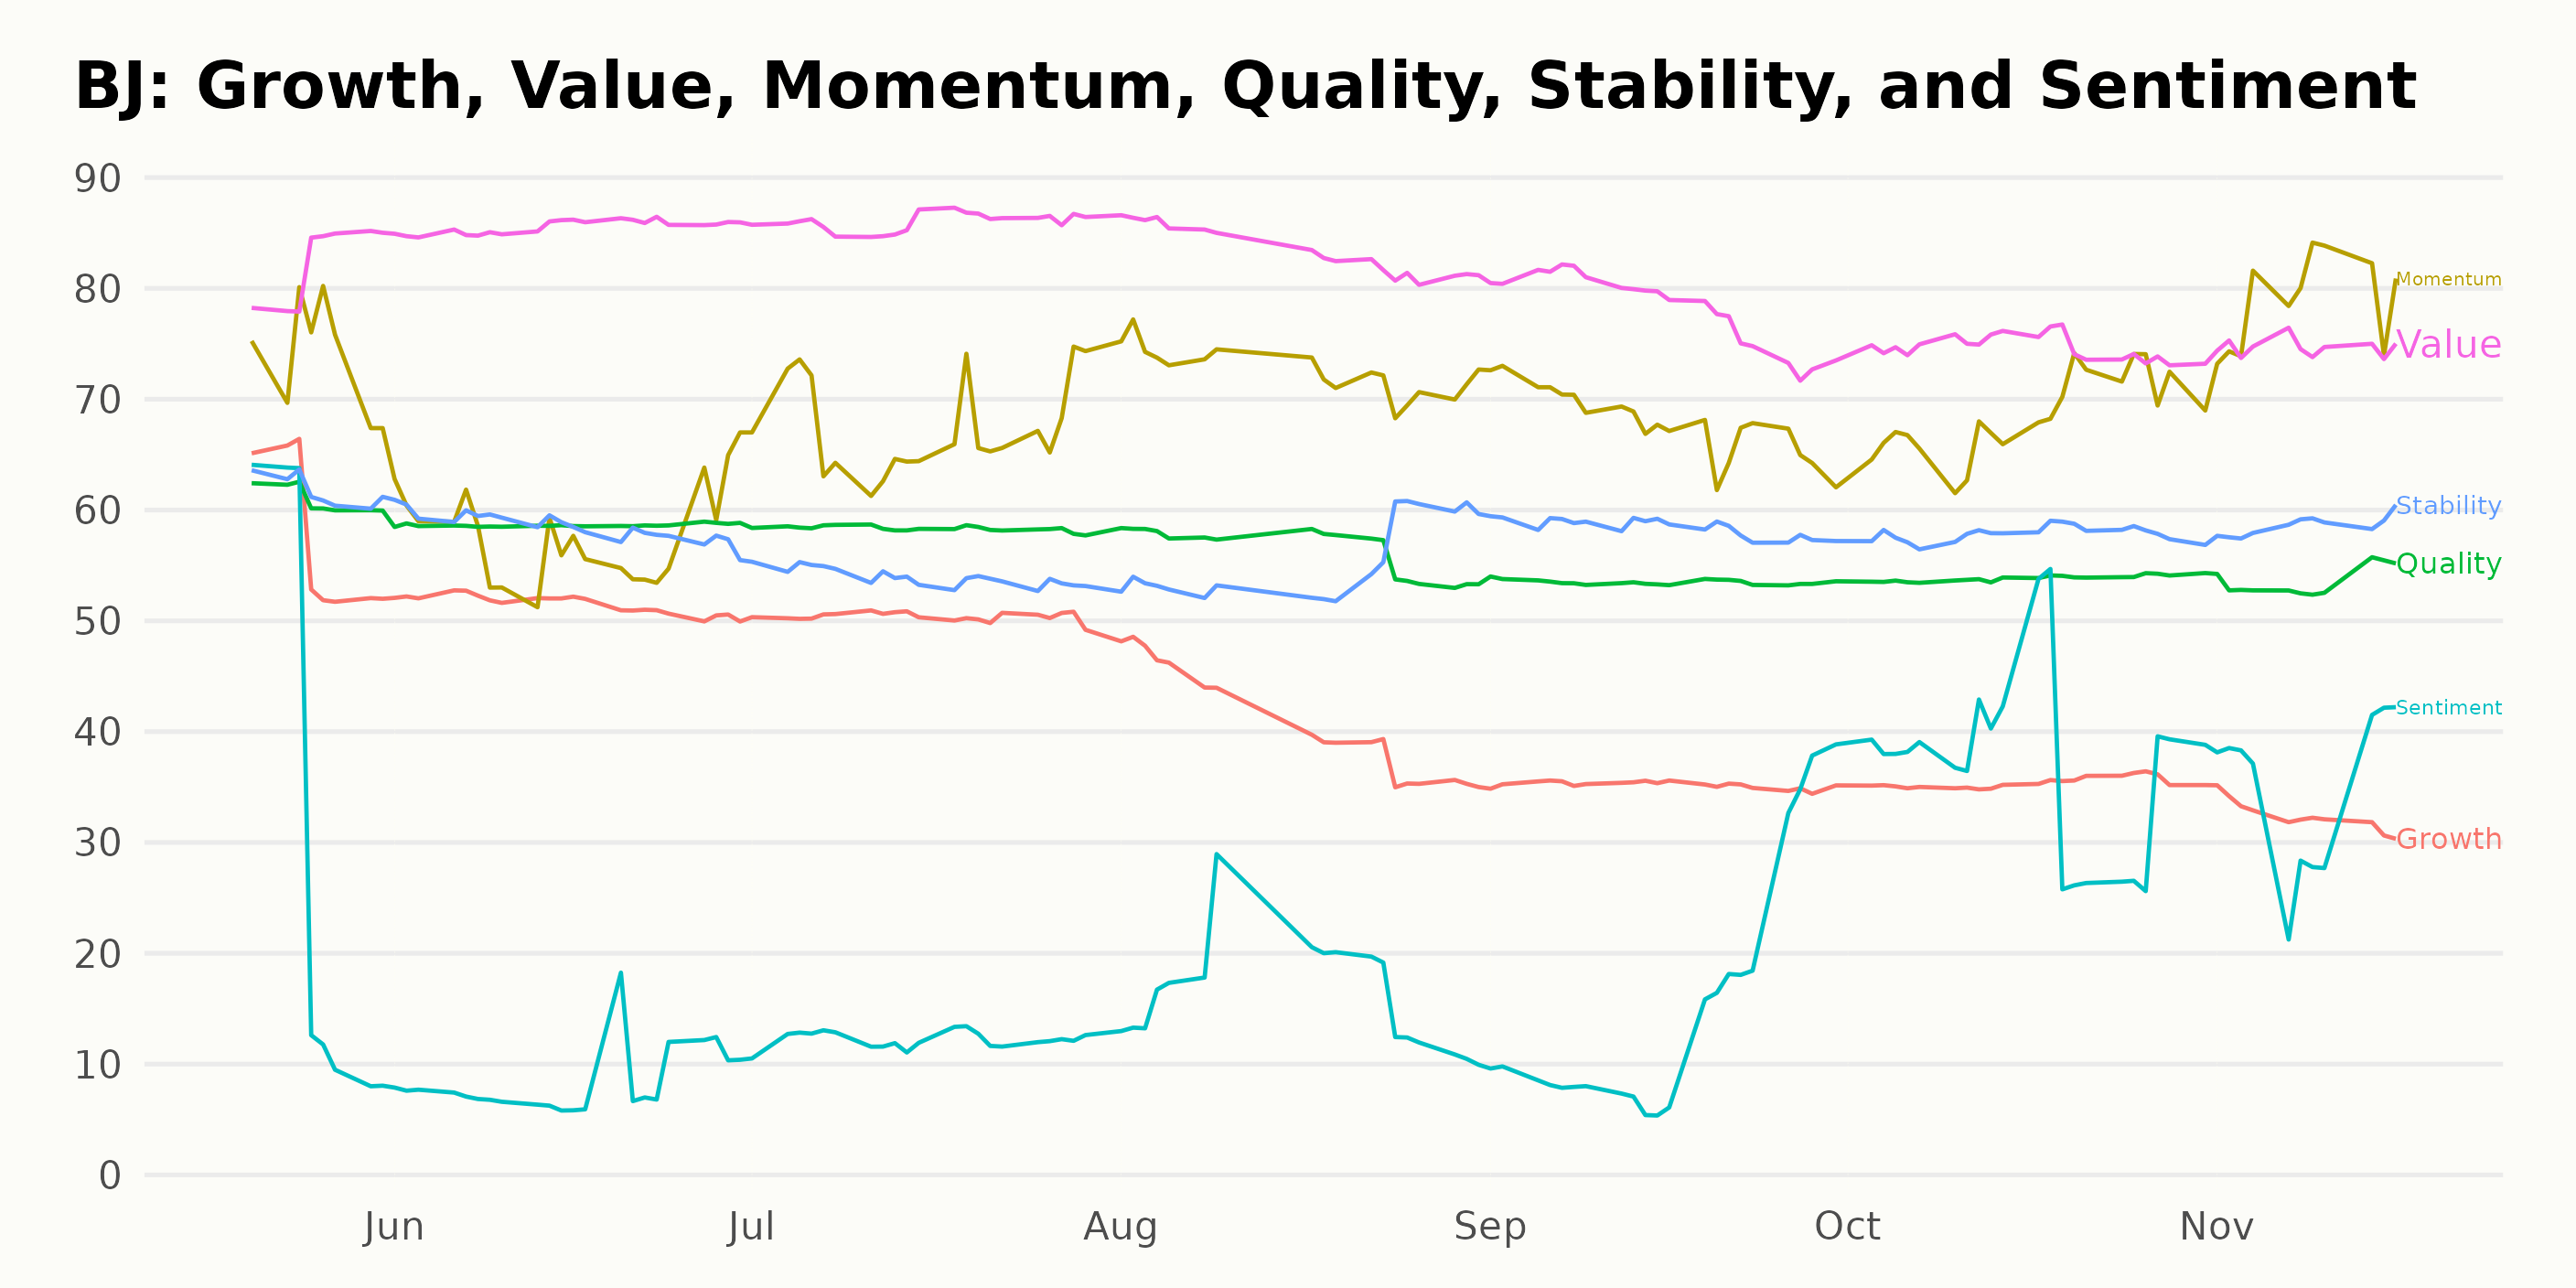
Analyzing BJ's Performance: A Deep Dive into Value, Momentum, and Stability Ratings
BJ has an overall C rating, translating to a Neutral in our POWR Ratings system. It is ranked #30 out of the 38 stocks in the Grocery/Big Box Retailers category.
As per the POWR ratings, the three most noteworthy dimensions for BJ's rating from May to November 2023 are: Value, Momentum, and Stability. Our discussion will focus on these dimensions, noting their highest ratings and clear trends.
Value:
- The Value dimension remains consistently high for BJ throughout this period. The highest rating was in June, July 2023 with a POWR Rating of 86.
- The overall trend observed within the given time frame shows a marginal decrease with a rating of 82 in August 2023, dropping slightly to 75 by October and November 2023.
Momentum:
- The Momentum dimension showcases an interesting trend. Starting from a high of 74 in May 2023, it declined to 58 in June 2023.
- Positive momentum took shape, however, as ratings increased again, reaching an unprecedented high of 79 in November 2023. This indicates a notable upswing in Momentum over time, suggesting growing investor interest and sentiment towards BJ.
Stability:
- BJ's Stability dimensions manifest slight fluctuations. The peak rating is at 62 in May 2023, then declining to 54 in July 2023, and rising marginally back to 59 by November 2023.
- The subtle increases and decreases suggest a moderate level of stability, with minimal drastic changes in this dimension over the given months.
In summary, the POWR Ratings indicate that BJ showed consistent strength in Value, experienced increasing Momentum, and maintained a stable performance during this period.
How does BJ's Wholesale Club Holdings, Inc. (BJ) Stack Up Against its Peers?
Other stocks in the Grocery/Big Box Retailers sector that may be worth considering are Village Super Market Inc. (VLGEA), RYOHIN KEIKAKU CO., LTD. (RYKKY), and Marks & Spencer Group Plc (MAKSY) -- they have better POWR Ratings.
What To Do Next?
Discover 10 widely held stocks that our proprietary model shows have tremendous downside potential. Please make sure none of these “death trap” stocks are lurking in your portfolio:
BJ shares were trading at $68.37 per share on Thursday afternoon, down $3.06 (-4.28%). Year-to-date, BJ has gained 3.34%, versus a 18.80% rise in the benchmark S&P 500 index during the same period.
About the Author: Subhasree Kar

Subhasree’s keen interest in financial instruments led her to pursue a career as an investment analyst. After earning a Master’s degree in Economics, she gained knowledge of equity research and portfolio management at Finlatics.
The post BJ's Wholesale Club (BJ) Earnings Watch: Is it a Buy Opportunity? appeared first on StockNews.com