


Becton, Dickinson and Company (BDX), a leading global med-tech organization, has made significant strides in cultivating ground-breaking technology, services, and solutions.
Owing to a robust portfolio and superior market positioning, the company looks positioned for stable growth in the about-to-be-reported quarter. However, declining COVID-related revenues will likely have impacted BDX’s Life Sciences segment’s revenues in the fiscal fourth quarter of 2023.
Market analysts forecast BDX's revenue and EPS for the quarter to reach $5.02 billion and $3.43, respectively, representing a significant rise from the same period last year.
However, looking at the stock's weakened performance over the last month, a cautious approach could be prudent. It might be beneficial to closely monitor the trend after the earnings release on November 9 as it can provide further insights for tactical investment in the stock. Let’s take a look at its key financial metrices for a better understanding.
Unpacking the Financials of Becton Dickinson and Company: An Analysis of Key Metrics from 2020 to 2023
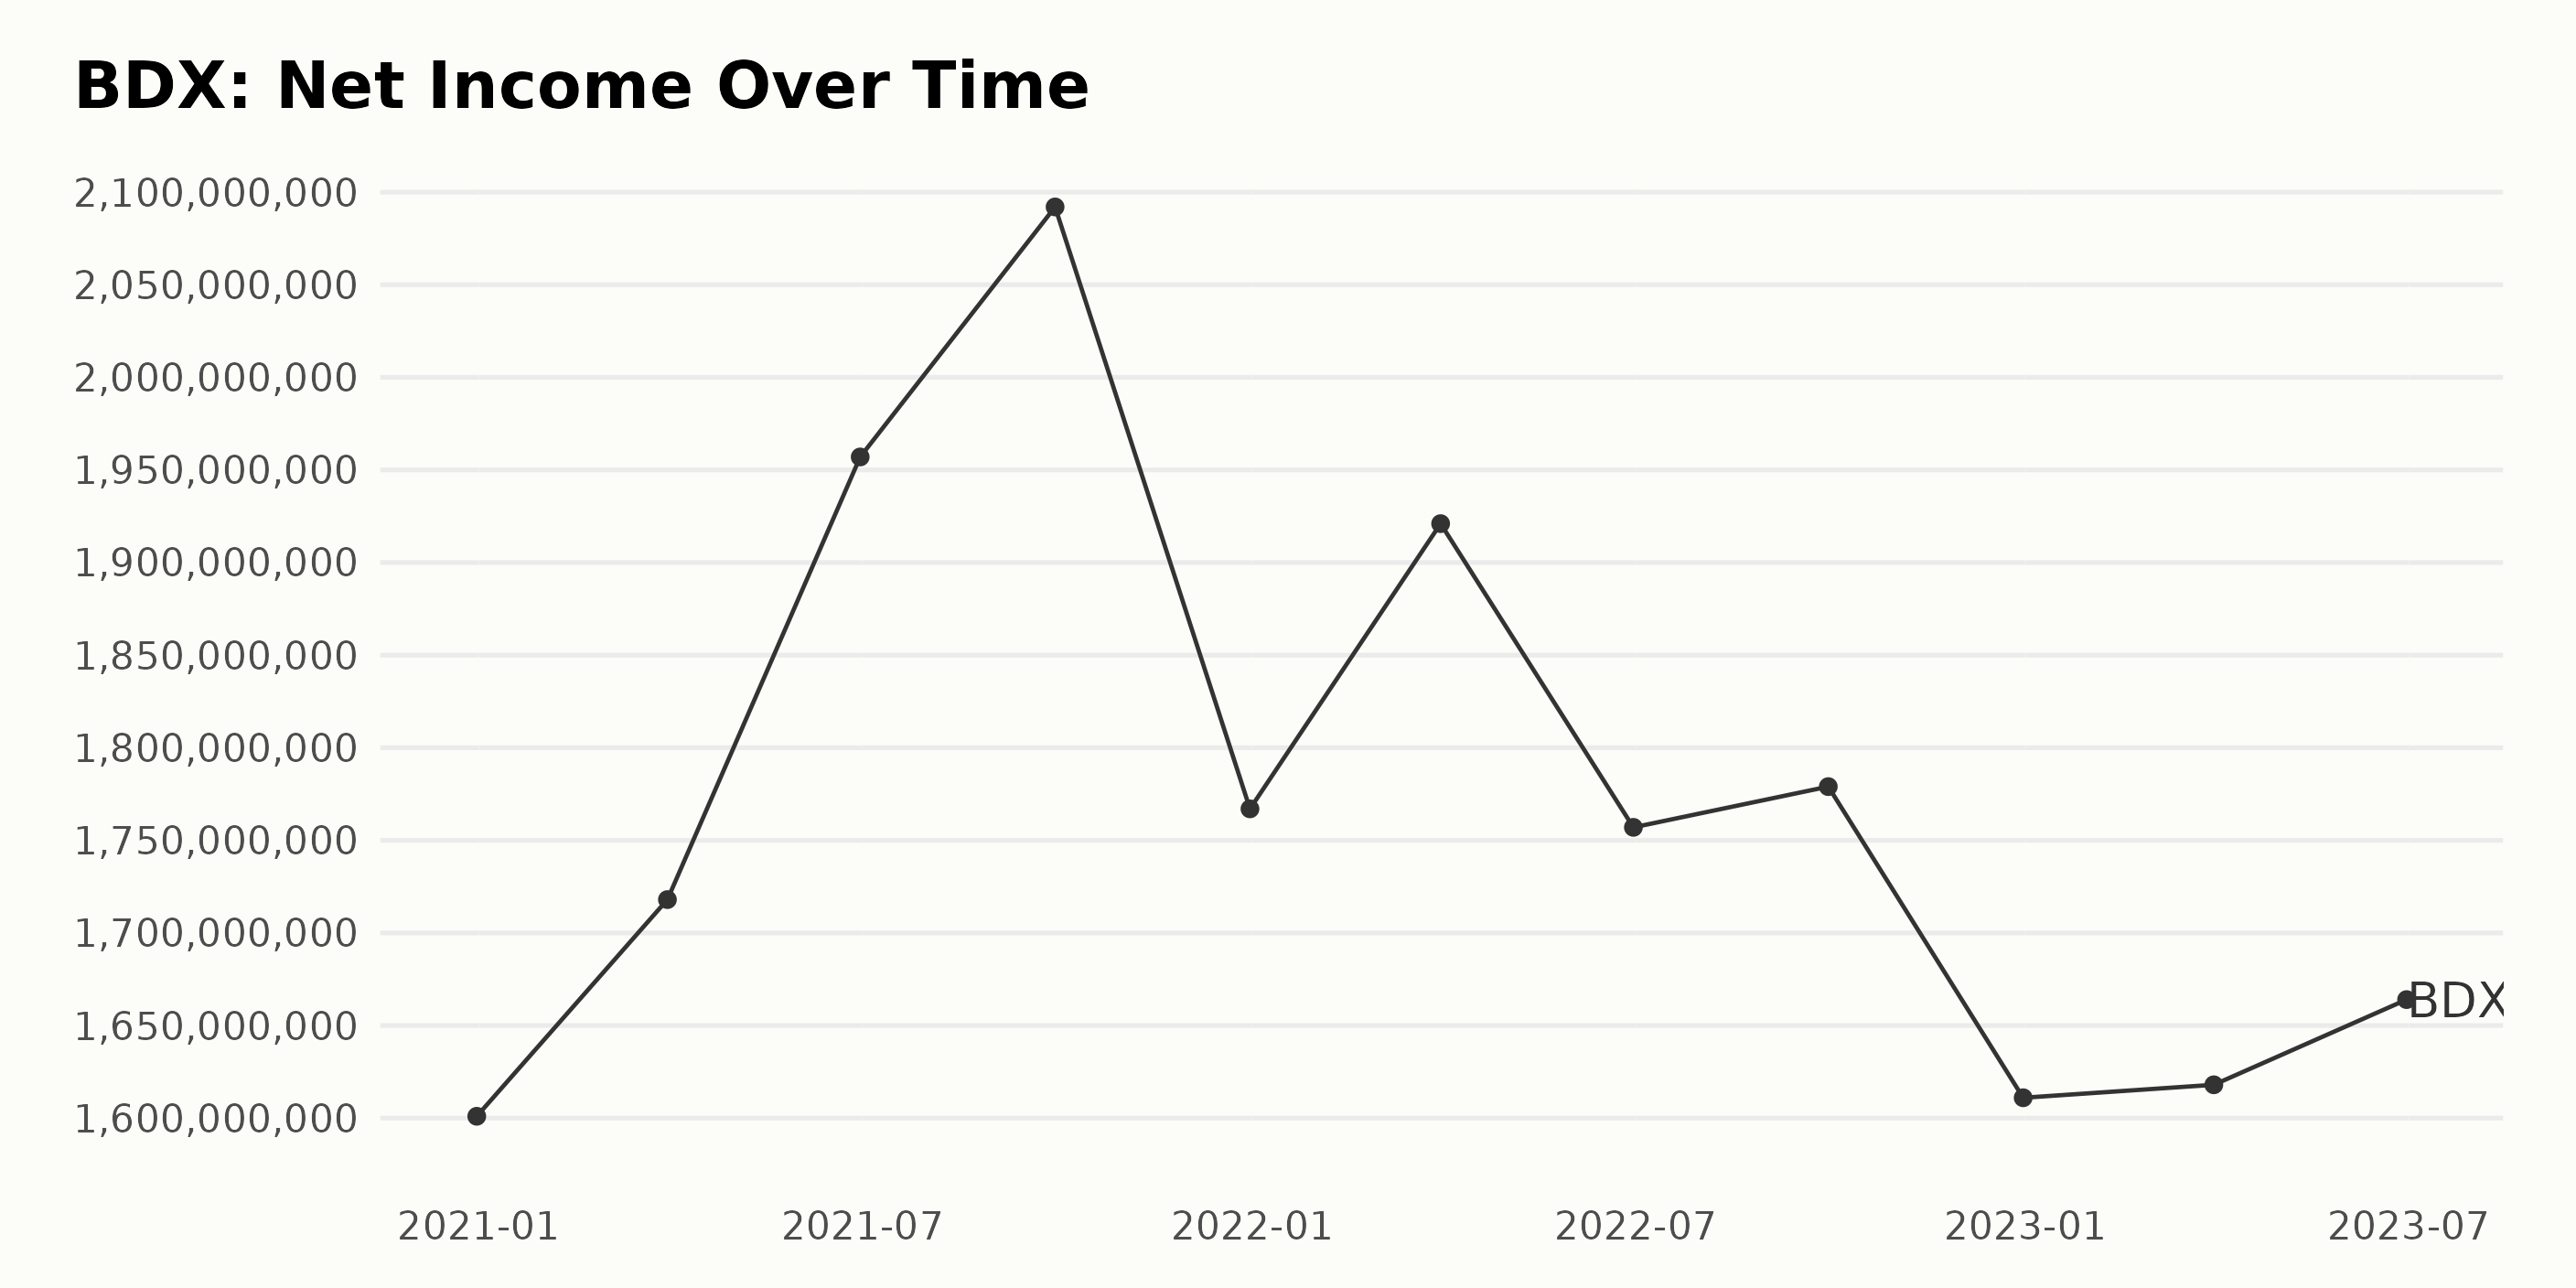
The trailing-12-month Net Income of Becton Dickinson and Company (BDX) has seen fluctuations over the recent periods. The data series indicates:
- As of December 31, 2020, Becton Dickinson reported a net income of $1.60 billion.
- This witnessed an increase to $1.72 billion and $1.95 billion by March 31, 2021, and June 30, 2021, respectively. September 30, 2021, recorded a further growth in net income, touching a high of $2.09 billion.
- However, there was a noticeable dip in net income in December 2021, pulling back to $1.77 billion. The first quarter of 2022 observed a rebound with the net income rising back to $1.92 billion.
- Middle of 2022 experienced some volatilities, with net income falling to $1.75 billion in June, shrugging up slightly to $1.78 billion in September, and then drastically falling to $1.61 billion by the end of the year.
- An overall lull is observed in 2023 with a slight uplift in net income from $1.61 billion recorded at the end of March to $1.66 billion by the end of June.
In summary, BDX’s net income manifested a seesaw trend with some periods of growth followed by times of pullback. Despite the fluctuations, there's an overall 1% growth considering the first value ($1.60 billion) and the latest one ($1.66 billion). The most recent trend indicates a stagnant phase as of June 2023.
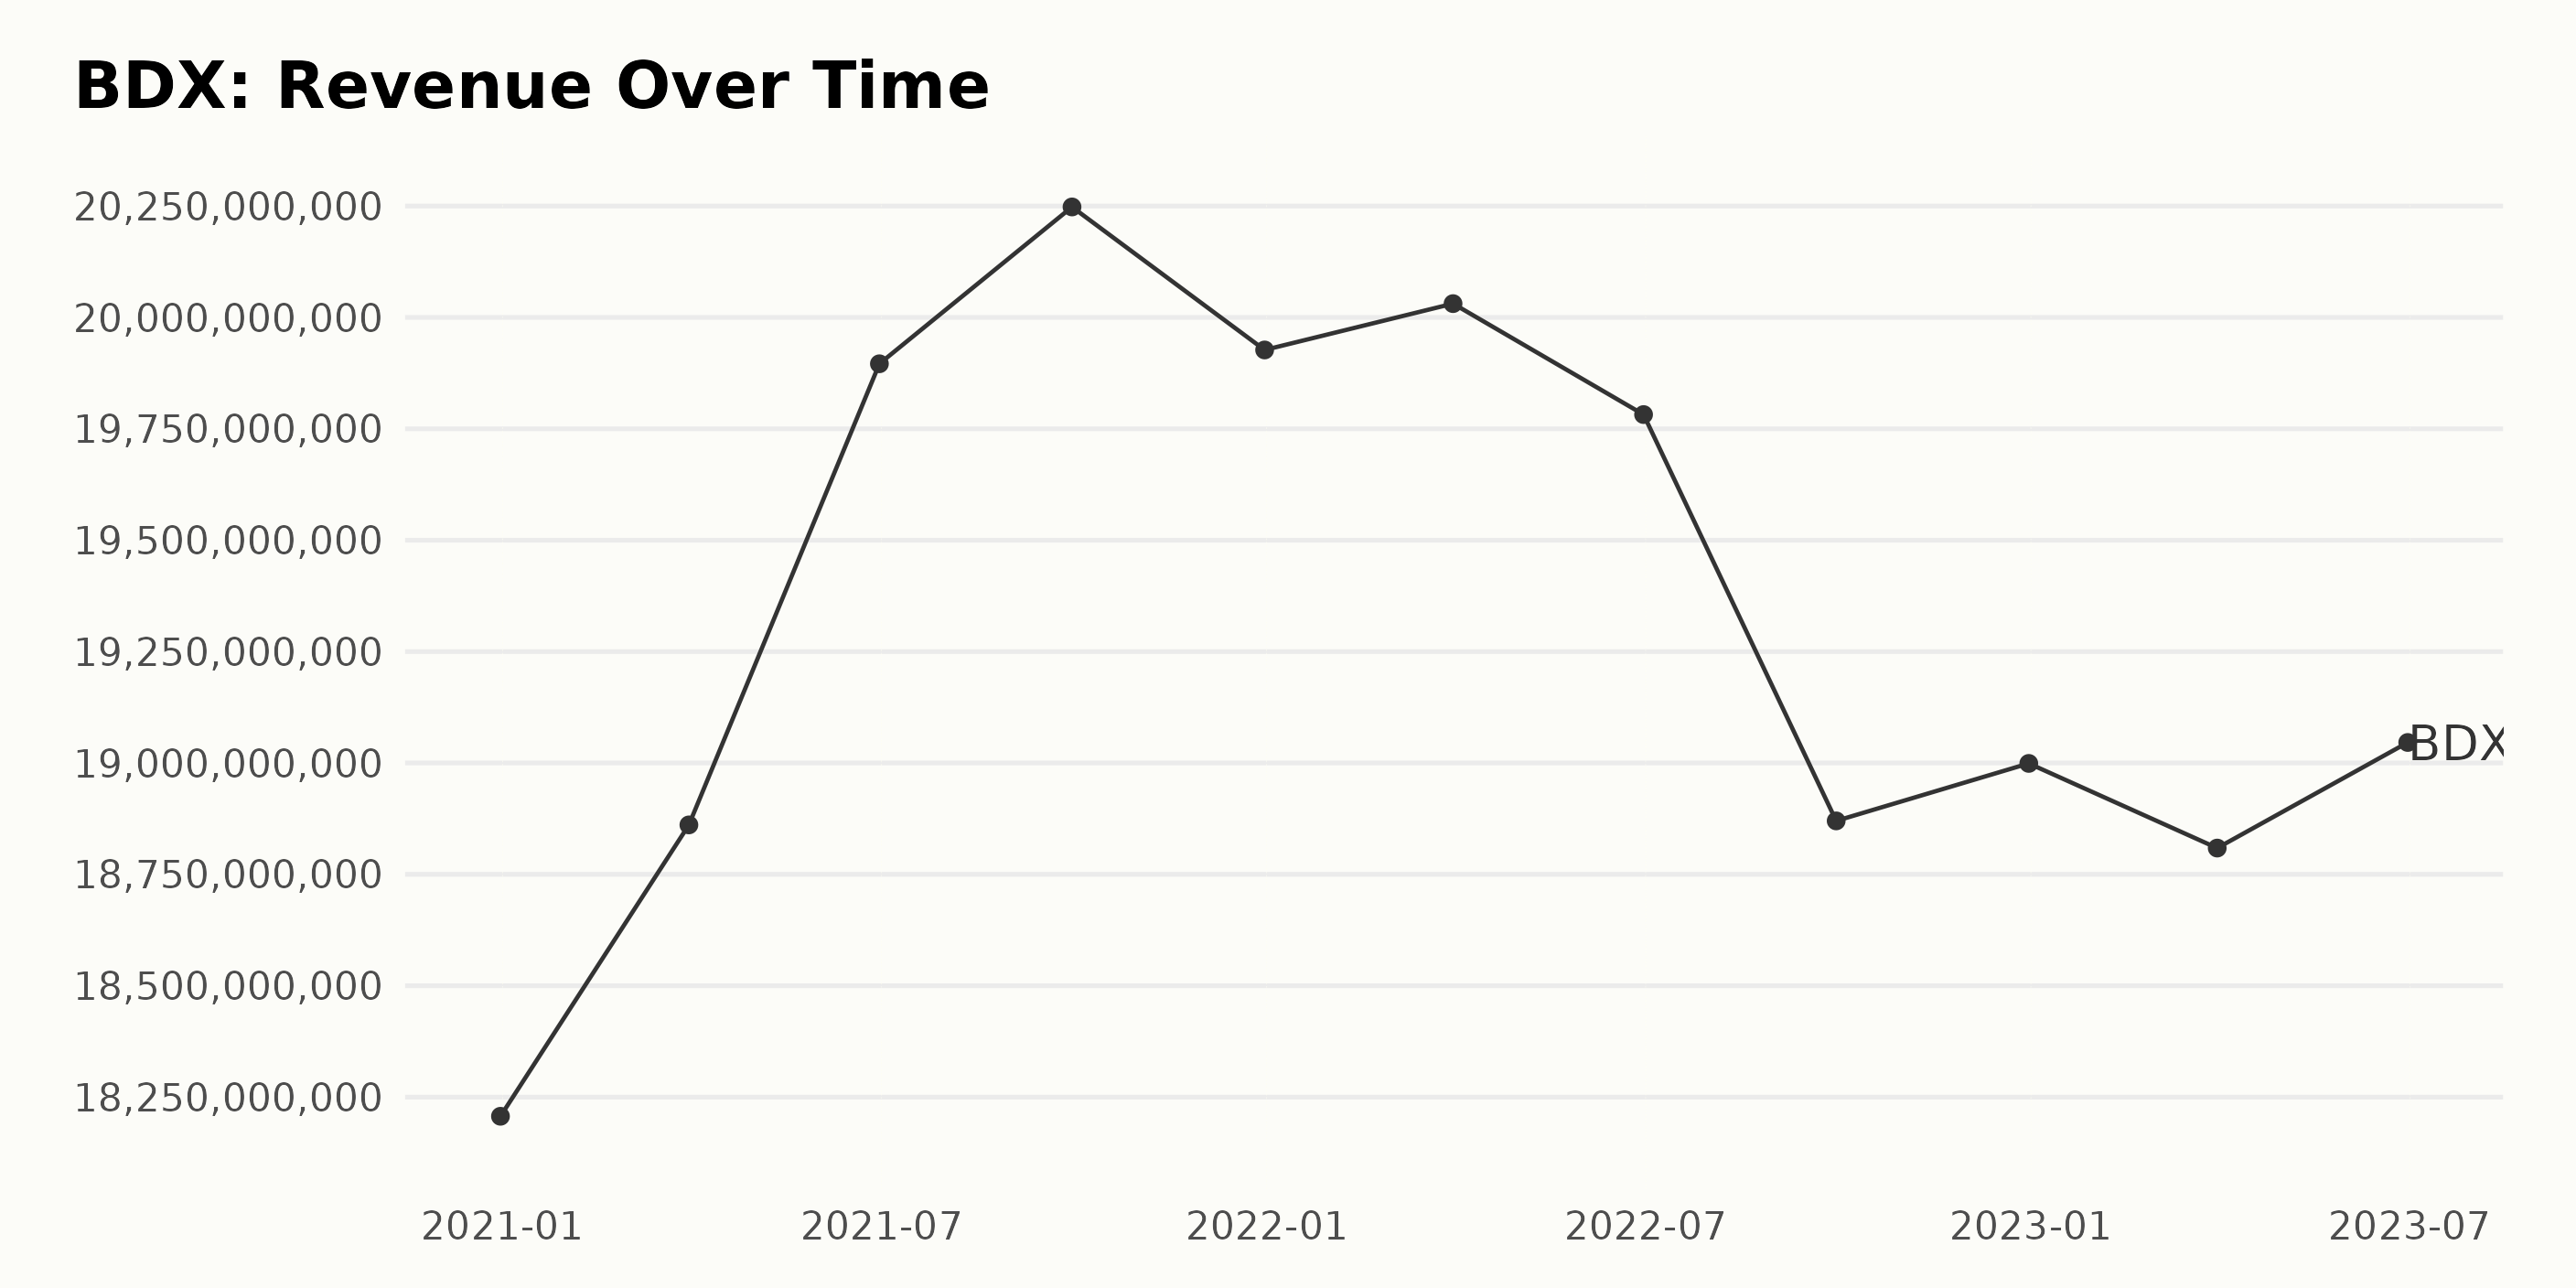
Becton Dickinson and Company (BDX) showed varying trend and fluctuations in their trailing-12-month revenue from December 2020 to June 2023. Here are the significant points:
- Starting at a revenue of $18.21 billion in December 2020, BDX witnessed an initial upward trend till September 2021, peaking at $20.25 billion.
- A slight decline was observed in December 2021, bringing the revenue down to $19.93 billion; however, it marginally increased to $20.03 billion by March 2022.
- The period from June 2022 to March 2023 saw a decline in the firm's reported earnings, hitting a low point of $18.81 billion in March 2023.
- Nonetheless, a slight recovery was seen by June 2023, with the revenue jumping back to $19.05 billion.
Throughout this period, the company's revenue fluctuated, but the overall growth rate, measured by taking the difference between the last and first values, was approximately 4.56%. Despite the variations, BDX's revenue remained within the range of $18.21 billion and $20.25 billion over the analyzed period.
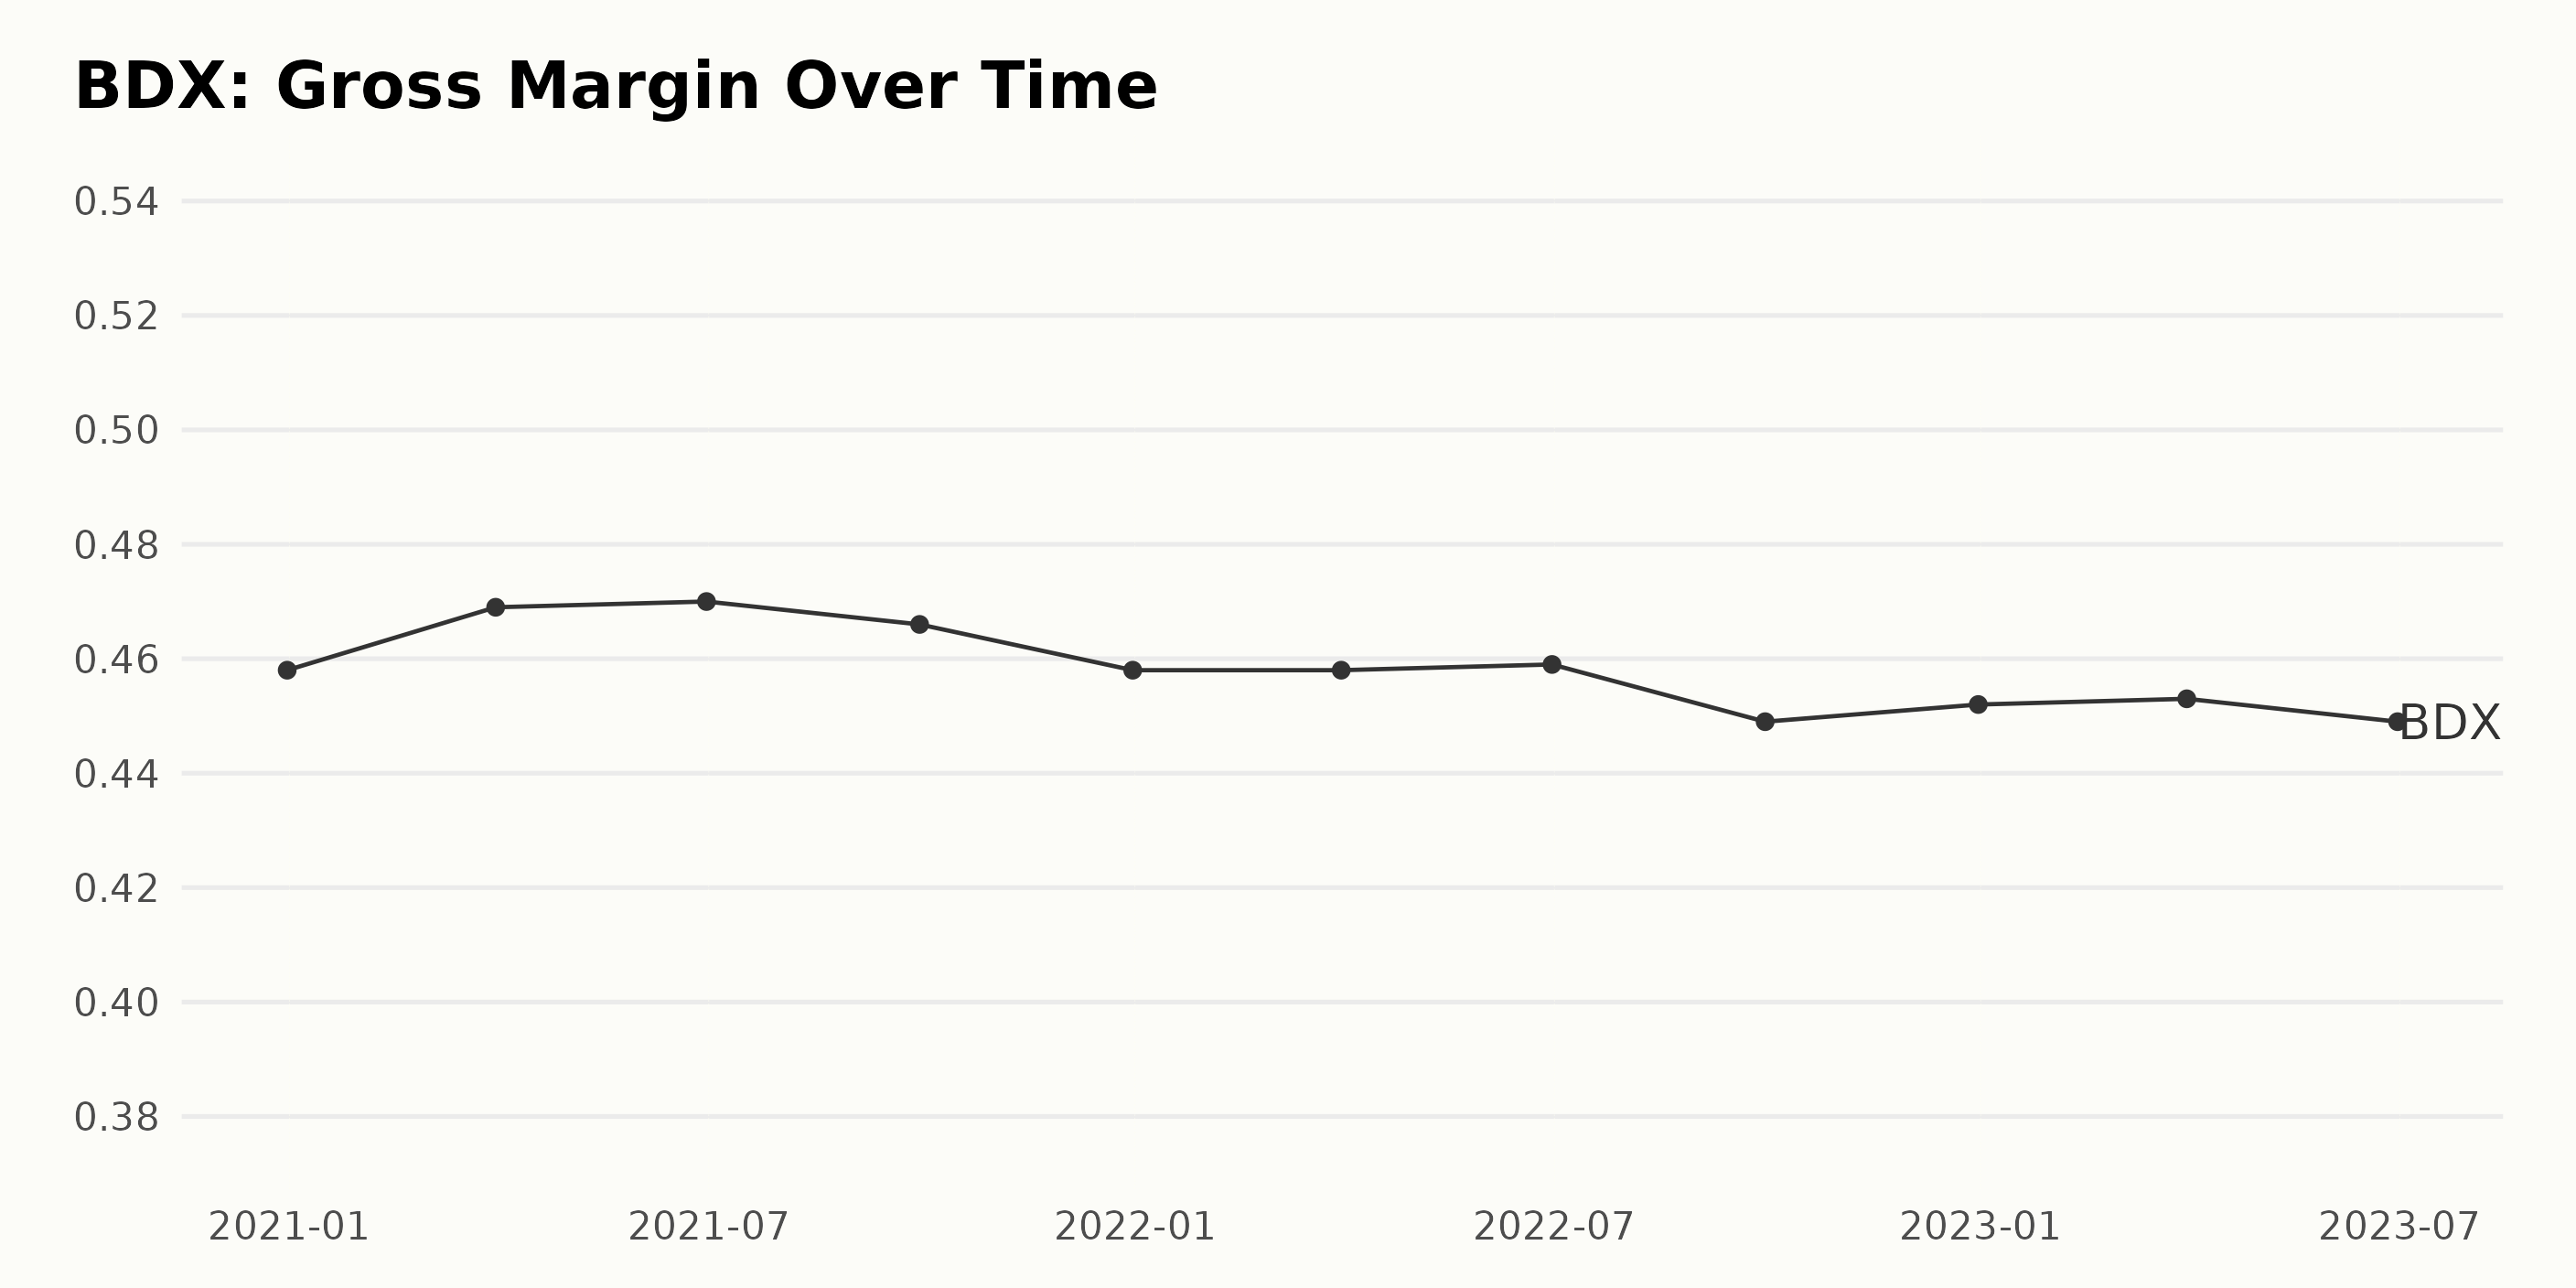
The Gross Margin of Becton Dickinson and Company (BDX) has demonstrated minor fluctuations over the past few years. Here's a detailed look at the significant changes:
- On December 31, 2020, the Gross Margin was at 45.8%.
- There was a slight increase over the first half of 2021, with the Gross Margin reaching 47.0% on June 30, 2021.
- This rise temporarily receded as the Gross Margin fell to 46.6% on September 30, 2021.
- By year-end on December 31, 2021, Gross Margin reduced further to 45.8%.
- The value held steady for the first few months of 2022 till March 31, 2022, where it remained at 45.8%.
- An insignificant rise was noted till June 30, 2022, where the Gross Margin elevated slightly to 45.9%.
- However, a decline was again observed by the end of September 2022, with the Gross Margin falling to 44.9%.
- A small recovery was seen by December 31, 2022, with Gross Margin registering at 45.2%.
- As of June 30, 2023, the gross margin slightly decreased, standing at 44.9%.
Focusing more on the recent data, it can be seen that despite the fluctuations, the Gross Margin has generally remained around the 45% mark. The growth rate from the first recorded data point in December 2020 to the last one in June 2023 stands at a negative 0.9%. This indicates a slight overall decrease in Gross Margin through this period.
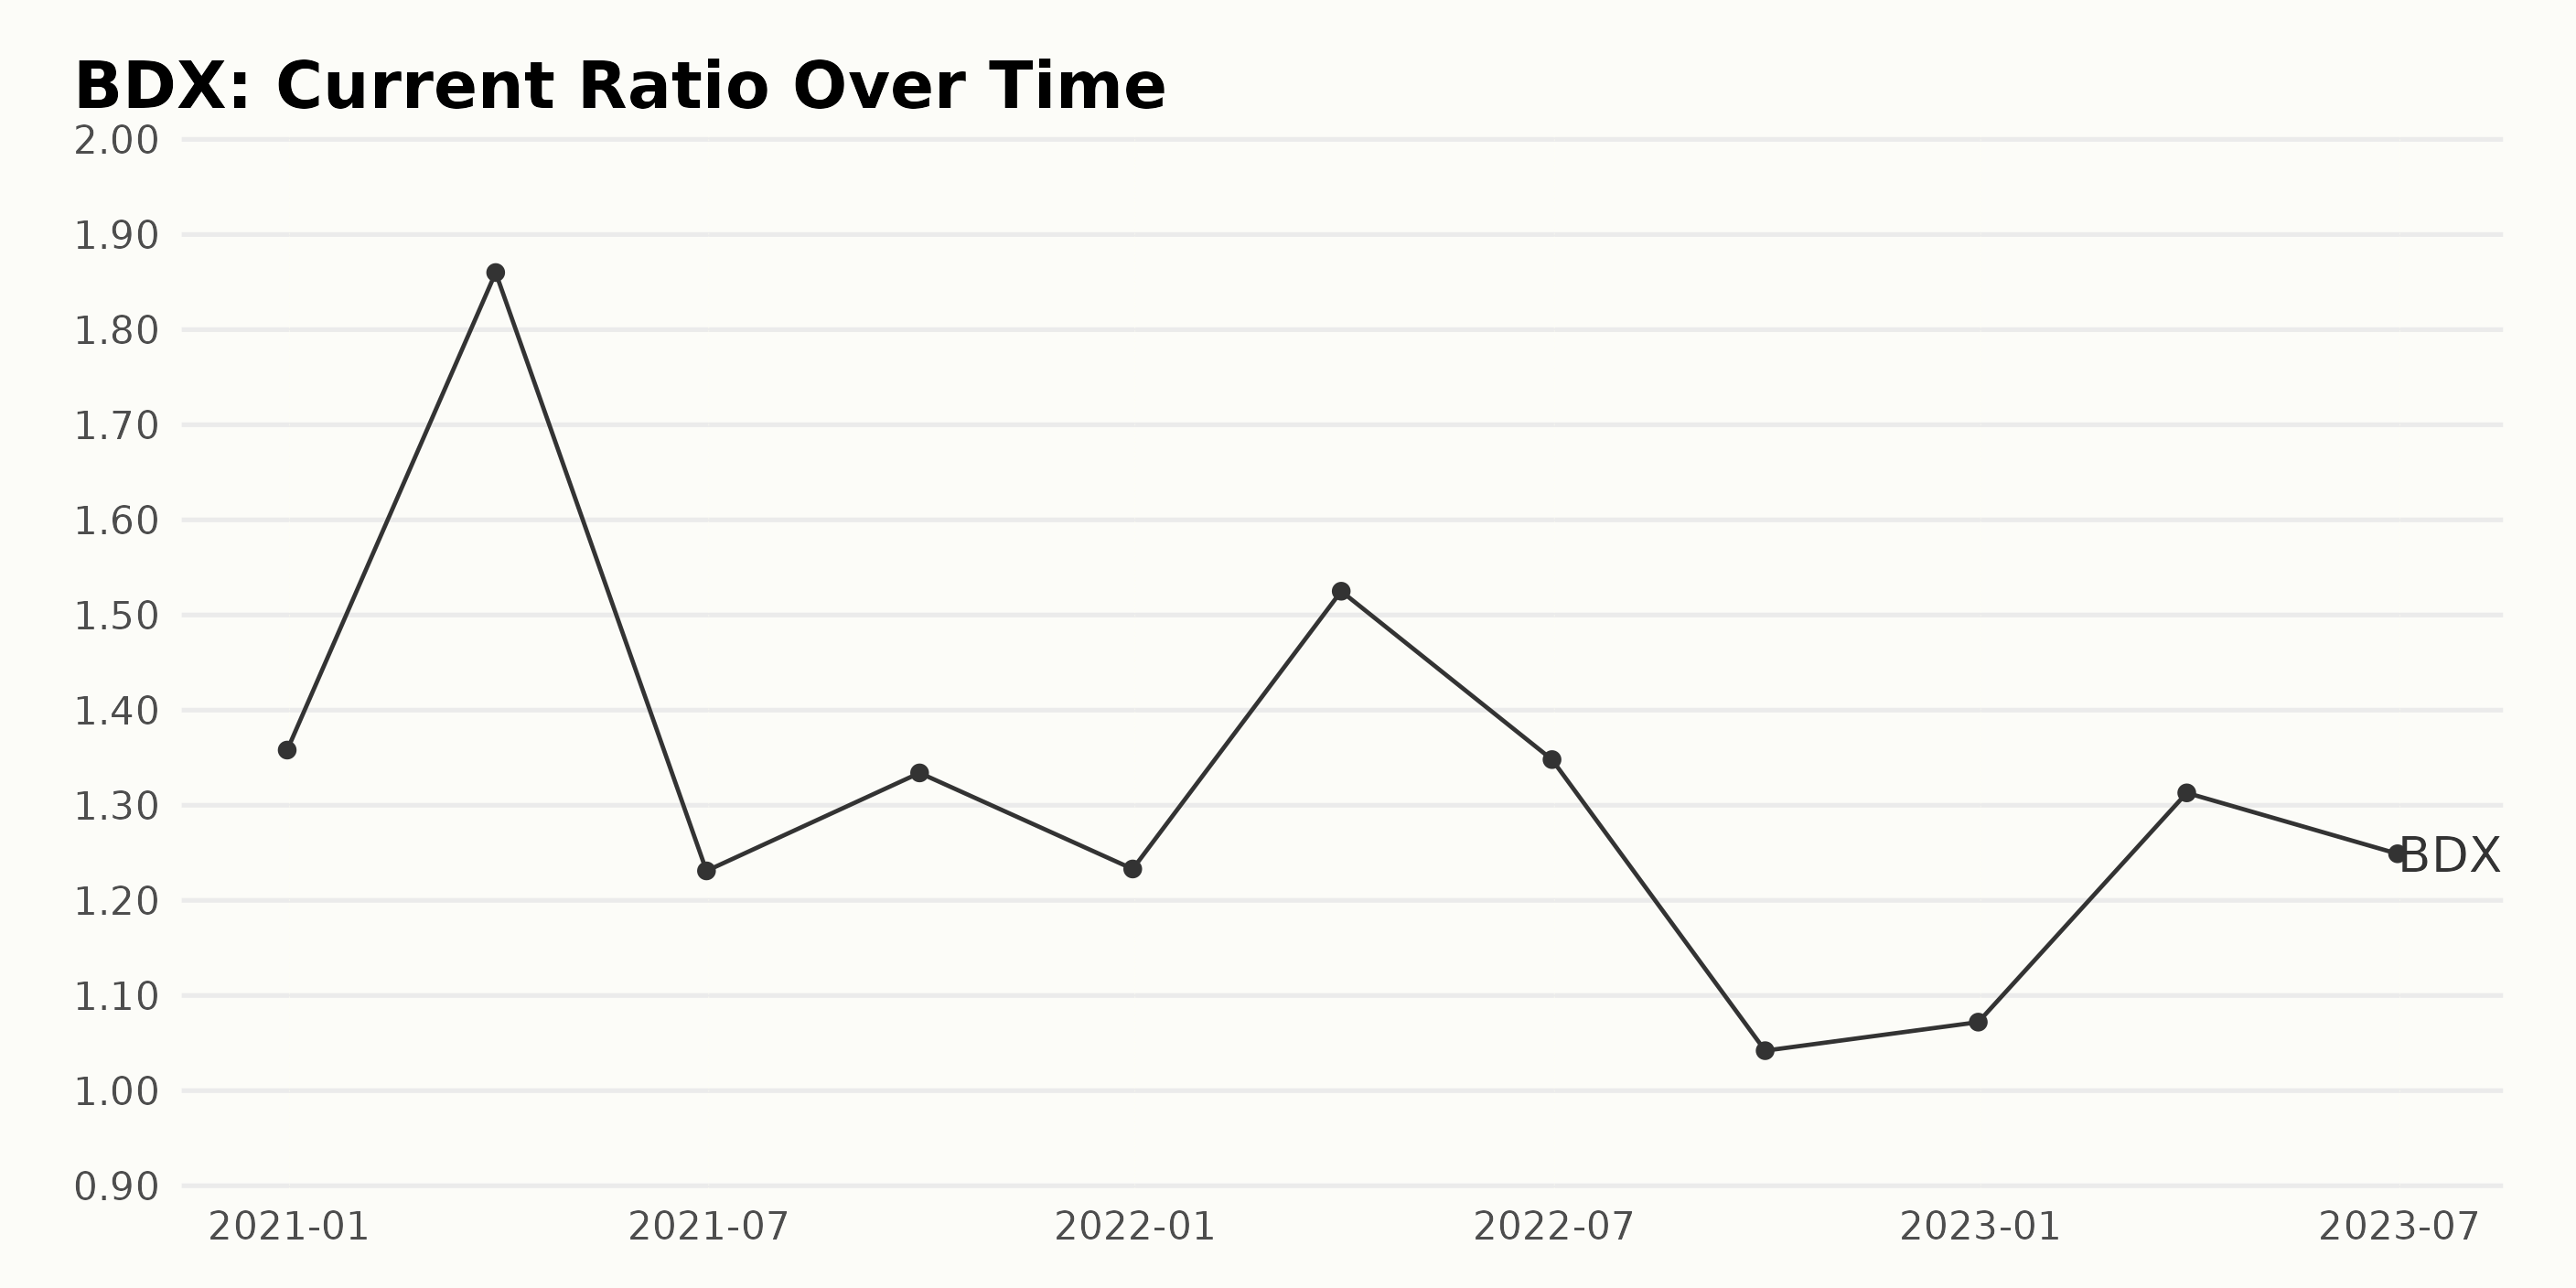
The data contains a series of the Current Ratio for Becton Dickinson and Company (BDX) from December 2020 to June 2023, indicating some volatility over this period.
- As of December 2020, the Current Ratio was reported at 1.36
- The ratio witnessed a significant increase to 1.86 by March 2021 but dropped to 1.23 in June of the same year
- In September 2021, it slightly rebounded to 1.33, only to fall back to 1.23 in December
- Notably, there was a small peak in the first quarter of the next year, reaching 1.53, followed by a subsequent drop again
- From mid-2022, the ratio seemed to hover slightly above or below 1.35, showing some stability
- The ratio plummeted to its lowest point in September 2022, reaching 1.04
- Despite minor upward fluctuations in the following quarters, the ratio as of June 2023 remains lower than the initial value, standing at 1.25.
Therefore, considering the first and last data points directly, the Current Ratio dipped slightly (-0.11), which marks an approximate negative growth rate of 8.1%. Additionally, the overall trend appears to fluctuate, with occasional peaks and lows. The tendency for more recent data shows a slight downward trend from its peak in early 2021, followed by a stabilization around a similarly lower value. Therefore, while there is no steady trend visible over this period, the more recent data suggests a gradual lowering in Becton Dickinson and Company's Current Ratio.
Analyzing BDX's Six-Month Stock Performance: Growth, Decline, and Variability
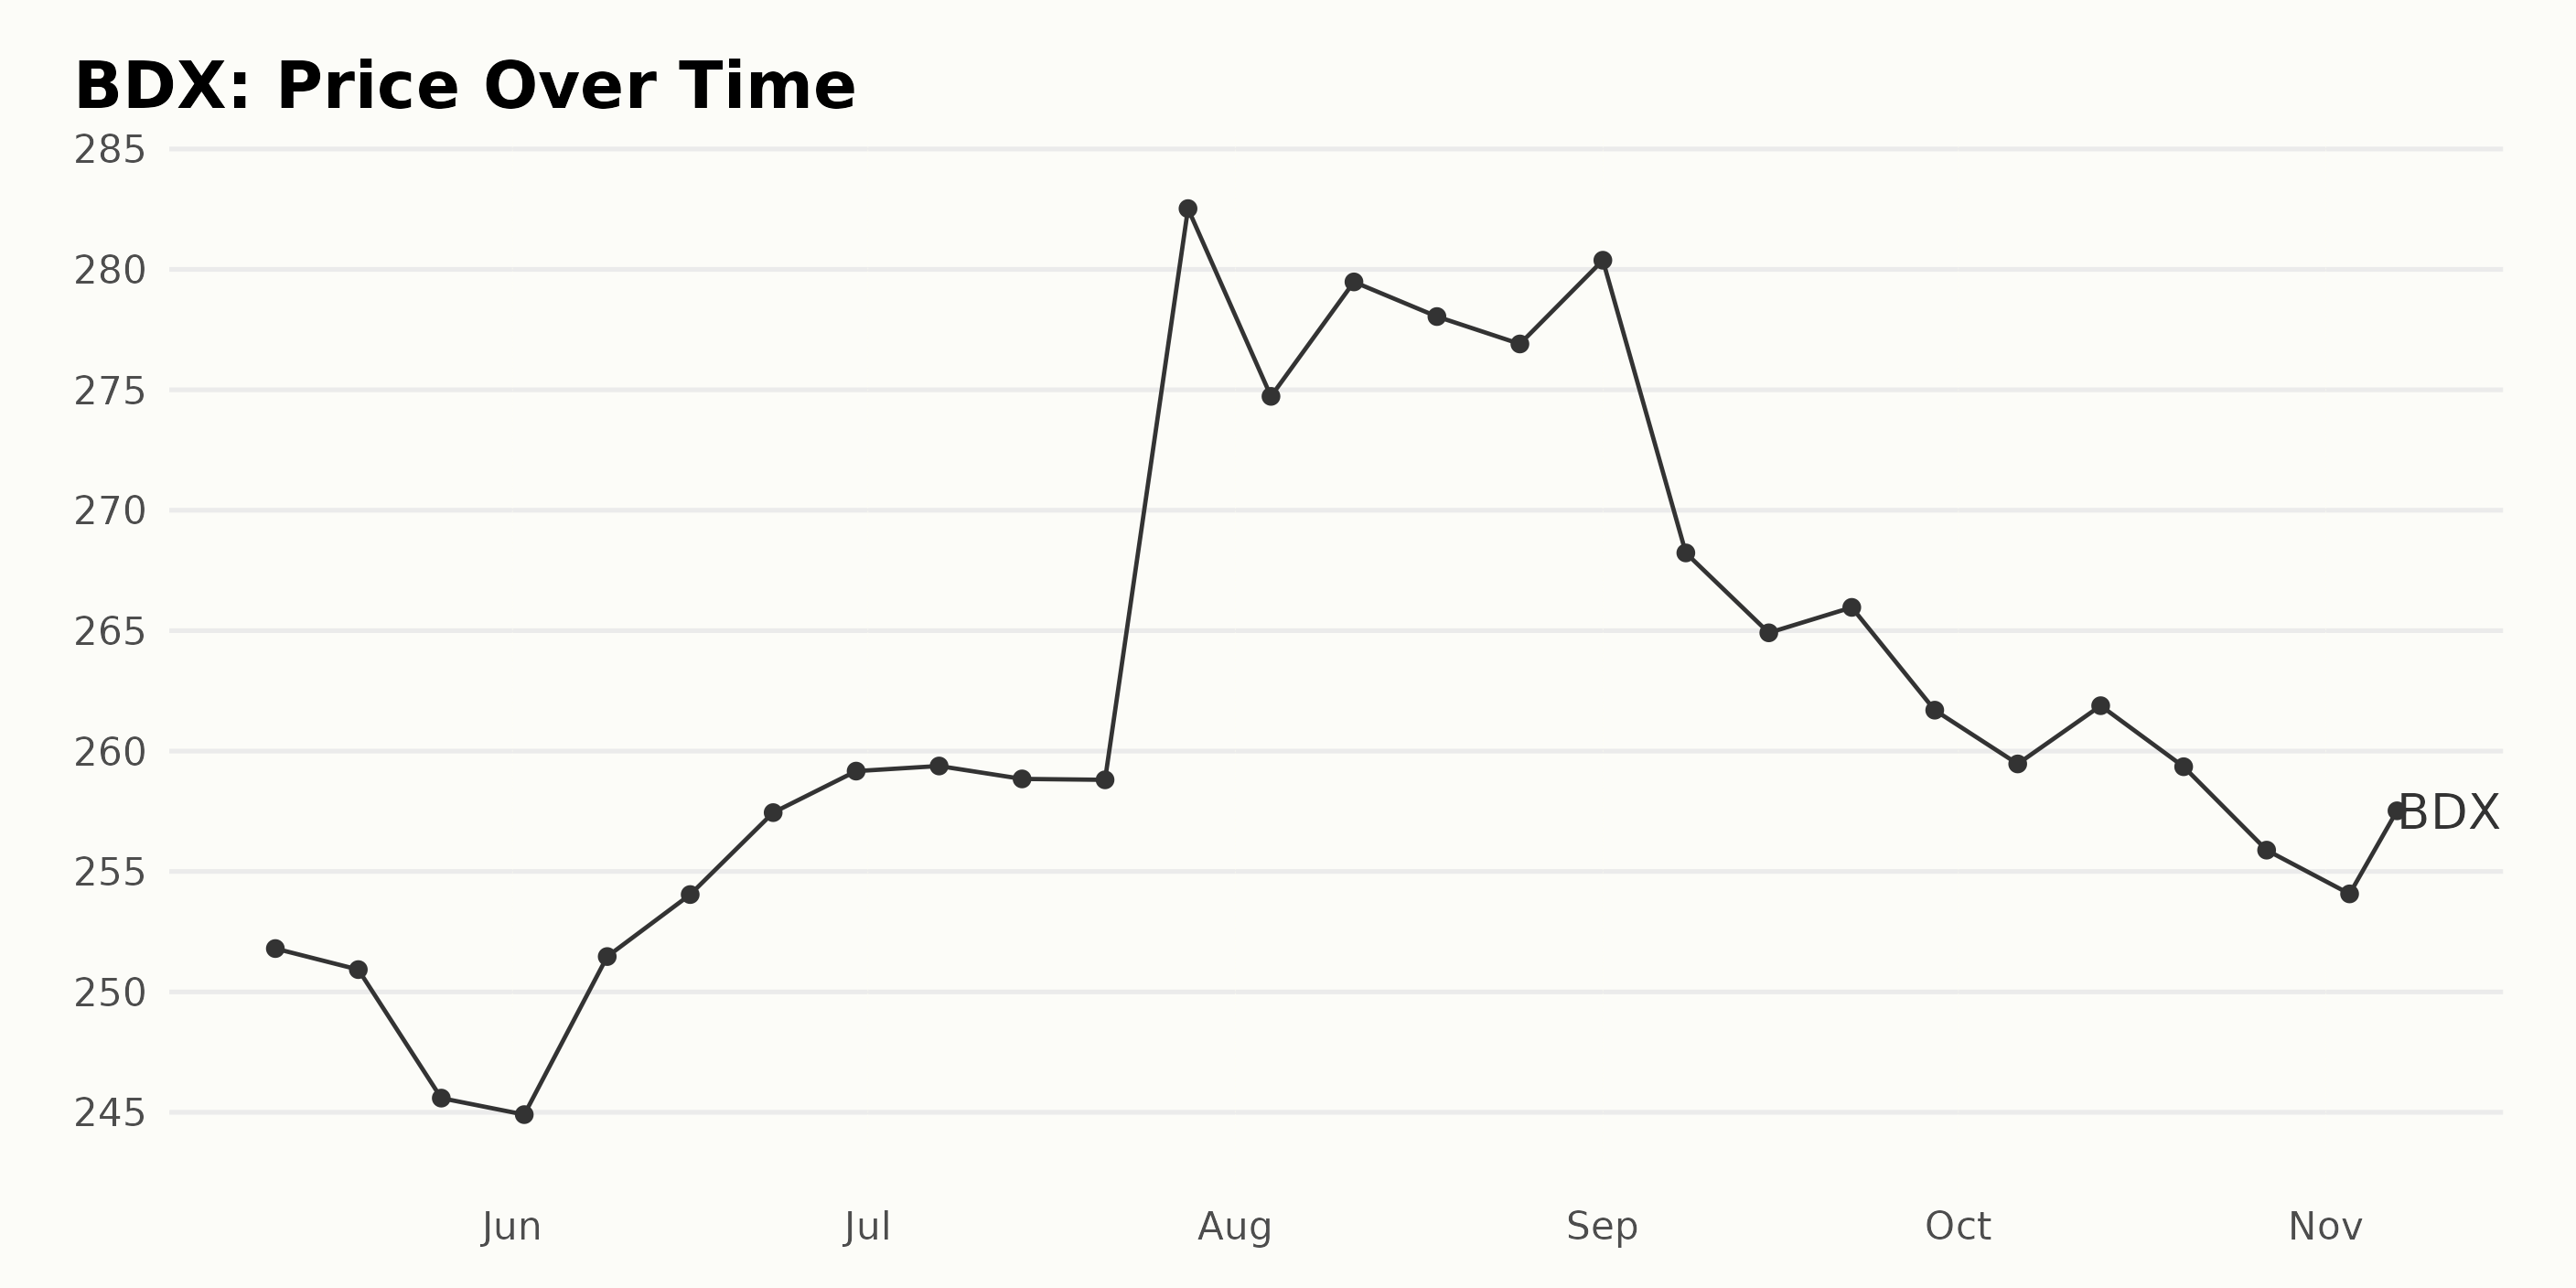
The data presents the trend of the share price of Becton Dickinson and Company (BDX) from May 12, 2023, to November 7, 2023. Here's the trend outlined:
- On May 12, 2023, BDX's value was $251.80.
- By May 26, 2023, the share price dropped slightly to $245.59, indicating a slight decrease trend.
- However, a subsequent upward trend was noted from June 2, 2023 ($244.90) peaking at $259.38 on July 7, 2023.
- In the third week of July, the share price showed marginal stagnation hovering around $258.80 till the end of the month.
- A notable increase was seen towards the end of July, shooting up to a remarkable $282.52 on July 28, 2023.
- From the start of August 2023, the share price started a slow decline. By September 1, 2023, it declined to $280.38.
- The most significant drop during this period was spotted on September 8, 2023, where it sharply fell to $268.23.
- From several points of fluctuations in September, the share price continued a general downward trend, decreasing to $255.89 by the end of October 2023.
- As of the last data point on November 7, 2023, the share price stands at $257.52.
In terms of growth rate, it oscillated, with an overall increase from $251.80 in May to $257.52 in early November. However, the final value is less than the peak value of $282.52 reached on July 28, 2023, indicating a decline since that peak.
Overall, the trend of BDX shares from May to November 2023 has been variable with periods of growth and decline. After peaking in late July, the general trend appeared to be a slow, uneven decline.
Here is a chart of BDX's price over the past 180 days.
Analyzing POWR Ratings for Becton Dickinson: Growth, Stability, and Diminishing Momentum
BDX has an overall C rating, translating to a Neutral in our POWR Ratings system. It is ranked #59 out of the 145 stocks in the Medical - Devices & Equipment category.
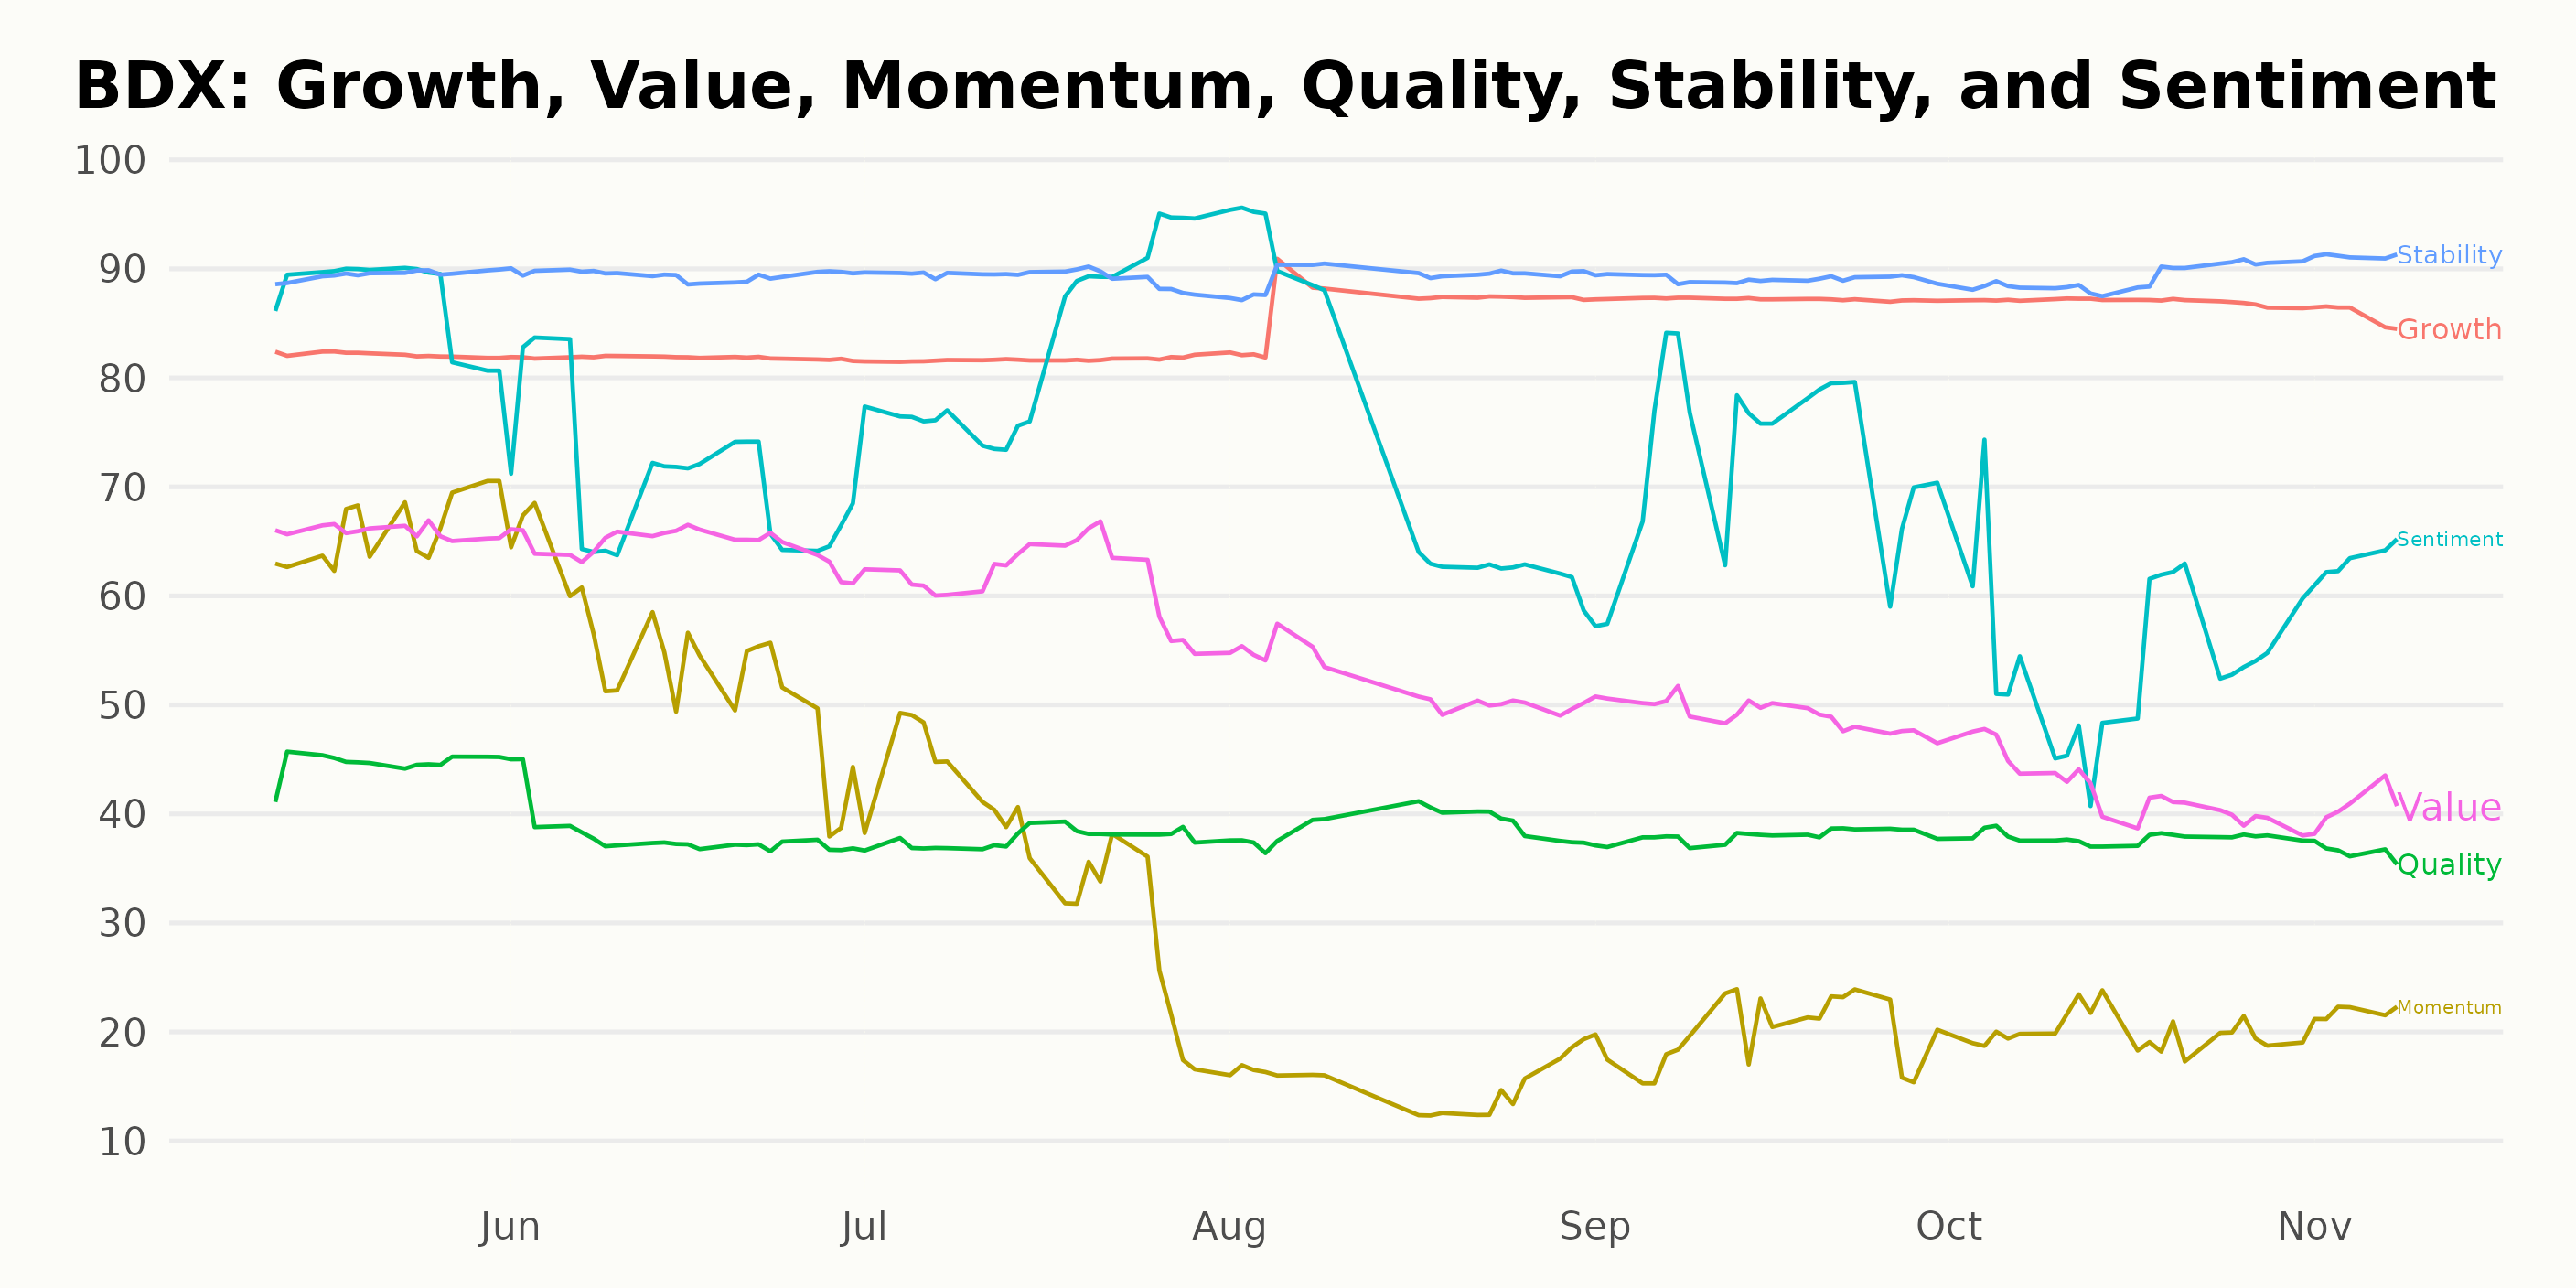
Upon analysis of the POWR Ratings for BDX, three dimensions consistently stand out as noteworthy over the period from May 31, 2023 to November 8, 2023. These dimensions are Growth, Stability, and Momentum.
Growth: The growth dimension receives relatively high ratings throughout the analyzed period. On May 31, 2023, the growth rating stands at 82. This value stays consistent through July 29, 2023, after which it experiences a slight increase, peaking at 87 from September to October 2023 before settling to 86 by November 8, 2023.
Stability: Stability is another dimension where BDX shines, with ratings indicating strong stability. Starting from a rating of 89 on May 31, 2023, it remains steady at this number until August 2023. Then, in November 2023, Becton Dickinson and Company sees a slight increase in its stability rating to 91, the highest across all dimensions during this period.
Momentum: In contrast to the previous two dimensions, momentum shows a clear downward trend in ratings over the considered time span. While the momentum rating starts at a respectable 66 on May 31, 2023, it drops substantially over the next few months. By August 31, 2023, the momentum rating dips to 15, hinting at a significant loss of pace. Although there's a small rebound to 22 by November 8, 2023, the overall decline stands out.
In conclusion, while Becton Dickinson and Company shows strong growth and stability according to its POWR ratings, its momentum over this period diminishes significantly.
How does Becton Dickinson and Company (BDX) Stack Up Against its Peers?
Other stocks in the Medical - Devices & Equipment sector that may be worth considering are Fonar Corporation (FONR), MiMedx Group Inc (MDXG), and Electromed Inc. (ELMD) -- they have better POWR Ratings.
What To Do Next?
Discover 10 widely held stocks that our proprietary model shows have tremendous downside potential. Please make sure none of these “death trap” stocks are lurking in your portfolio:
BDX shares were trading at $254.27 per share on Wednesday afternoon, down $1.84 (-0.72%). Year-to-date, BDX has gained 1.08%, versus a 15.20% rise in the benchmark S&P 500 index during the same period.
About the Author: Subhasree Kar

Subhasree’s keen interest in financial instruments led her to pursue a career as an investment analyst. After earning a Master’s degree in Economics, she gained knowledge of equity research and portfolio management at Finlatics.
The post Becton Dickinson & Co. (BDX) Earnings Moves: A Buy or Sell for Investors? appeared first on StockNews.com