


TransDigm Group Incorporated (TDG) supplies aircraft components internationally. After a robust third-quarter result, the company expects its fiscal 2023 adjusted earnings per share between $24.94 to $25.36, higher than its previous forecast of $23.31 to $24.19. It also raised its net sales forecast for the year to a range of $6.53 billion-$6.59 billion from the earlier estimate of $6.41 billion-$6.50 billion.
However, the company is trading at a significant premium compared to its peers. In terms of forward EV/Sales, TDG is trading at 10.04x, 513% higher than the industry average of 1.64. Its forward Price/Sales multiple of 7.50 is 481.9% higher than the industry multiple of 1.29.
Given this mixed story, let’s look at TDG’s key financial metrics to understand why it could be wise to wait for a better entry point in the stock before the company reports its fourth-quarter financials tomorrow.
Analyzing Financial Trends for TransDigm Group Incorporated: A 2021-2023 Overview
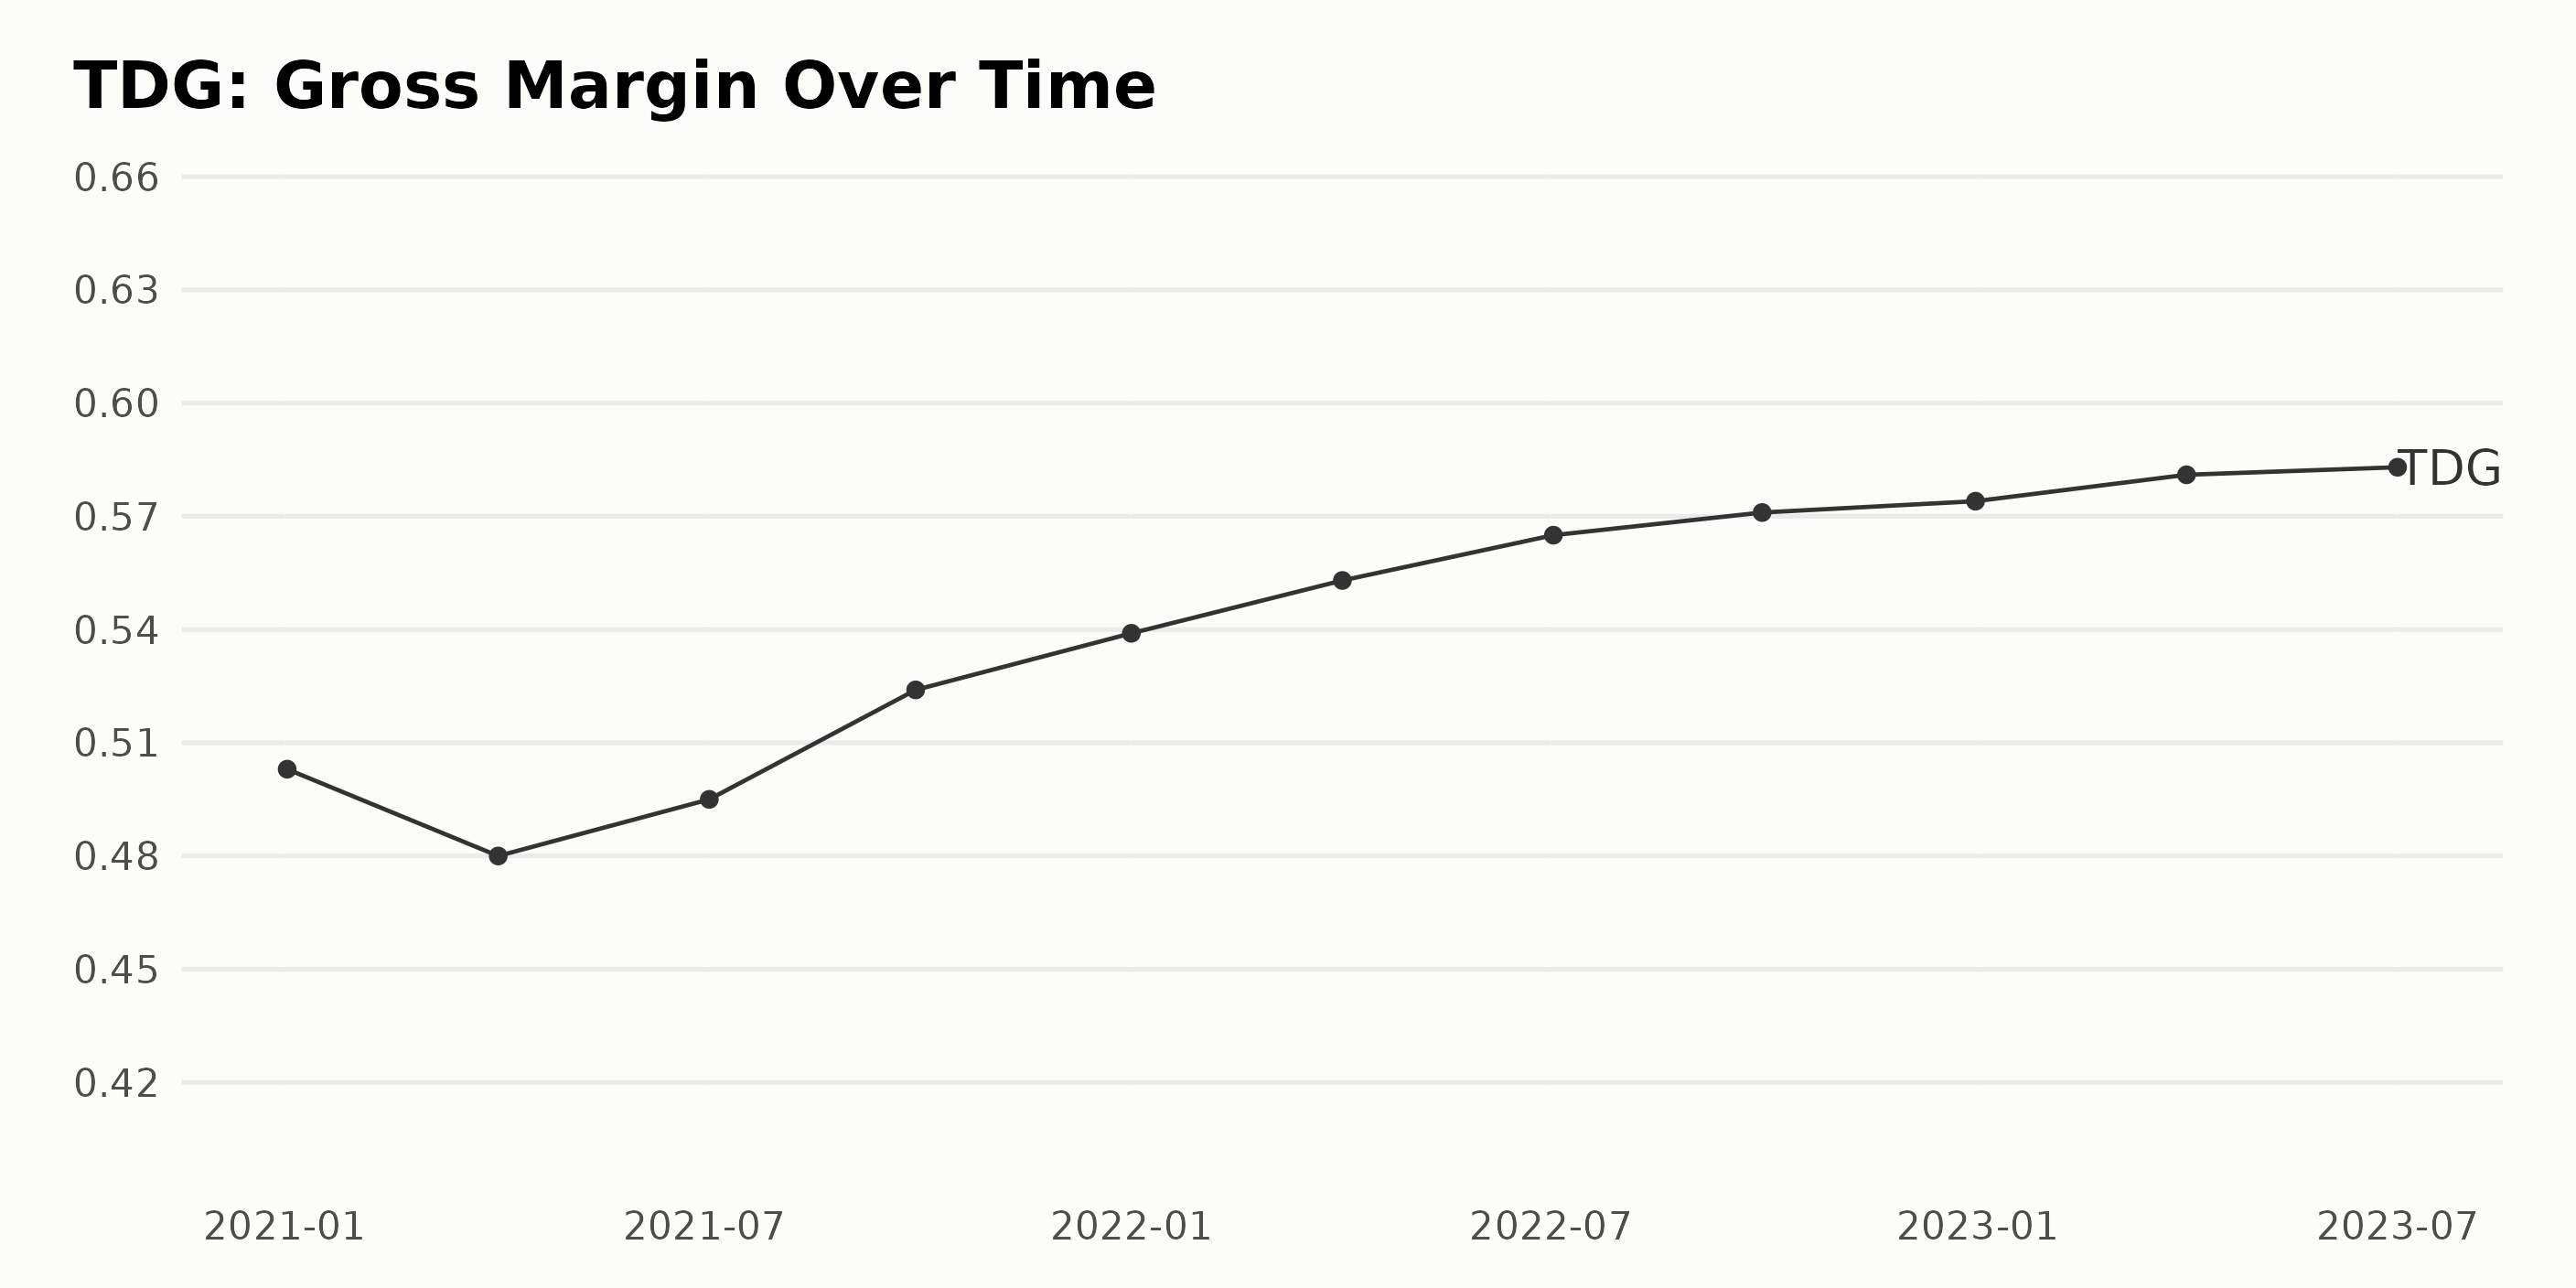
Examining the gross margin of TDG, there is a clear upward trend over the last two years:
- January 2, 2021: 50.30%
- April 3, 2021: 48.00%
- July 3, 2021: 49.50%
- September 30, 2021: 52.40%
- January 1, 2022: 53.90%
- April 2, 2022: 55.30%
- July 2, 2022: 56.50%
- September 30, 2022: 57.10%
- December 31, 2022: 57.40%
- April 1, 2023: 58.10%
- July 1, 2023: 58.30%
Although the gross margin fluctuates slightly during this period, it has generally increased from 50.3% at the start of 2021 to 58.3% by July 2023. This represents a growth rate of approximately 15.9% over the given period. While it was a consistent rise, there was a notable dip in the gross margin between January and April of 2021 before it resumed its upward trajectory.
More recently, however, the increases have begun to slow. This is most evident between April and July of 2023, where the gross margin only increased by 0.2%. Overall, these figures show strong growth for TDG but with a potential sign of deceleration in more recent data. The highest reported value was 58.3% in July 2023, indicating the company's current performance.
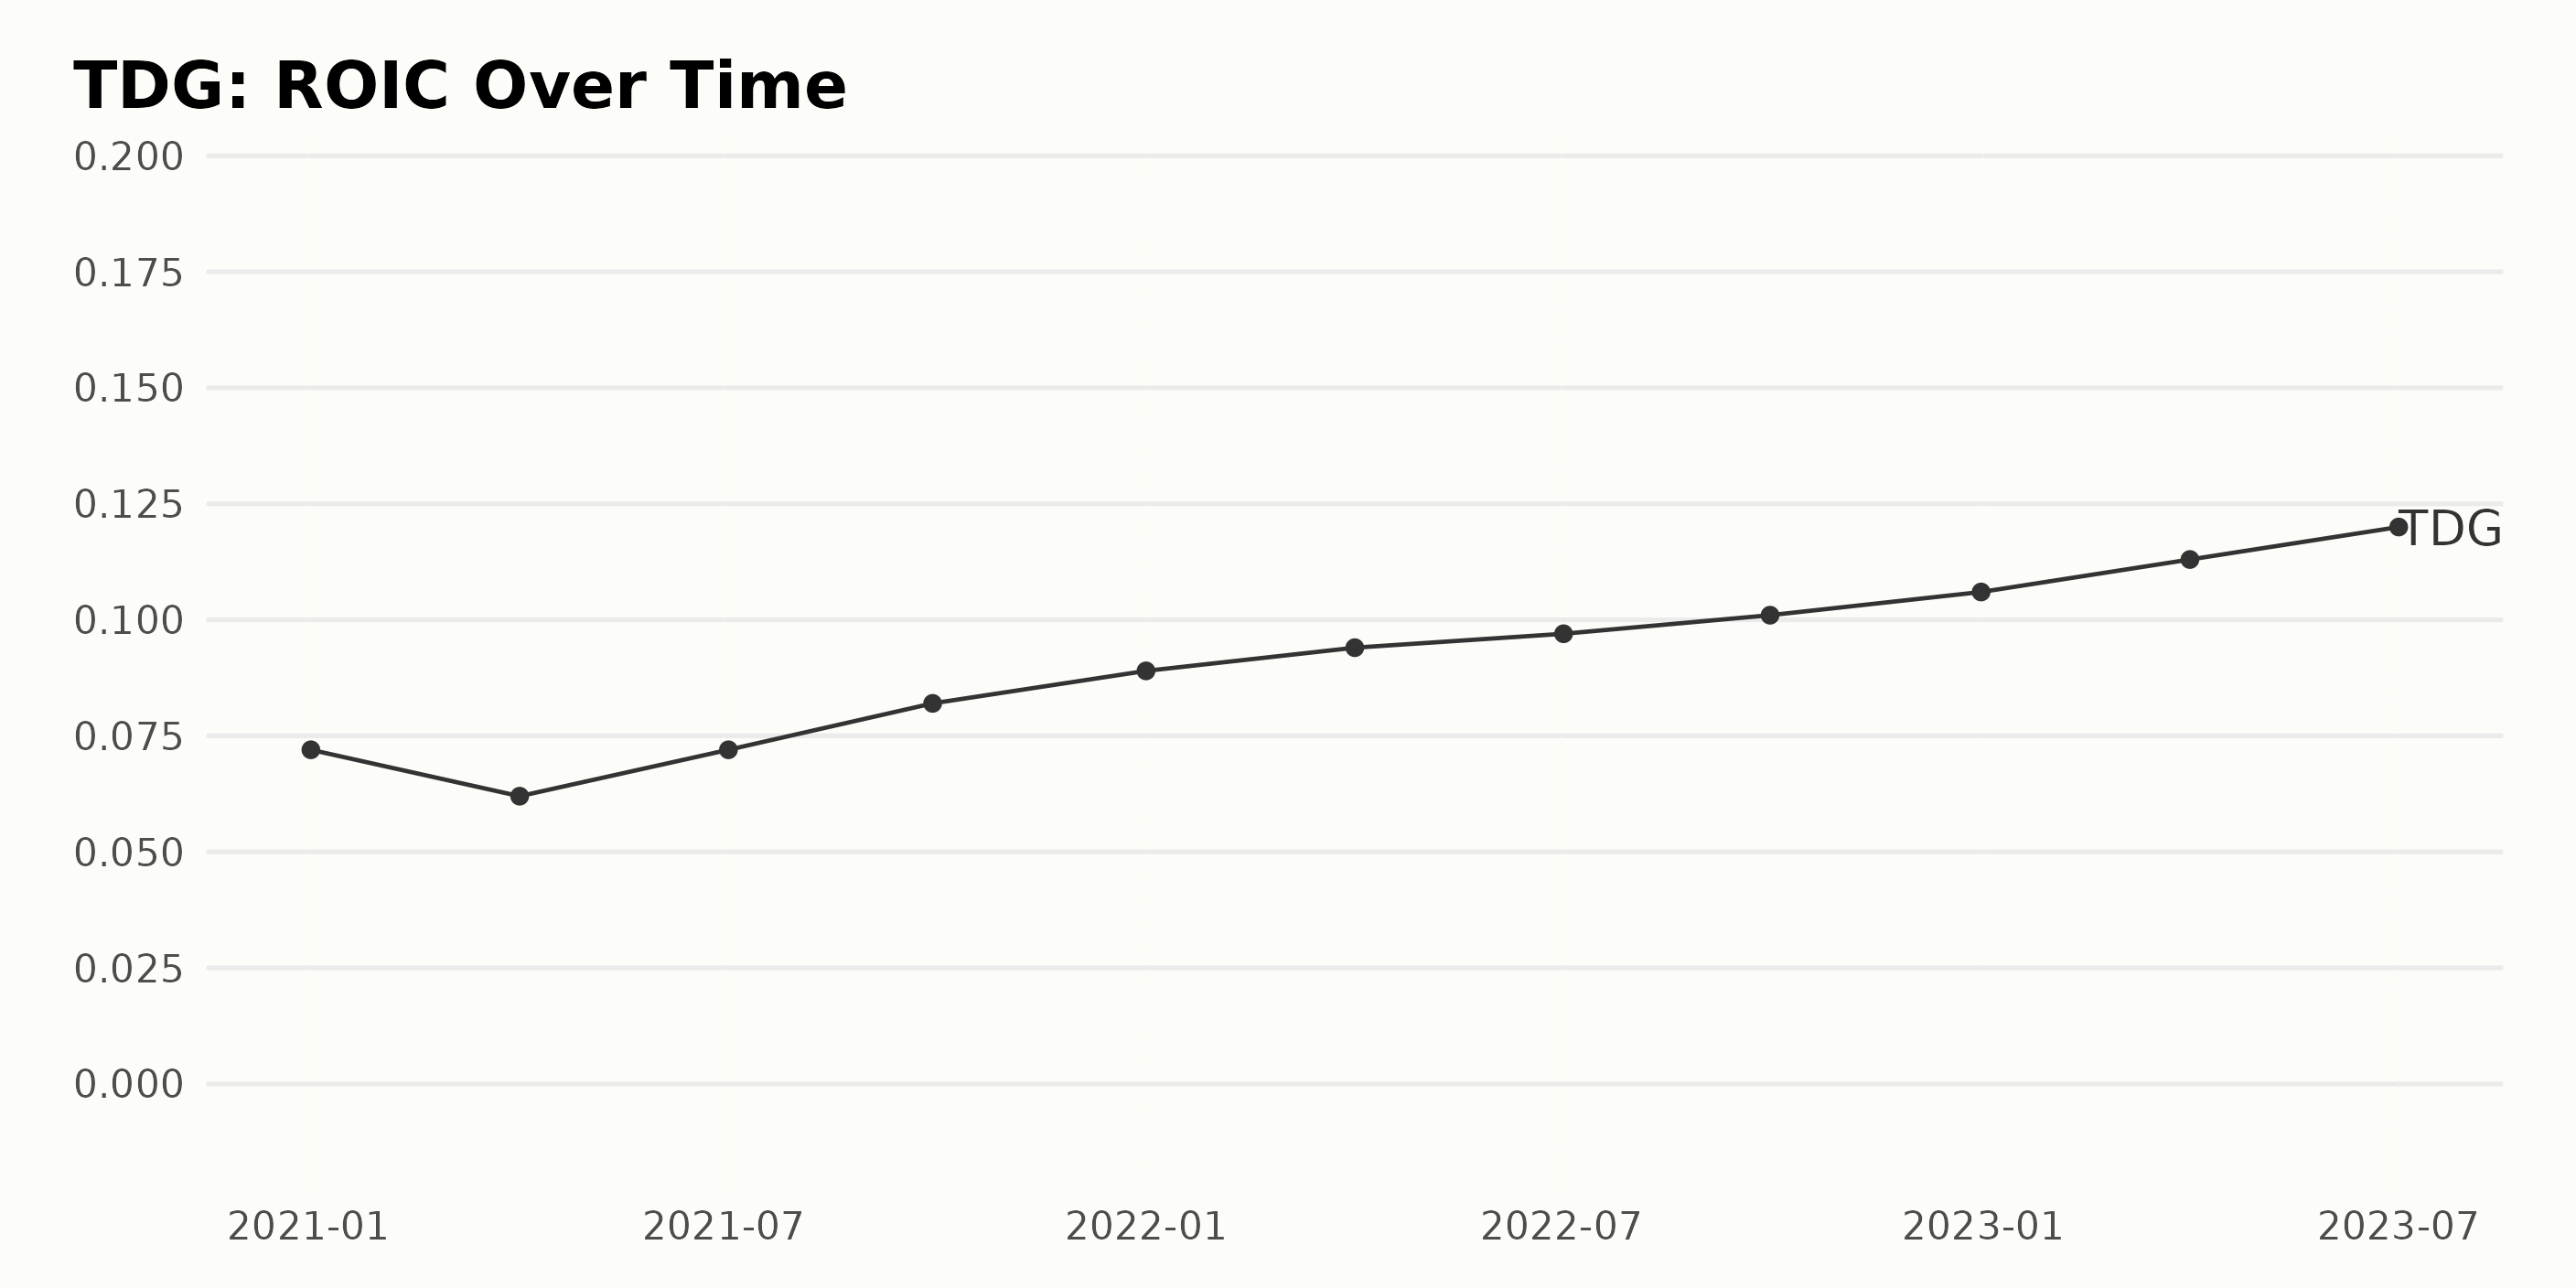
The trend of ROIC (Return on Invested Capital) for TDG has generally shown a positive trajectory over the reported period.
- At the beginning of the series on January 2, 2021, the company reported a ROIC of 7.2%.
- By April 3, 2021, there was a slight dip to 6.2%, followed by a return to the initial figure of 7.2% in July 2021.
- However, from September 2021 and onward, a consistent upward trend is observed in the data. On September 30, 2021, the ROIC increased to 8.2%, and by the end of the year, it had risen to 8.9%.
- The growth continued into the following year with ROIC of 9.4%, 9.7%, and 10.1% reported on April 2, July 2, and September 30, respectively, in 2022.
- The data series concludes with an elevated ROIC of 11.3% in April 2023 and a peak at 12% on July 1, 2023.
In terms of fluctuations, the largest change within a single quarter was noticed between December 31, 2022, and April 1, 2023, when the ROIC increased by a factor of 0.007 (0.7 percentage points). The overall growth rate, calculated by comparing the final value in July 2023 with the initial value in January 2021, indicates a significant increase, with the ROIC having grown from 7.2% to 12%.
This represents a growth rate of about 66.7% over the 2.5-year period. This suggests that during this time, TDG has become increasingly efficient at using investment capital to generate profits. However, it is advisable to keep monitoring these trends and other operational aspects of TDG for a more comprehensive evaluation.
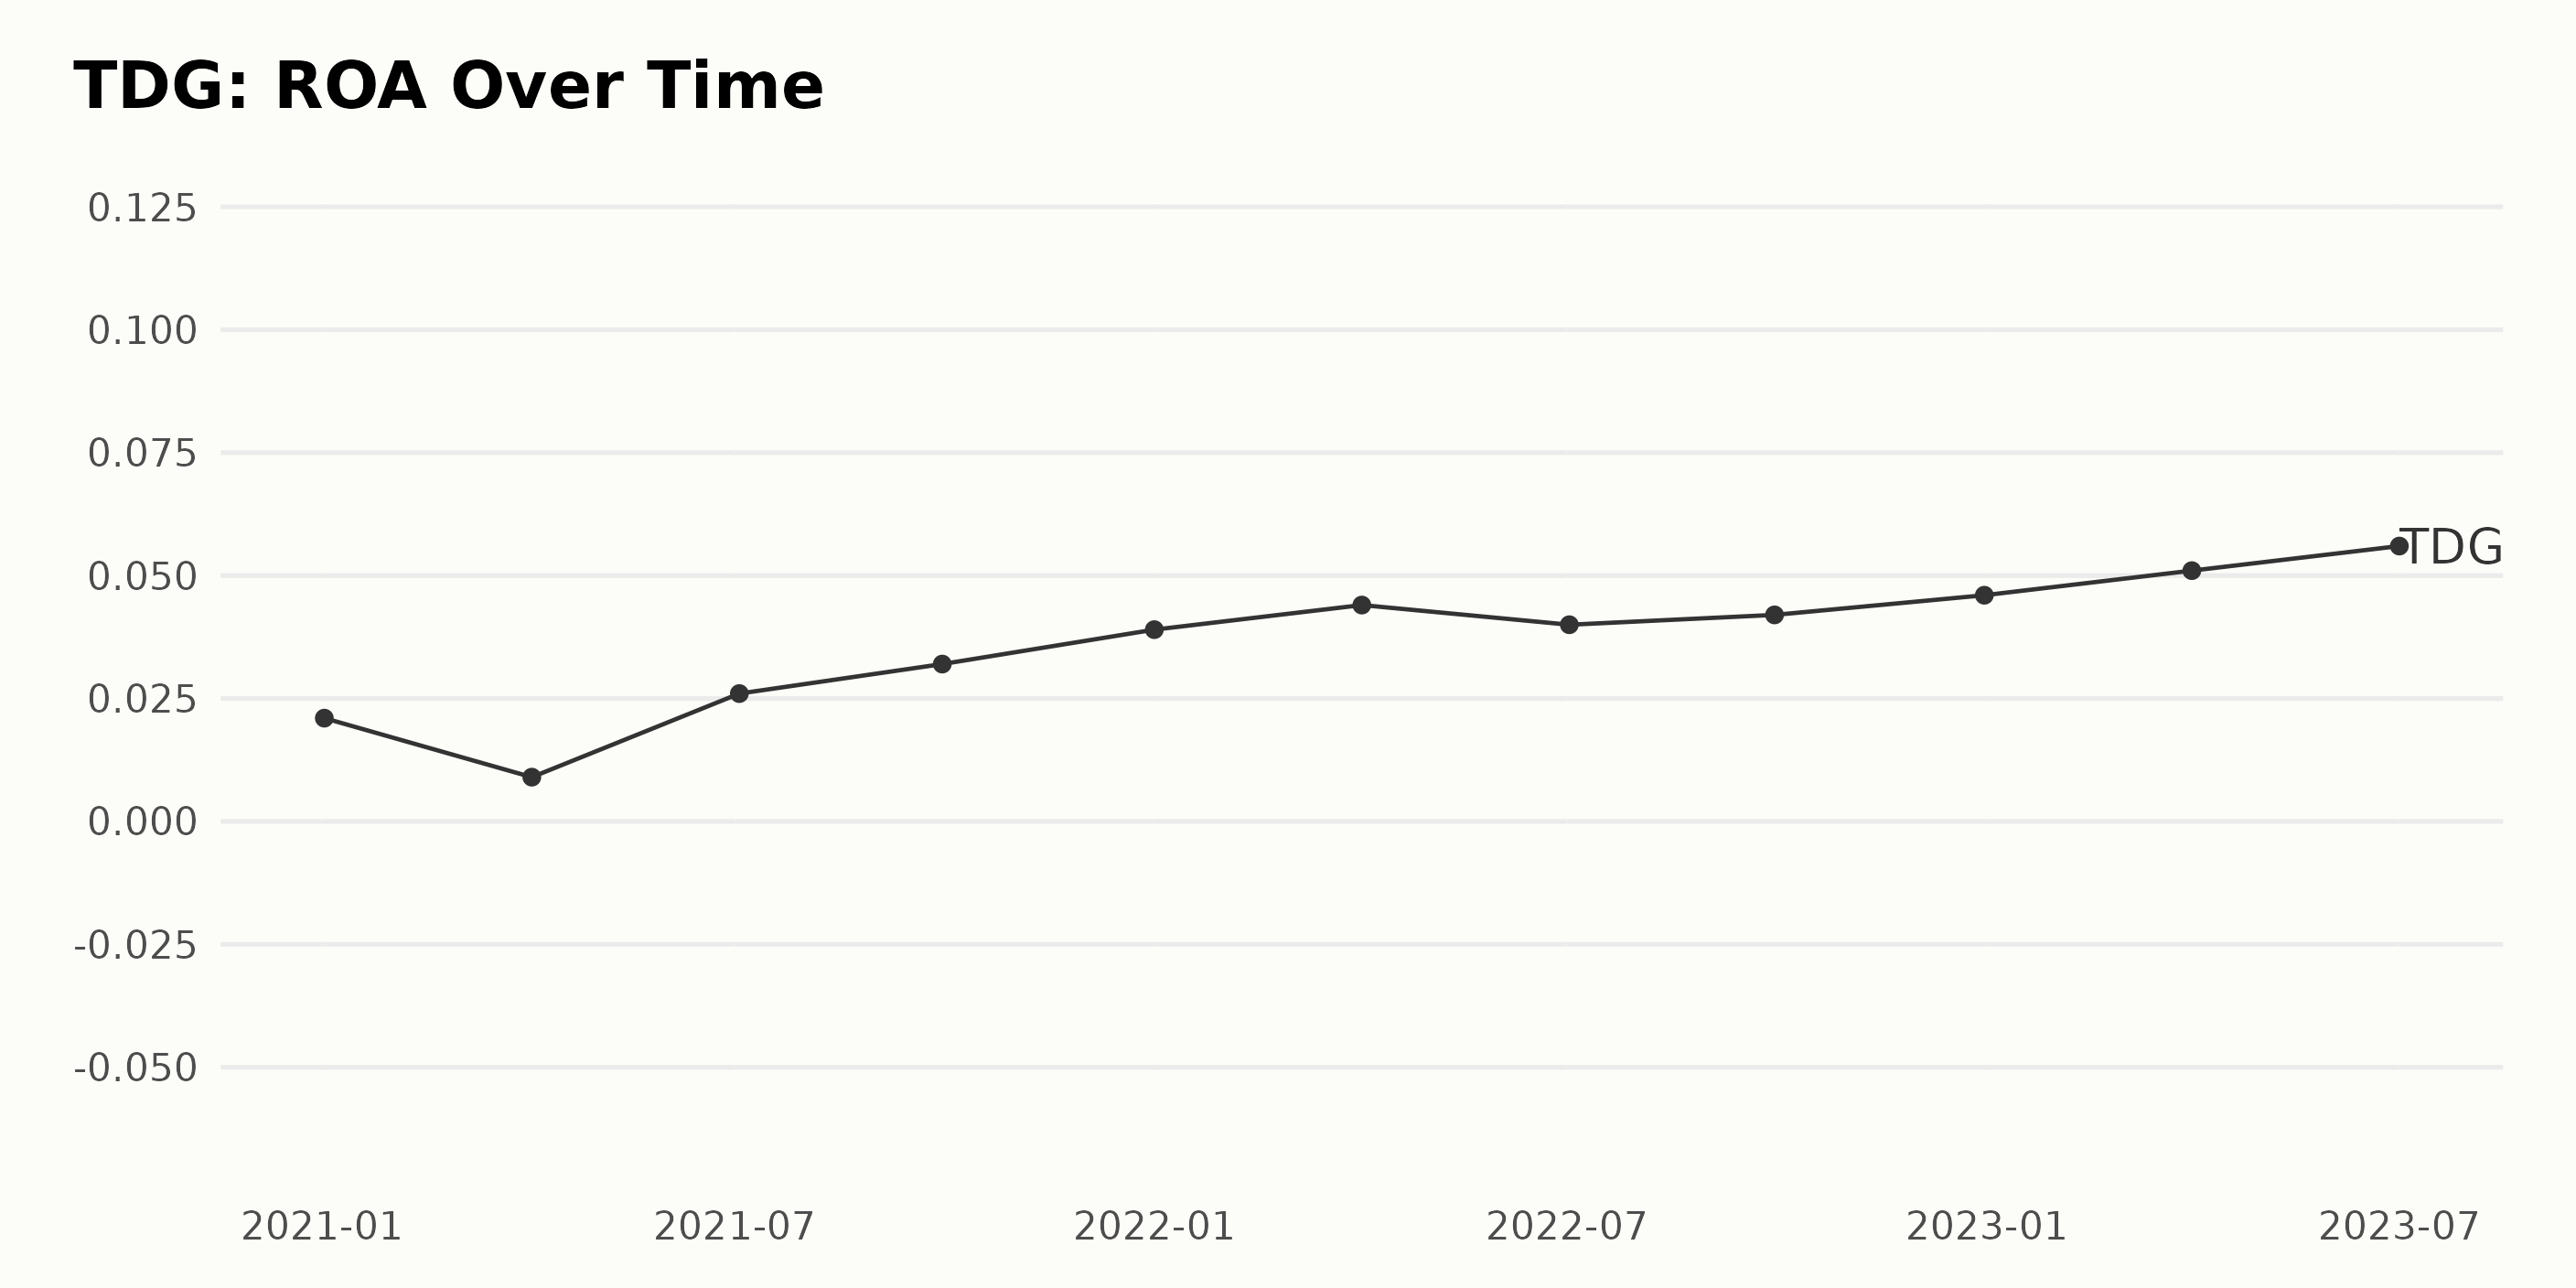
The ROA of TDG has been showing a general upward trend from January 2021 to July 2023, based on the reported data series.
- In January 2021, the ROA started at 2.1%.
- There was a noticeable drop in its value by April 2021 to 0.9%, but this wasn't reflective of the general trend as it bounced back up to 2.6% by July 2021.
- The ROA then gradually grew, reaching its highest value in the series at 5.6% in July 2023.
There are some fluctuations in the data, but overall, the ROA shows growth. The growth rate, measured from the first to the last value in the series, represents a substantial increase of approximately 167% over this time period.
Please note that emphasis has been placed on the more recent data. The most recent reported ROA for TDG, as of July 2023, stands at 5.6%, which indicates a continuing growth trend.
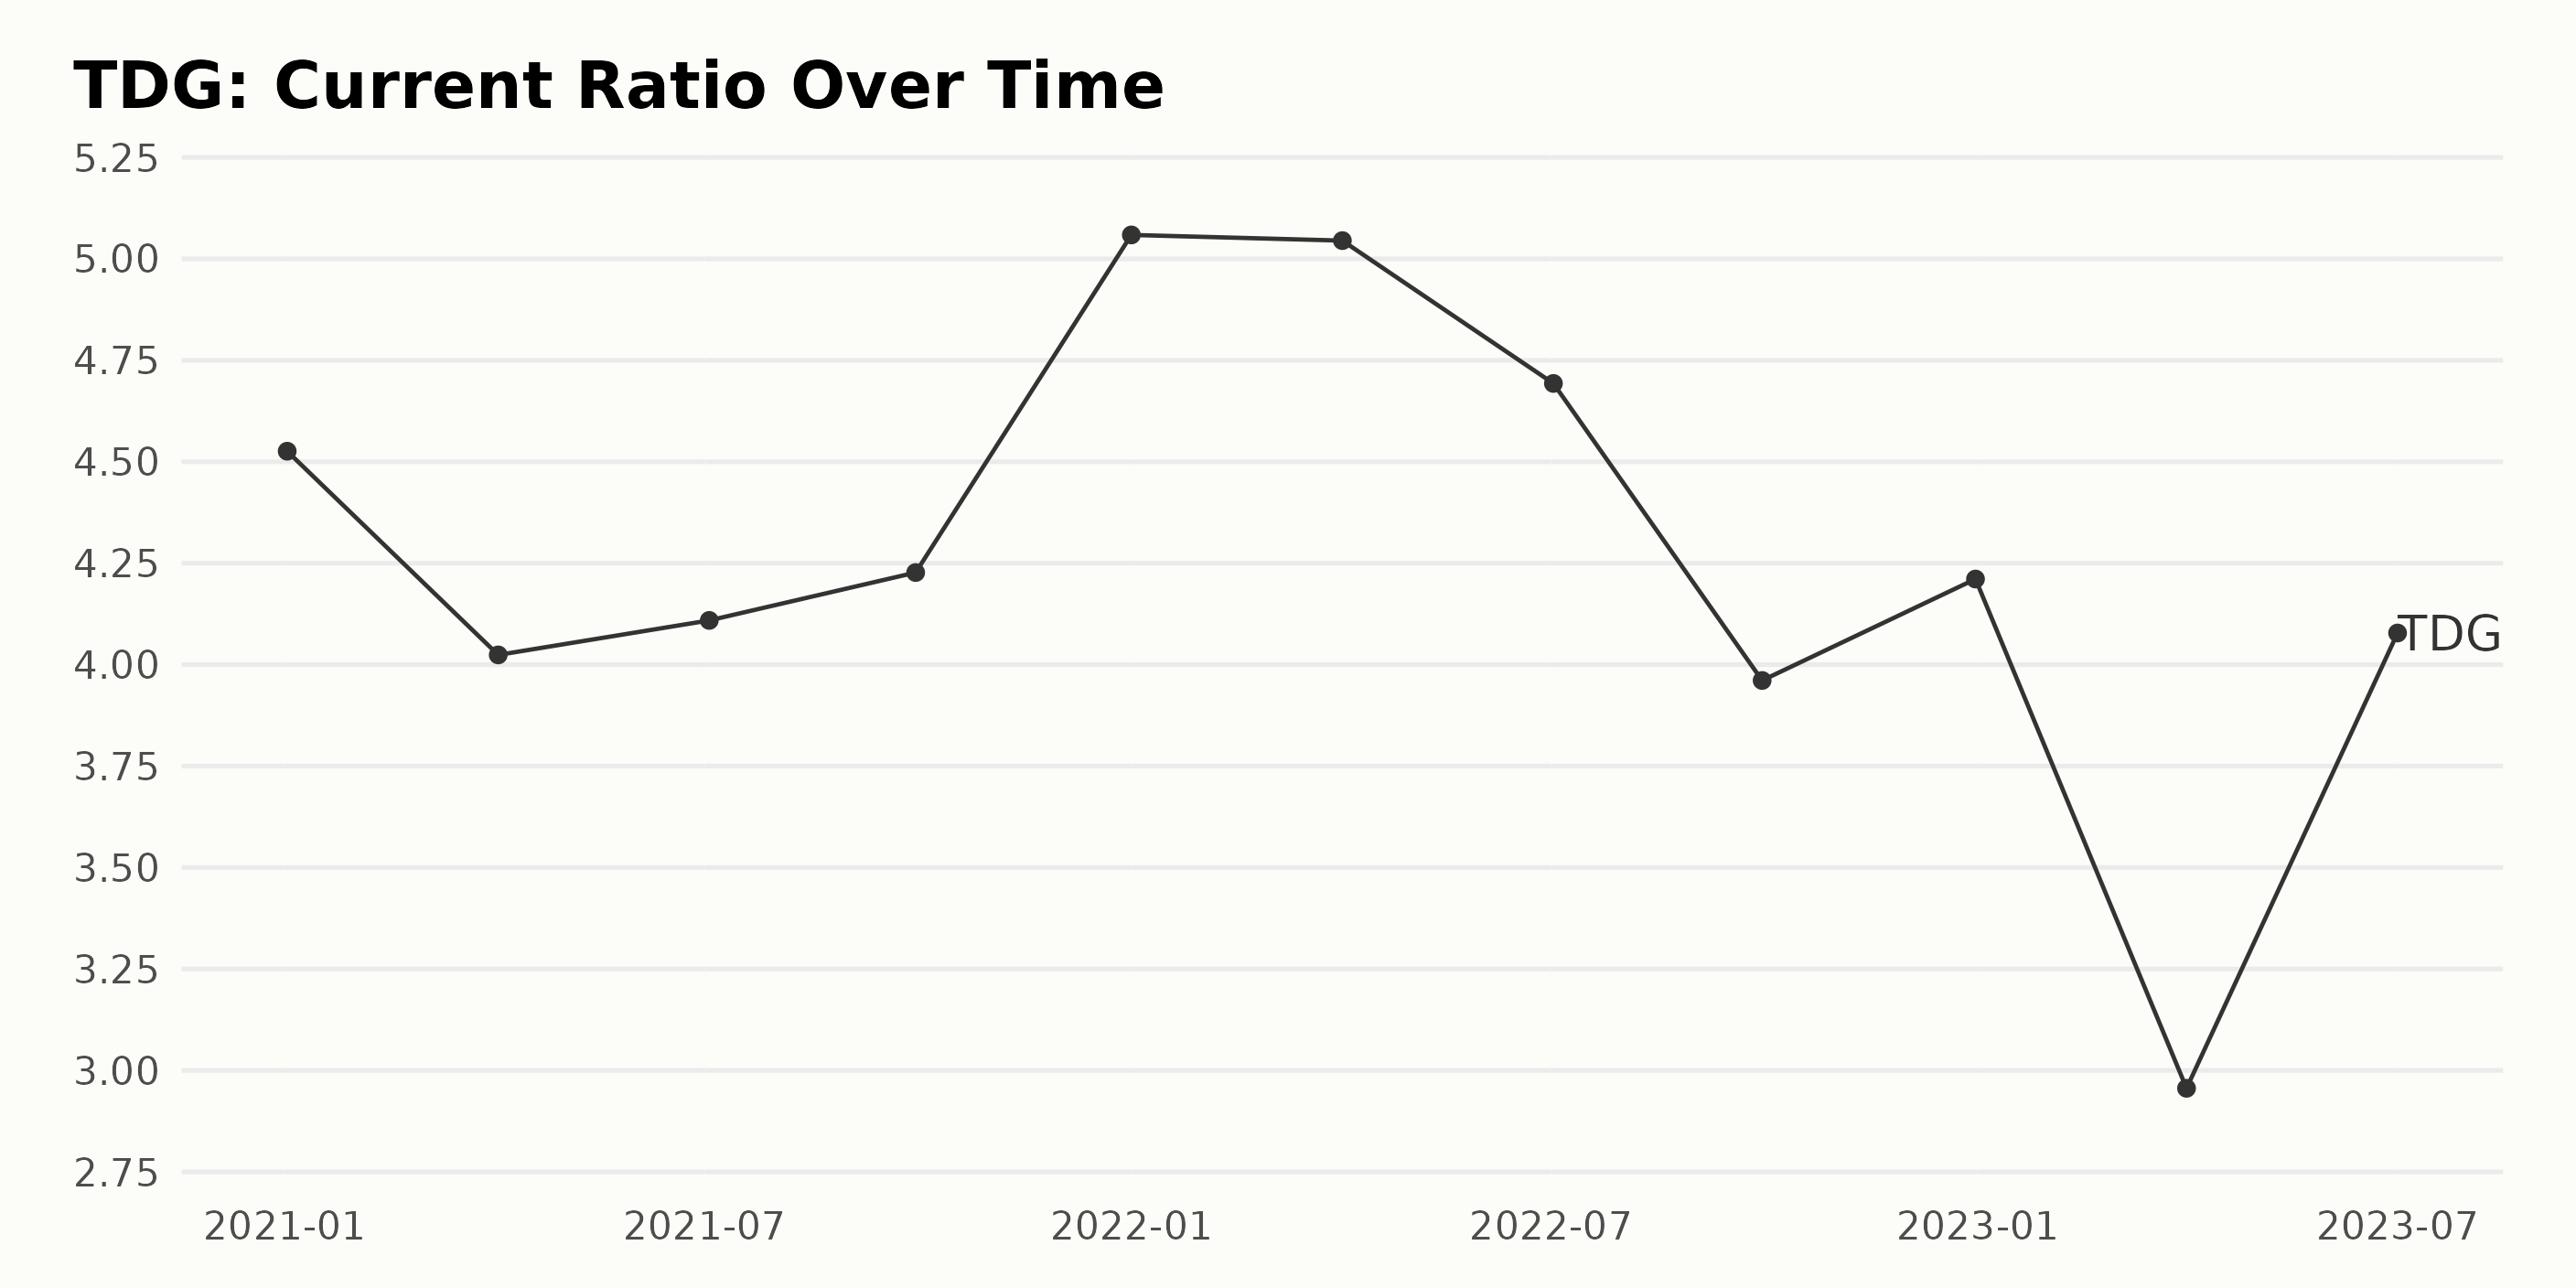
The current ratio of TDG has seen several fluctuations over the period from January 2021 to July 2023. During this timeframe, there have been both uptrends and downtrends in data. Key points:
- January 2021: The current ratio of TDG opened at 4.53.
- April-July 2021: A slight drop was observed, with the current ratio dropping down to 4.02 in April and slightly bouncing back to 4.11 in July.
- September 2021-April 2022: There was an upward momentum, with the value reaching 5.05.
- July-December 2022: It declined again to 3.96 at the end of September before rising slightly to 4.21 by December 2022.
- April-July 2023: The next year witnessed a significant drop to 2.96 in April, followed by a recovery to 4.08 in July 2023.
Despite these fluxes, analyzing overall growth from the first recorded value in January 2021 (4.53) to the recent one in July 2023 (4.08), there is a decrease of approximately -10% in the current ratio of TDG.
This analysis reveals that TDG experienced periods of financial stability as well as some degree of volatility in its current ratio during the assessed period.
Analyzing Six-Month Growth Patterns of Transdigm Group Incorporated Stock
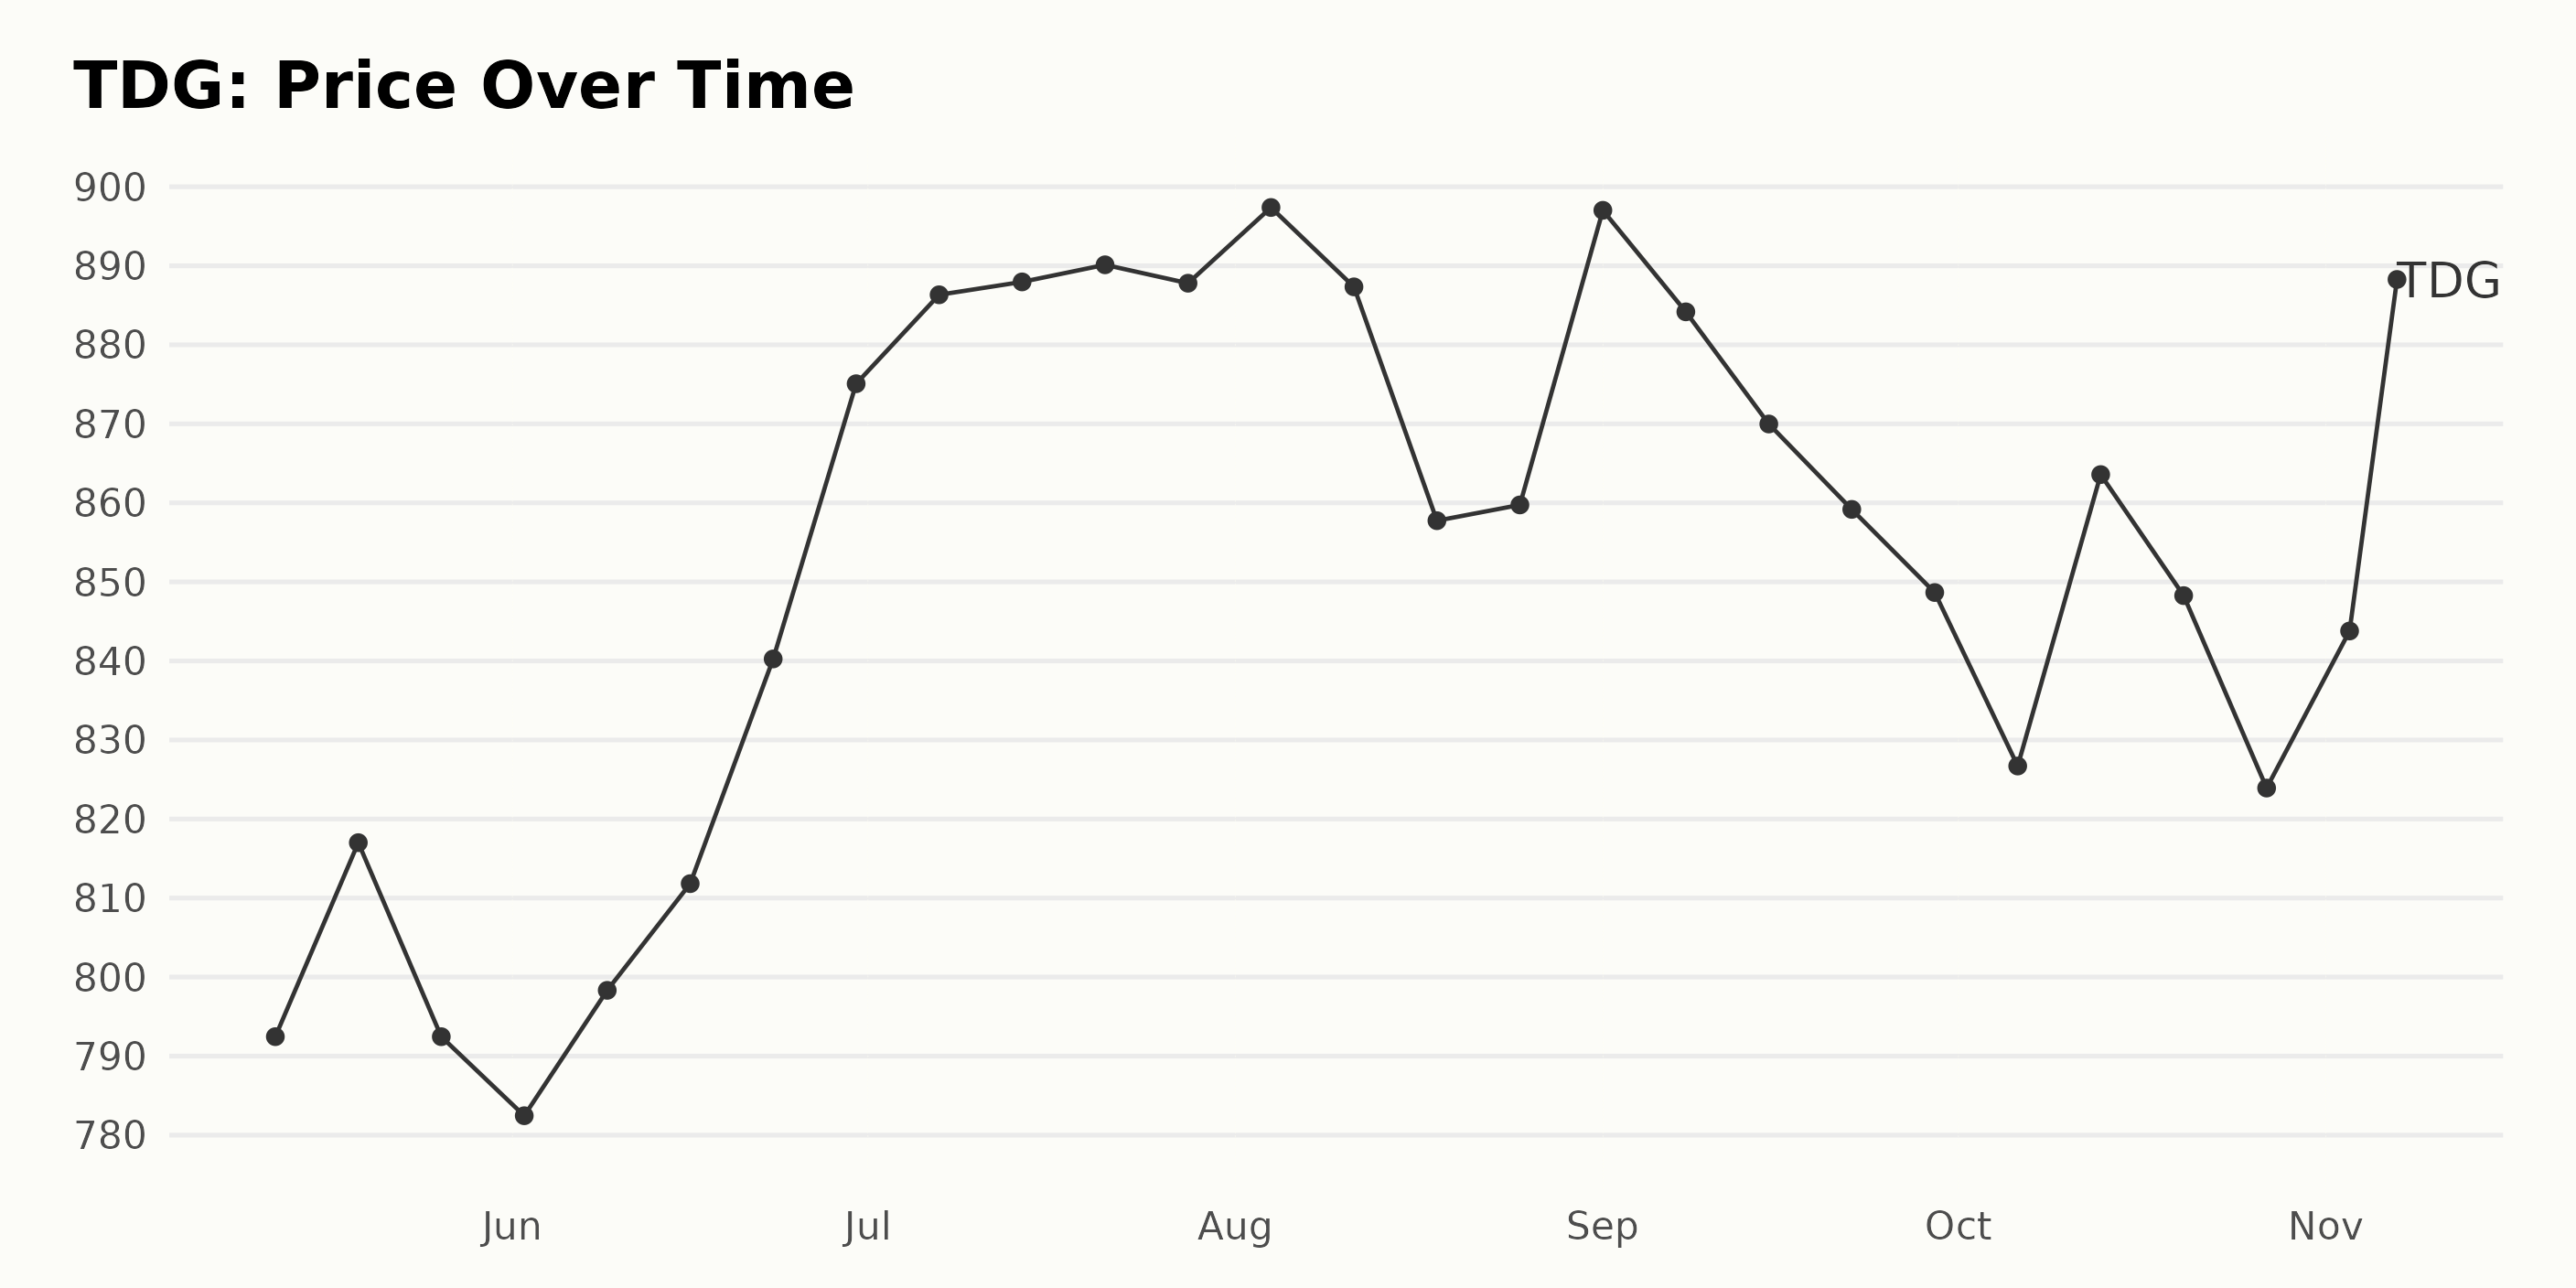
Observing the data for TDG, a distinct growth pattern can be identified throughout the time period from May to November 2023.
- May 12, 2023, exhibited a share price of $792.46.
- The shares experienced a minor bump by May 19, 2023, with an increased price of $817.01. However, the price dipped back to $792.46 by May 26, 2023.
- Starting June 2023, TDG's stock began a notable growth trend. By June 30, 2023, the price had escalated to $875.08.
- In July 2023, the upward momentum continued, ending with a share price of $887.79 on July 28, 2023.
- August 2023 witnessed a fluctuation in the shares, starting at $897.38 on August 4, but later experienced a downturn before slightly increasing again to $859.74 on August 25, 2023.
- In September 2023, the prices fell from $897.02 to $848.66 by September 29, 2023.
- October 2023 displayed a haphazard pattern, with the prices increasing and decreasing between $826.71 and $863.58.
- By November 7, 2023, the stock had rebounded considerably to $892.82.
Approaching this data from a growth rate perspective, it appears TDG experienced an overall increase in share price. The growth wasn't static but involved several peaks and troughs. The most substantial growth was observed from June to July 2023, whereas the biggest drop occurred in August and September 2023.
Generally, the trend accelerated in growth toward the end of each month but decelerated at the beginning of the subsequent month. Here is a chart of TDG's price over the past 180 days.
Assessing Transdigm Group's Growth, Quality, and Momentum Ratings: A 2023 Overview
TDG, which belongs to the Air/Defense Services category of stocks, has a total of 70 stocks. The POWR Ratings Grade for TDG deviated significantly throughout the period from May to November 2023. Here's an insight into the fluctuation over this period:
- May to July 2023: TDG consistently maintained a B (Buy) POWR Grade while varying between ranks #17 and #22 in the category.
- August 2023: Still maintaining a B (Buy) POWR Grade, the rank fluctuated further between #23 and #24.
- First week of September 2023: The POWR Grade dropped to C (Neutral). However, it quickly climbed back to B (Buy) and maintained the grade until the end of the month, with the rank slightly dropping in the category to #25.
- October 2023: The POWR Grade again falls to C (Neutral), with its rank in the category dropping to #29 at one point before rising to #26.
- November 2023: The POWR Grade remains consistent at C (Neutral), with its rank somewhat stabilizing between #24 and #25.
As of the latest recorded data, on November 8, 2023, TDG's POWR Grade stands at C (Neutral), and it is placed #25 in its category, indicating a better rank than earlier in the month.
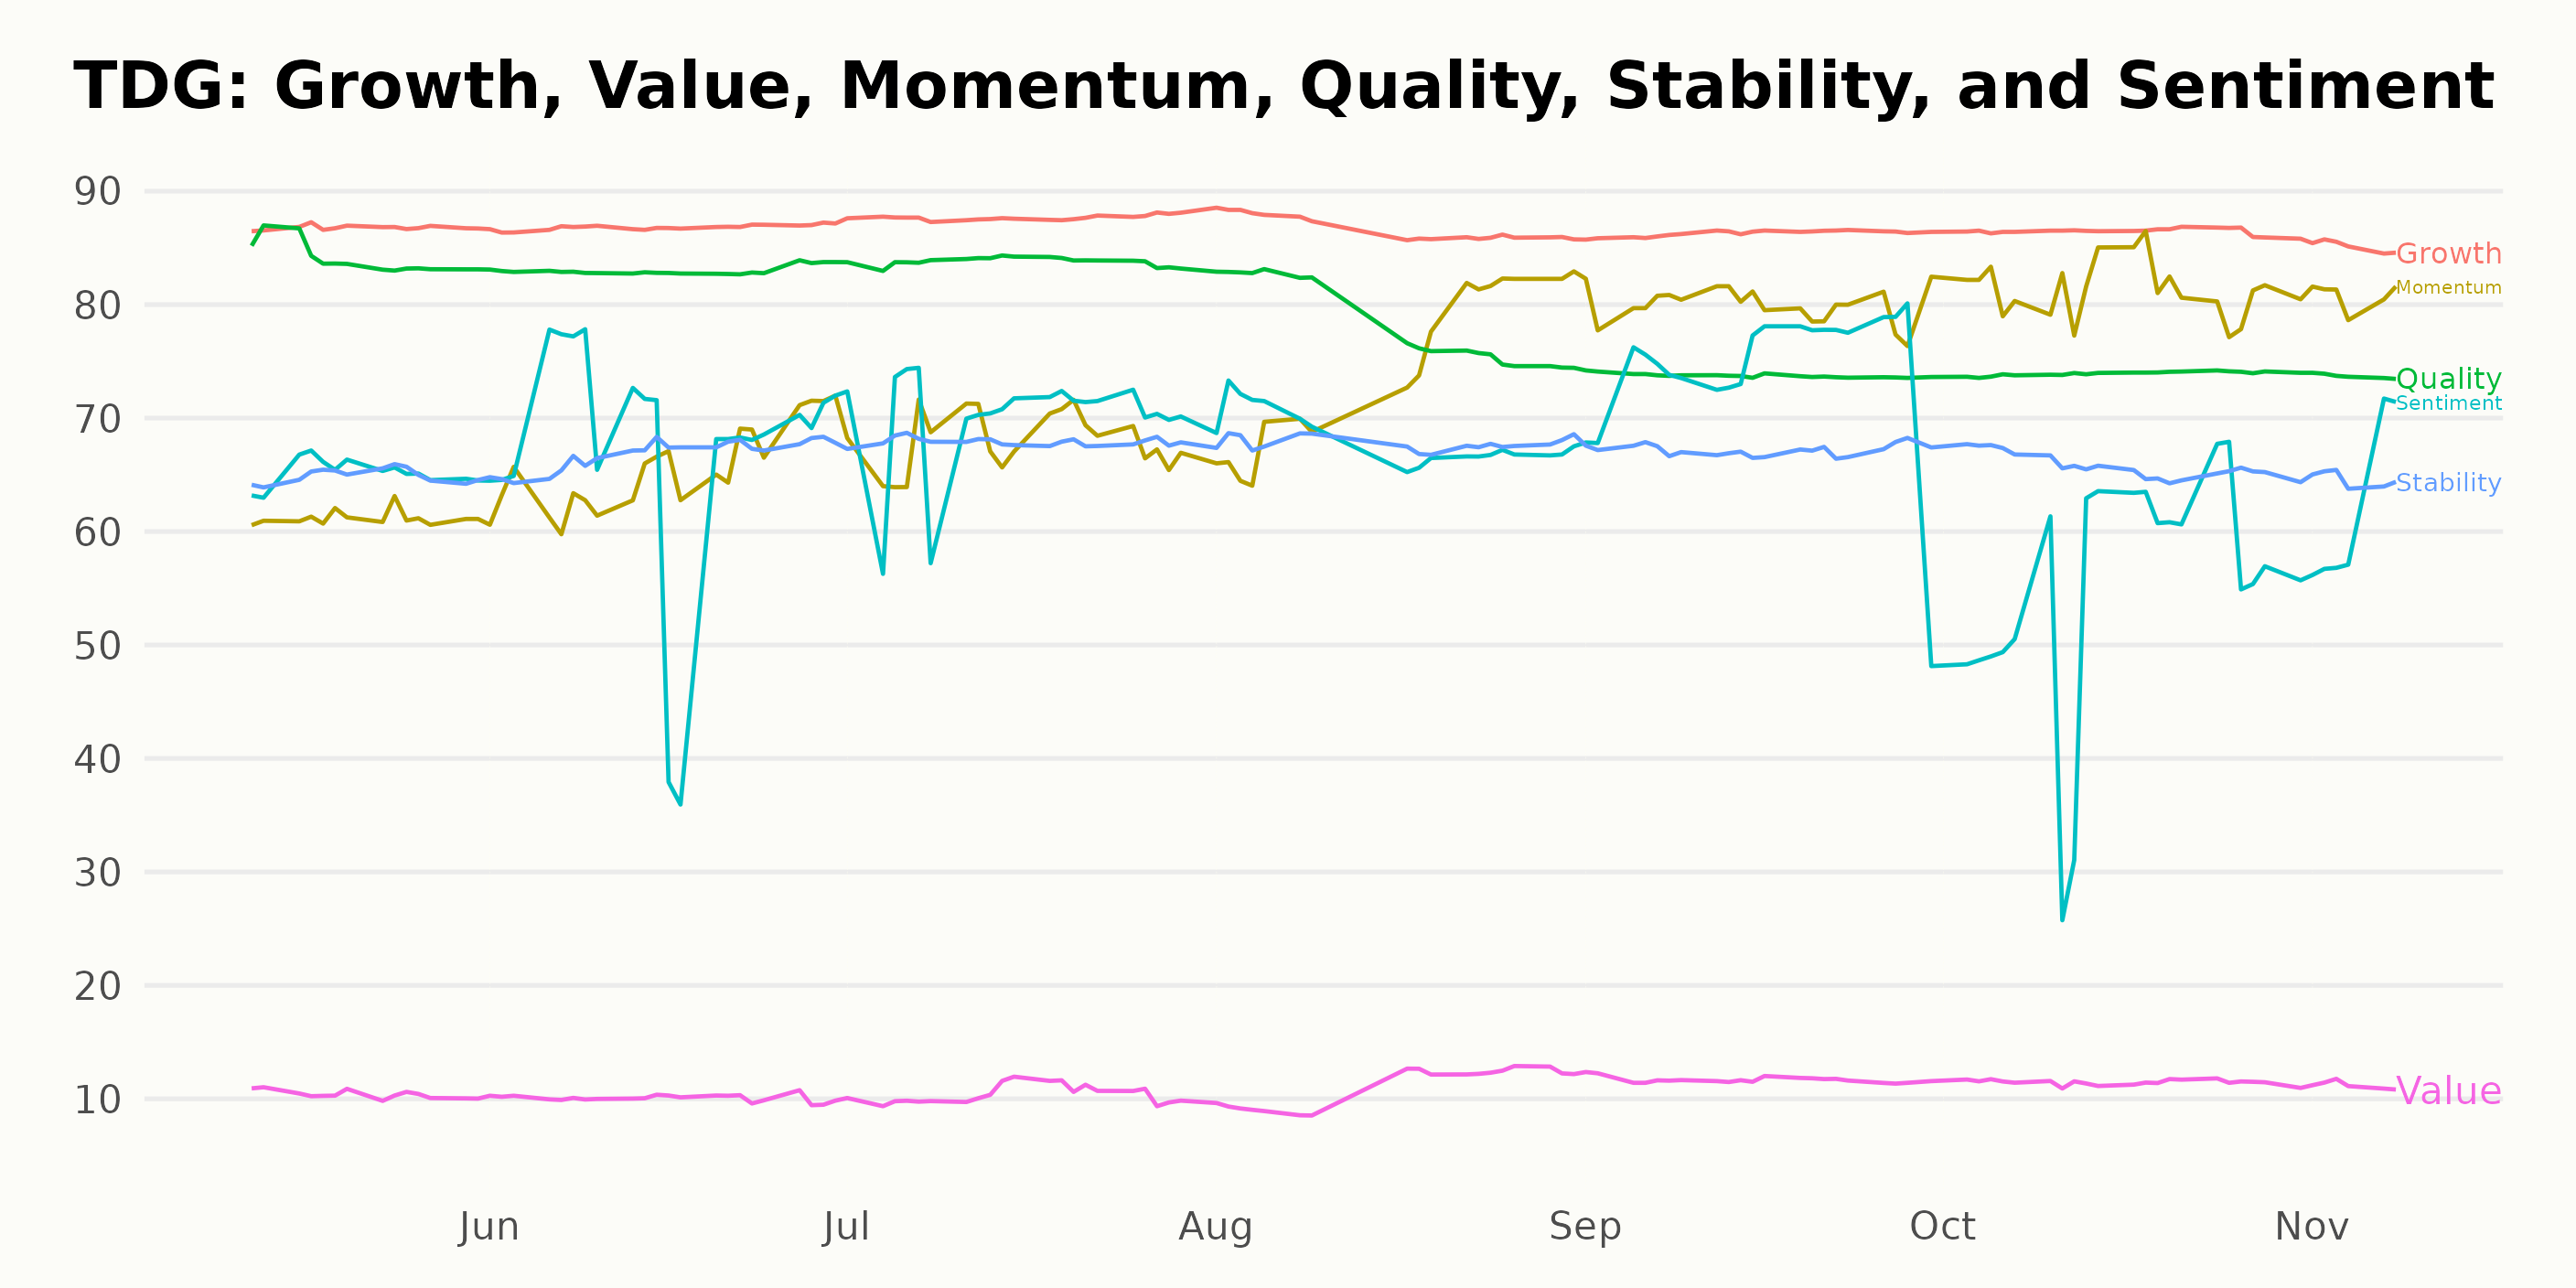
Based on the POWR Ratings, the three most noteworthy dimensions for TDG are Growth, Quality, and Momentum.
Growth
- In May 2023, the rating for the Growth dimension was 87. It remained steady at 87 in June but increased slightly to 88 in July. However, the trend shows a slight decrease to 86 by September and maintained at 85 in November 2023.
Quality
- The rating of the Quality dimension started high at 84 in May 2023. It slightly decreased to 83 in June and somewhat rose to 84 in July before a notable drop to 74 by September, which it sustained through November 2023.
Momentum
- Initially, in May 2023, the Momentum dimension was moderately rated at 61. The rating progressively climbed each month, reaching 81 by October 2023. It remained consistent at that score in November 2023, showcasing a clear and strong upward trend over this period.
Across these three dimensions, there were clear trends notable in both the Quality and Momentum dimensions over the time frame from May 2023 to November 2023. While the Growth dimension remained relatively steady throughout, with slight fluctuations, the Momentum dimension demonstrated significant growth. Conversely, the Quality dimension showed a downward trend.
How Does Transdigm Group Incorporated (TDG) Stack Up Against its Peers?
Other stocks in the Air/Defense Services sector that may be worth considering are CPI Aerostructures, Inc. (CVU), Textron Inc. (TXT), and Willis Lease Finance Corporation (WLFC) - they have better POWR Ratings. Click here to explore more Air/Defense Services stocks.
What To Do Next?
Discover 10 widely held stocks that our proprietary model shows have tremendous downside potential. Please make sure none of these “death trap” stocks are lurking in your portfolio:
TDG shares were trading at $892.31 per share on Wednesday afternoon, down $0.51 (-0.06%). Year-to-date, TDG has gained 41.72%, versus a 15.40% rise in the benchmark S&P 500 index during the same period.
About the Author: Anushka Dutta

Anushka is an analyst whose interest in understanding the impact of broader economic changes on financial markets motivated her to pursue a career in investment research.
The post TransDigm Group (TDG) Earnings Anticipation: Buy or Sell? appeared first on StockNews.com