


The undisputed leader in the Electric Vehicle (EV) industry, Tesla, Inc. (TSLA), is striving toward further technological breakthroughs that could help the company reach its CEO’s aim of cutting production costs in half. In addition to its pioneering gigacasting process, the new development of die-cast nearly all the complex underbody of an EV in one piece could drastically elevate its production process.
In addition to that, more and more automakers are signing up for TSLA’s EV-charging infrastructure, making the company’s superchargers close to being the industry average across the United States.
On the other hand, TSLA could come under regulatory pressures in the near term. Earlier this month, the European Union (EU) kicked off a subsidy investigation on China, under which non-Chinese EV-makers like TSLA could be examined.
Wall Street analysts forecasted the company to miss its third-quarter deliveries due to planned factory shutdowns and weak demand. According to an average of 11 analysts' estimates compiled by LSEG, TSLA would put out between 439,200 and 455,000 vehicles this quarter, below the overall Wall Street expectation of 458,713.
Against this backdrop, let’s look at the trends of TSLA’s key financial metrics to understand why it could be wise to watch and wait for a better entry point in the stock.
Tesla's Financial Analysis: Unpacking Trends in Profitability and Financial Ratios (2020-2023)
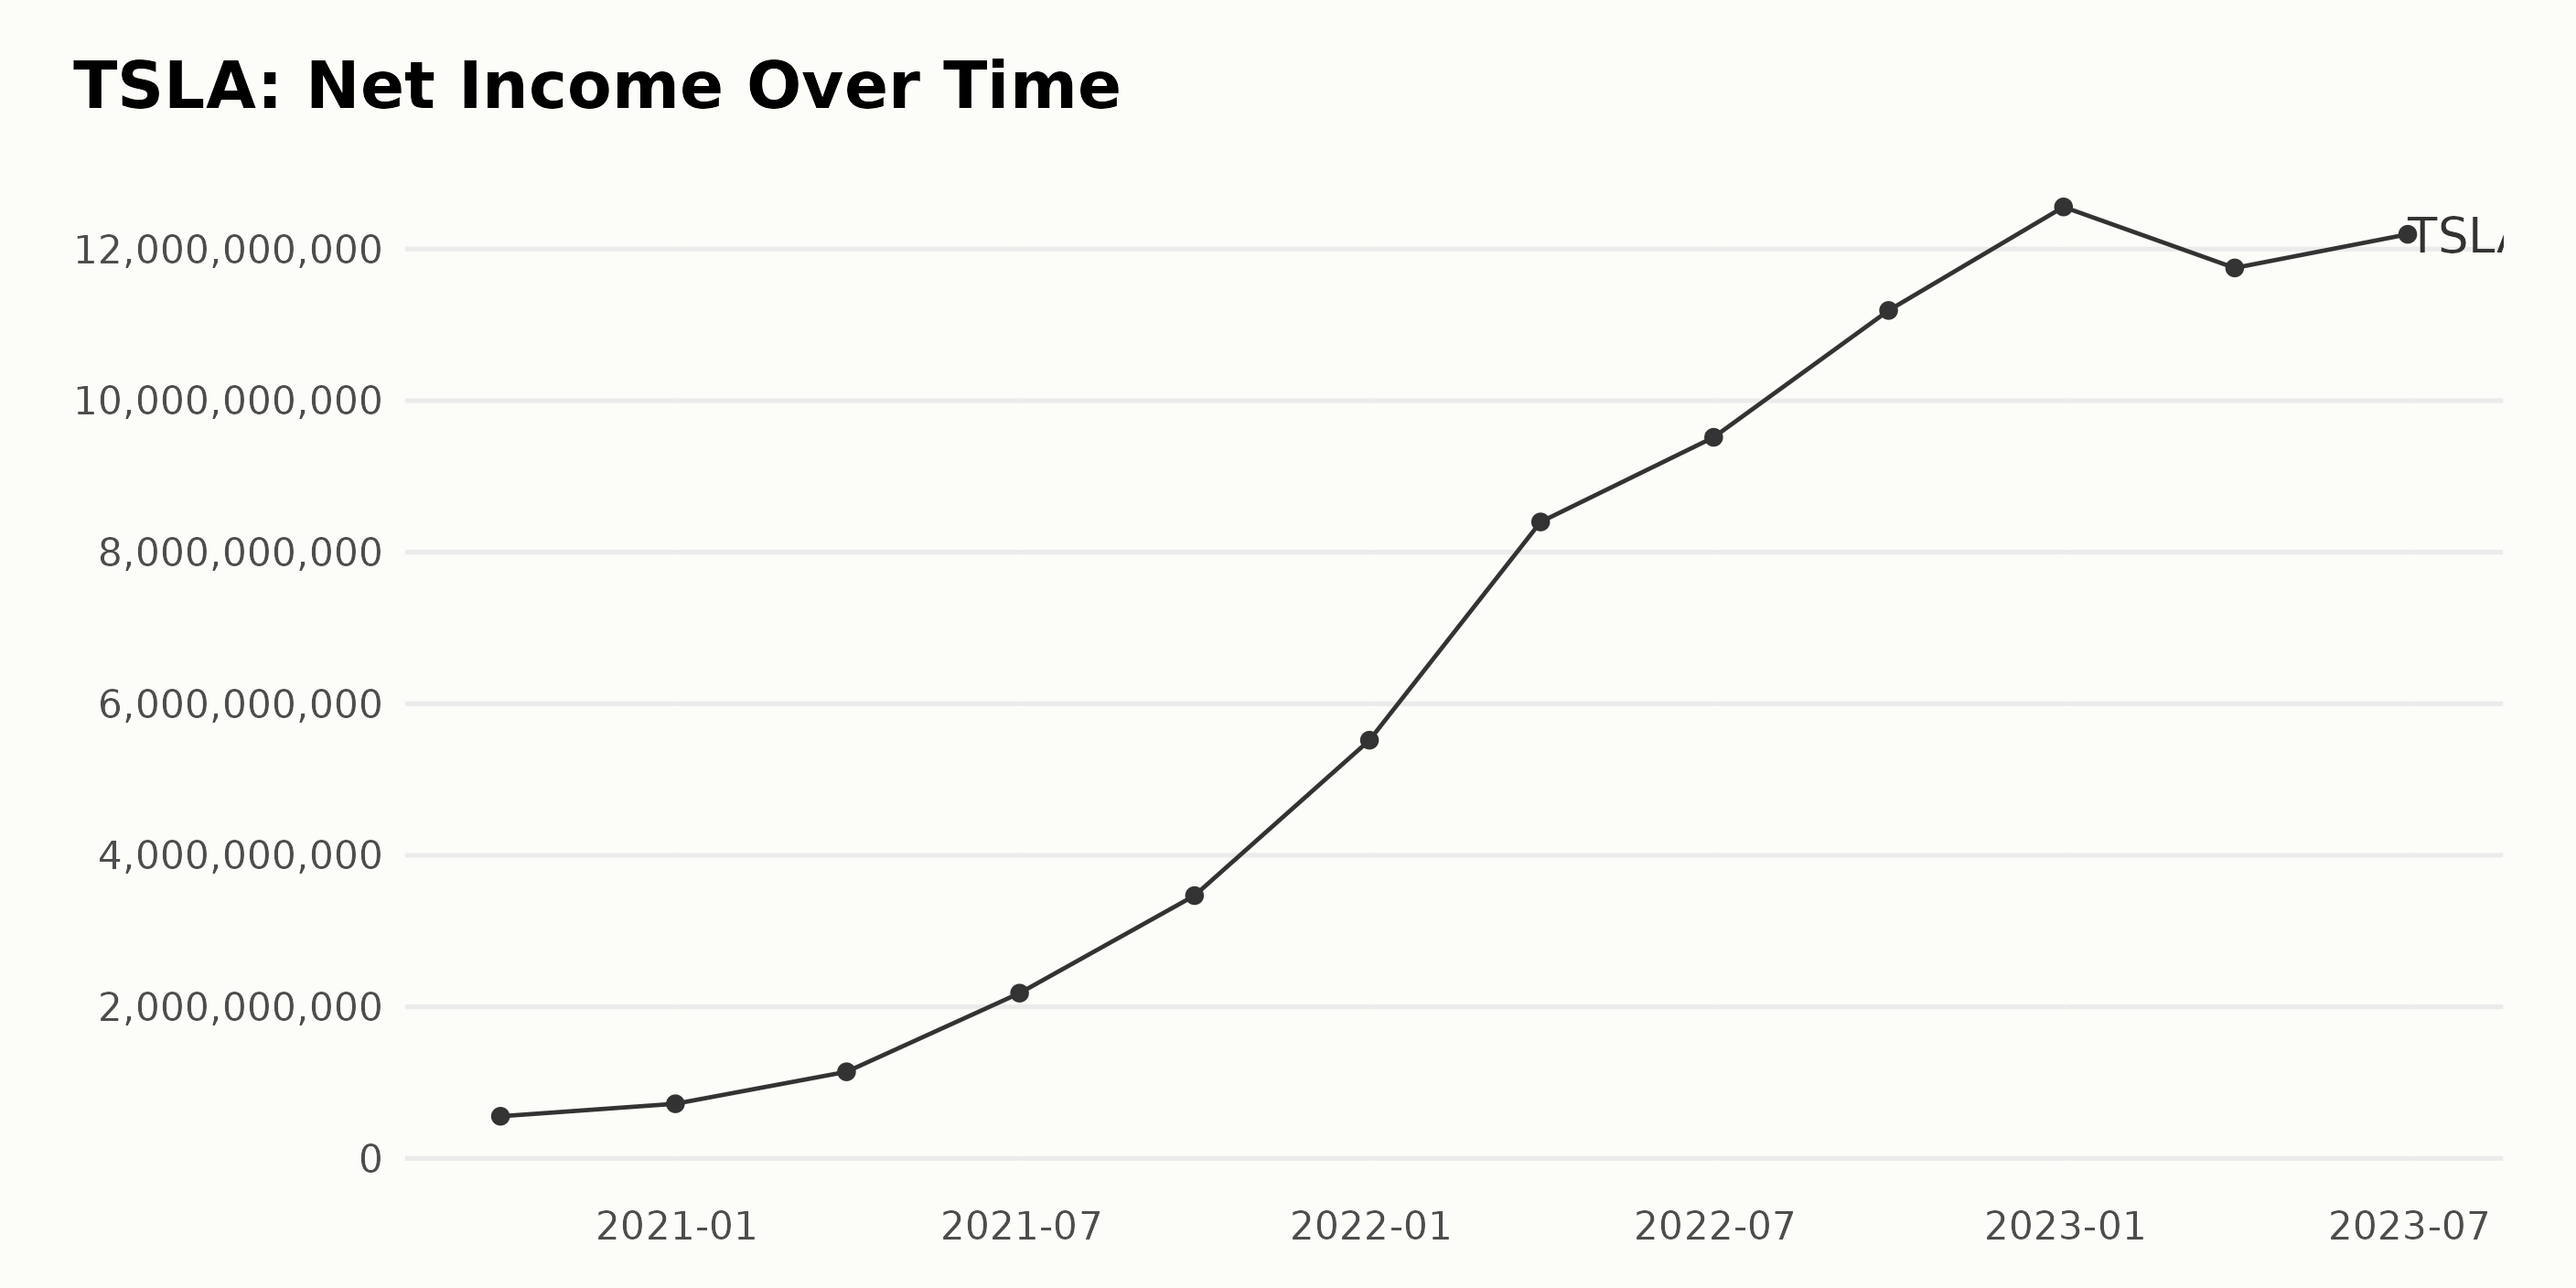
The historical trend of trailing-12-month net income for TSLA shows a significant upward trajectory from September 2020 onwards.
- On September 30, 2020, TSLA posted a net income of $556 million.
- By the end of 2020 (December 31), this figure had increased to $721 million.
- Ongoing growth was witnessed throughout 2021, with values reported at $1.14 billion in March, $2.18 billion in June, $3.47 billion in September, and $5.52 billion by year-end in December.
- The growth trend continued into 2022, hitting new heights at $8.4 billion by the end of March, $9.52 billion by the end of June, $11.19 billion by the end of September, and reaching $12.56 billion by the close of the year on December 31.
- However, a slight decline was noted in the first quarter of 2023, with net income decreasing to $11.75 billion on March 31. The following quarter (June 30) saw a bit of recovery, pushing up to $12.20 billion.
When comparing the first recorded value ($556 million on September 30, 2020) with the most recent ($12.2 billion on June 30, 2023), a substantial growth rate can be observed. This implies a successful and expanding profitability trend for TSLA despite some fluctuations. Even with periodic variance, the general direction over this period has been decidedly upward.
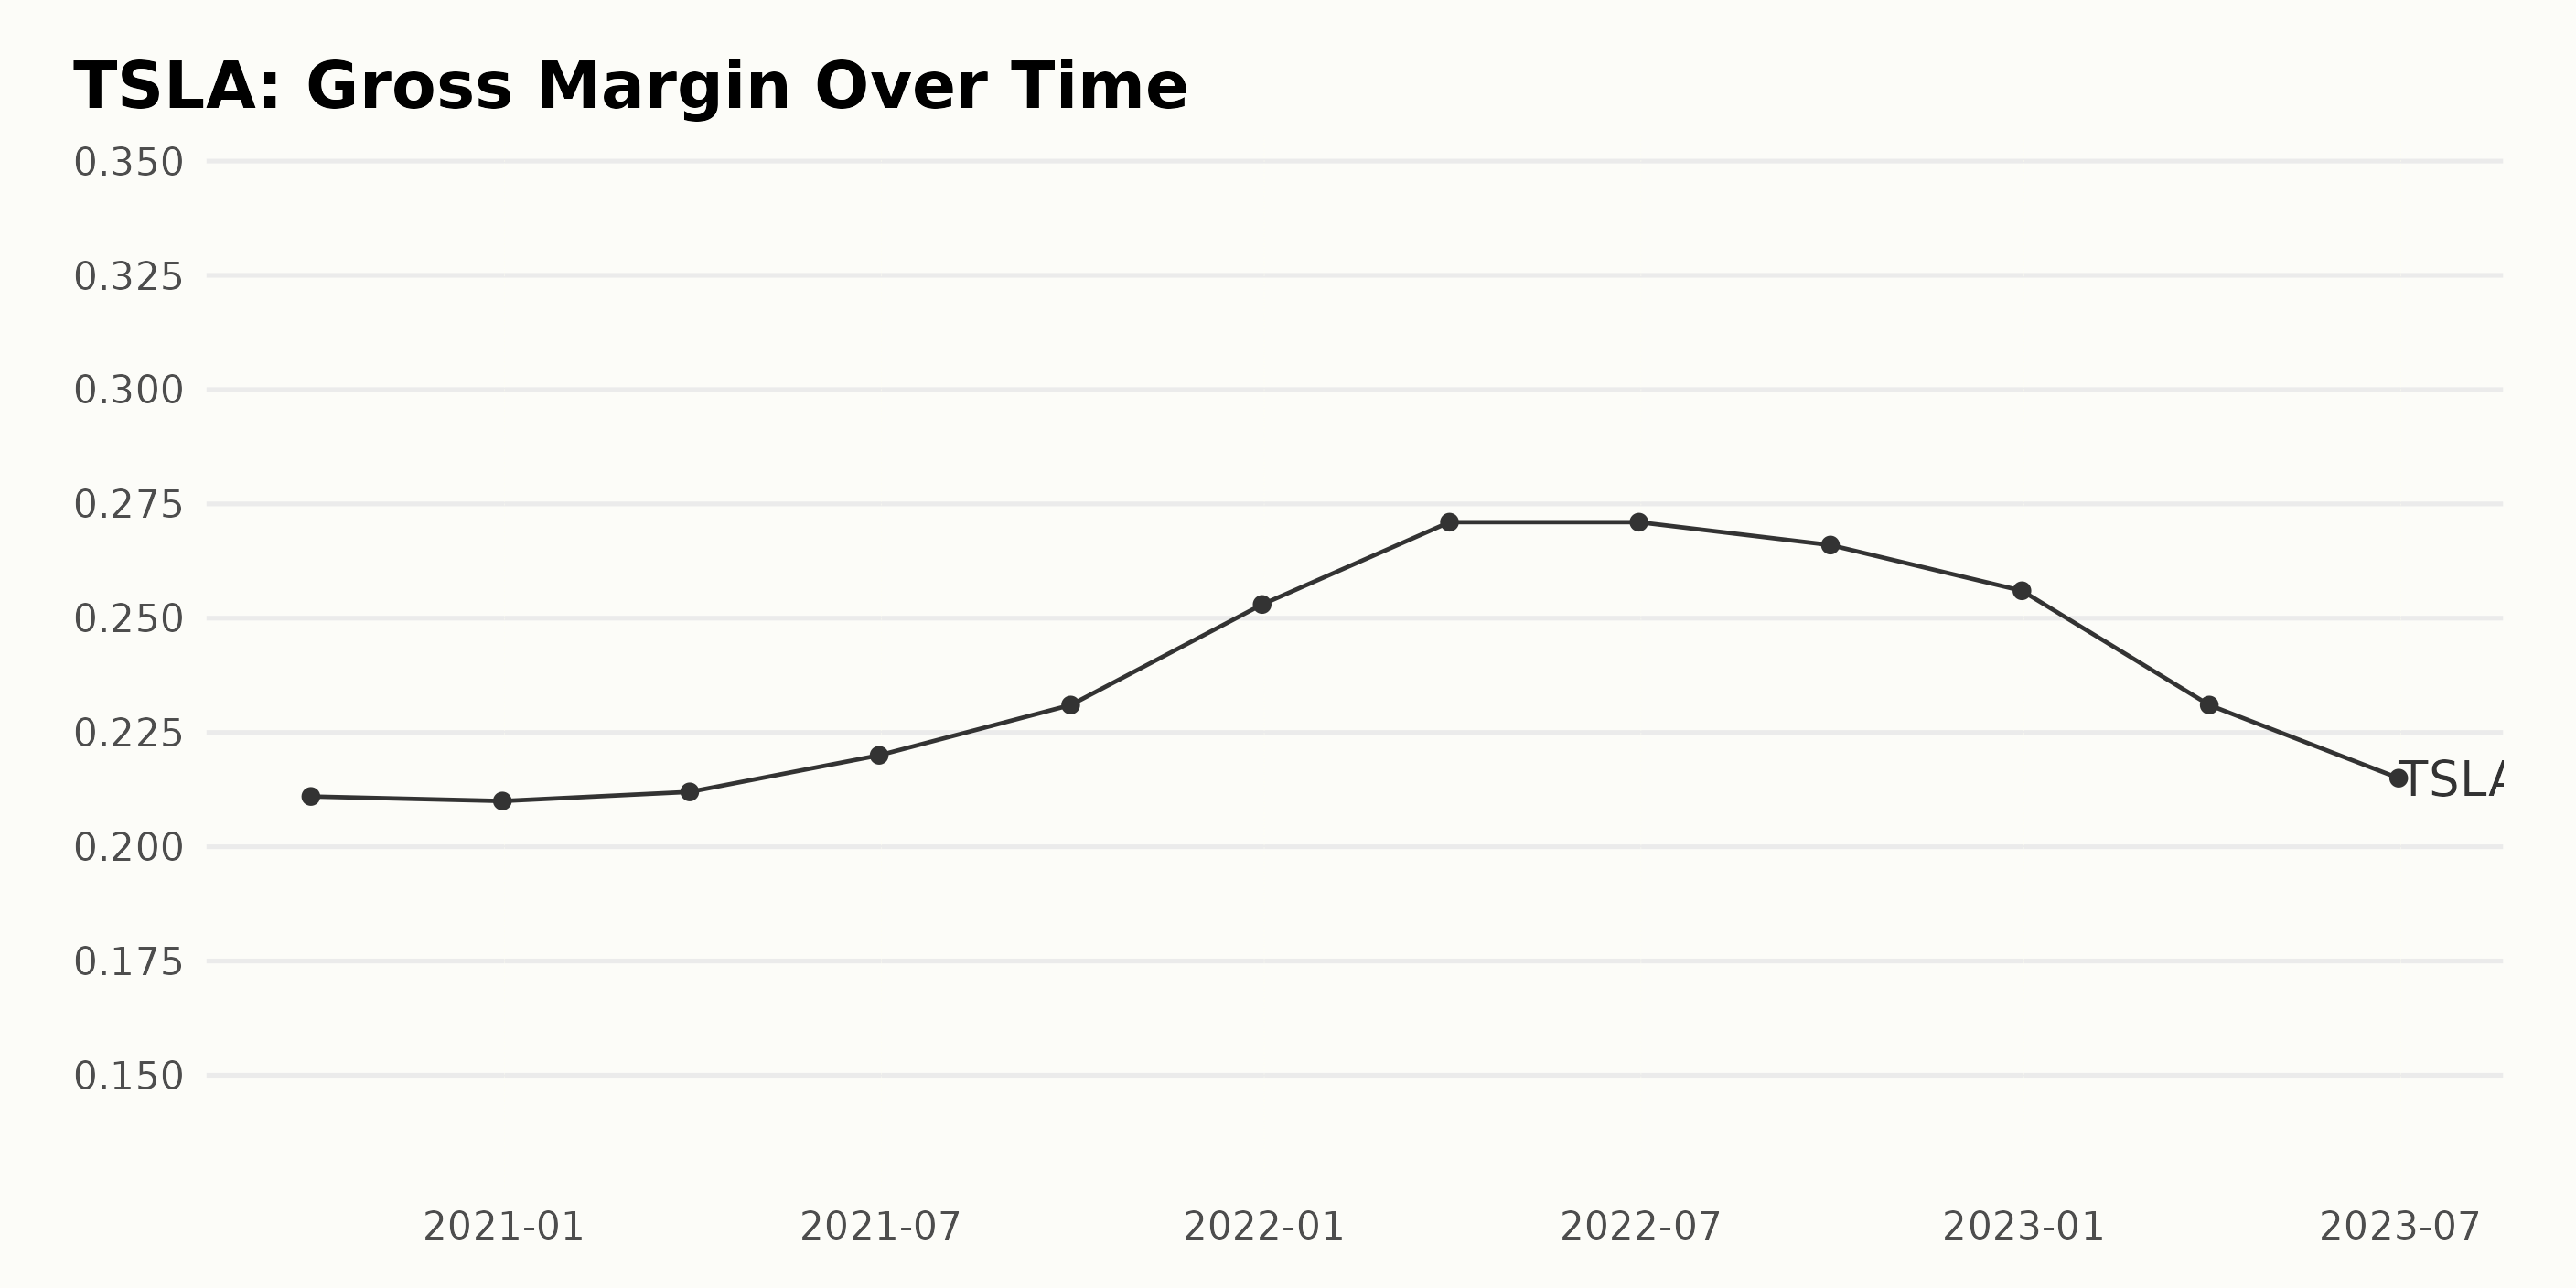
TSLA’s gross margin has seen a steady rise and fall in its trend over time, with noticeable fluctuations. It was recorded at 21.1% on September 30, 2020, and since then, it has shown an upward trend until the end of 2022.
Notably, from December 31, 2021, to December 31, 2022, the gross margin value increased from 25.3% to 27.1%, representing a significant growth period. Despite reaching its peak at 27.1% in June 2022, the gross margin saw a decline in the subsequent quarters. By the end of 2022, it had dropped to 25.6% and continued this downward trajectory into 2023, hitting 21.5% in June 2023.
When comparing the first and the last value, the company's gross margin grew by 0.4% between September 2020 and June 2023. To summarize, here are the key points:
- Gross margin was at 21.1% in September 2020.
- It reached its highest at 27.1% in June 2022.
- By the end of 2022, the gross margin dropped to 25.6%.
- As of June 2023, the gross margin reached 21.5% again, showing a decrease from its peak.
- The overall growth rate between the first and the last measurement was about 0.4%.
In light of these figures, while TSLA experienced periods of appreciable margin growth, there also were times of decline, suggesting possible instability and the presence of adverse factors influencing these trends.
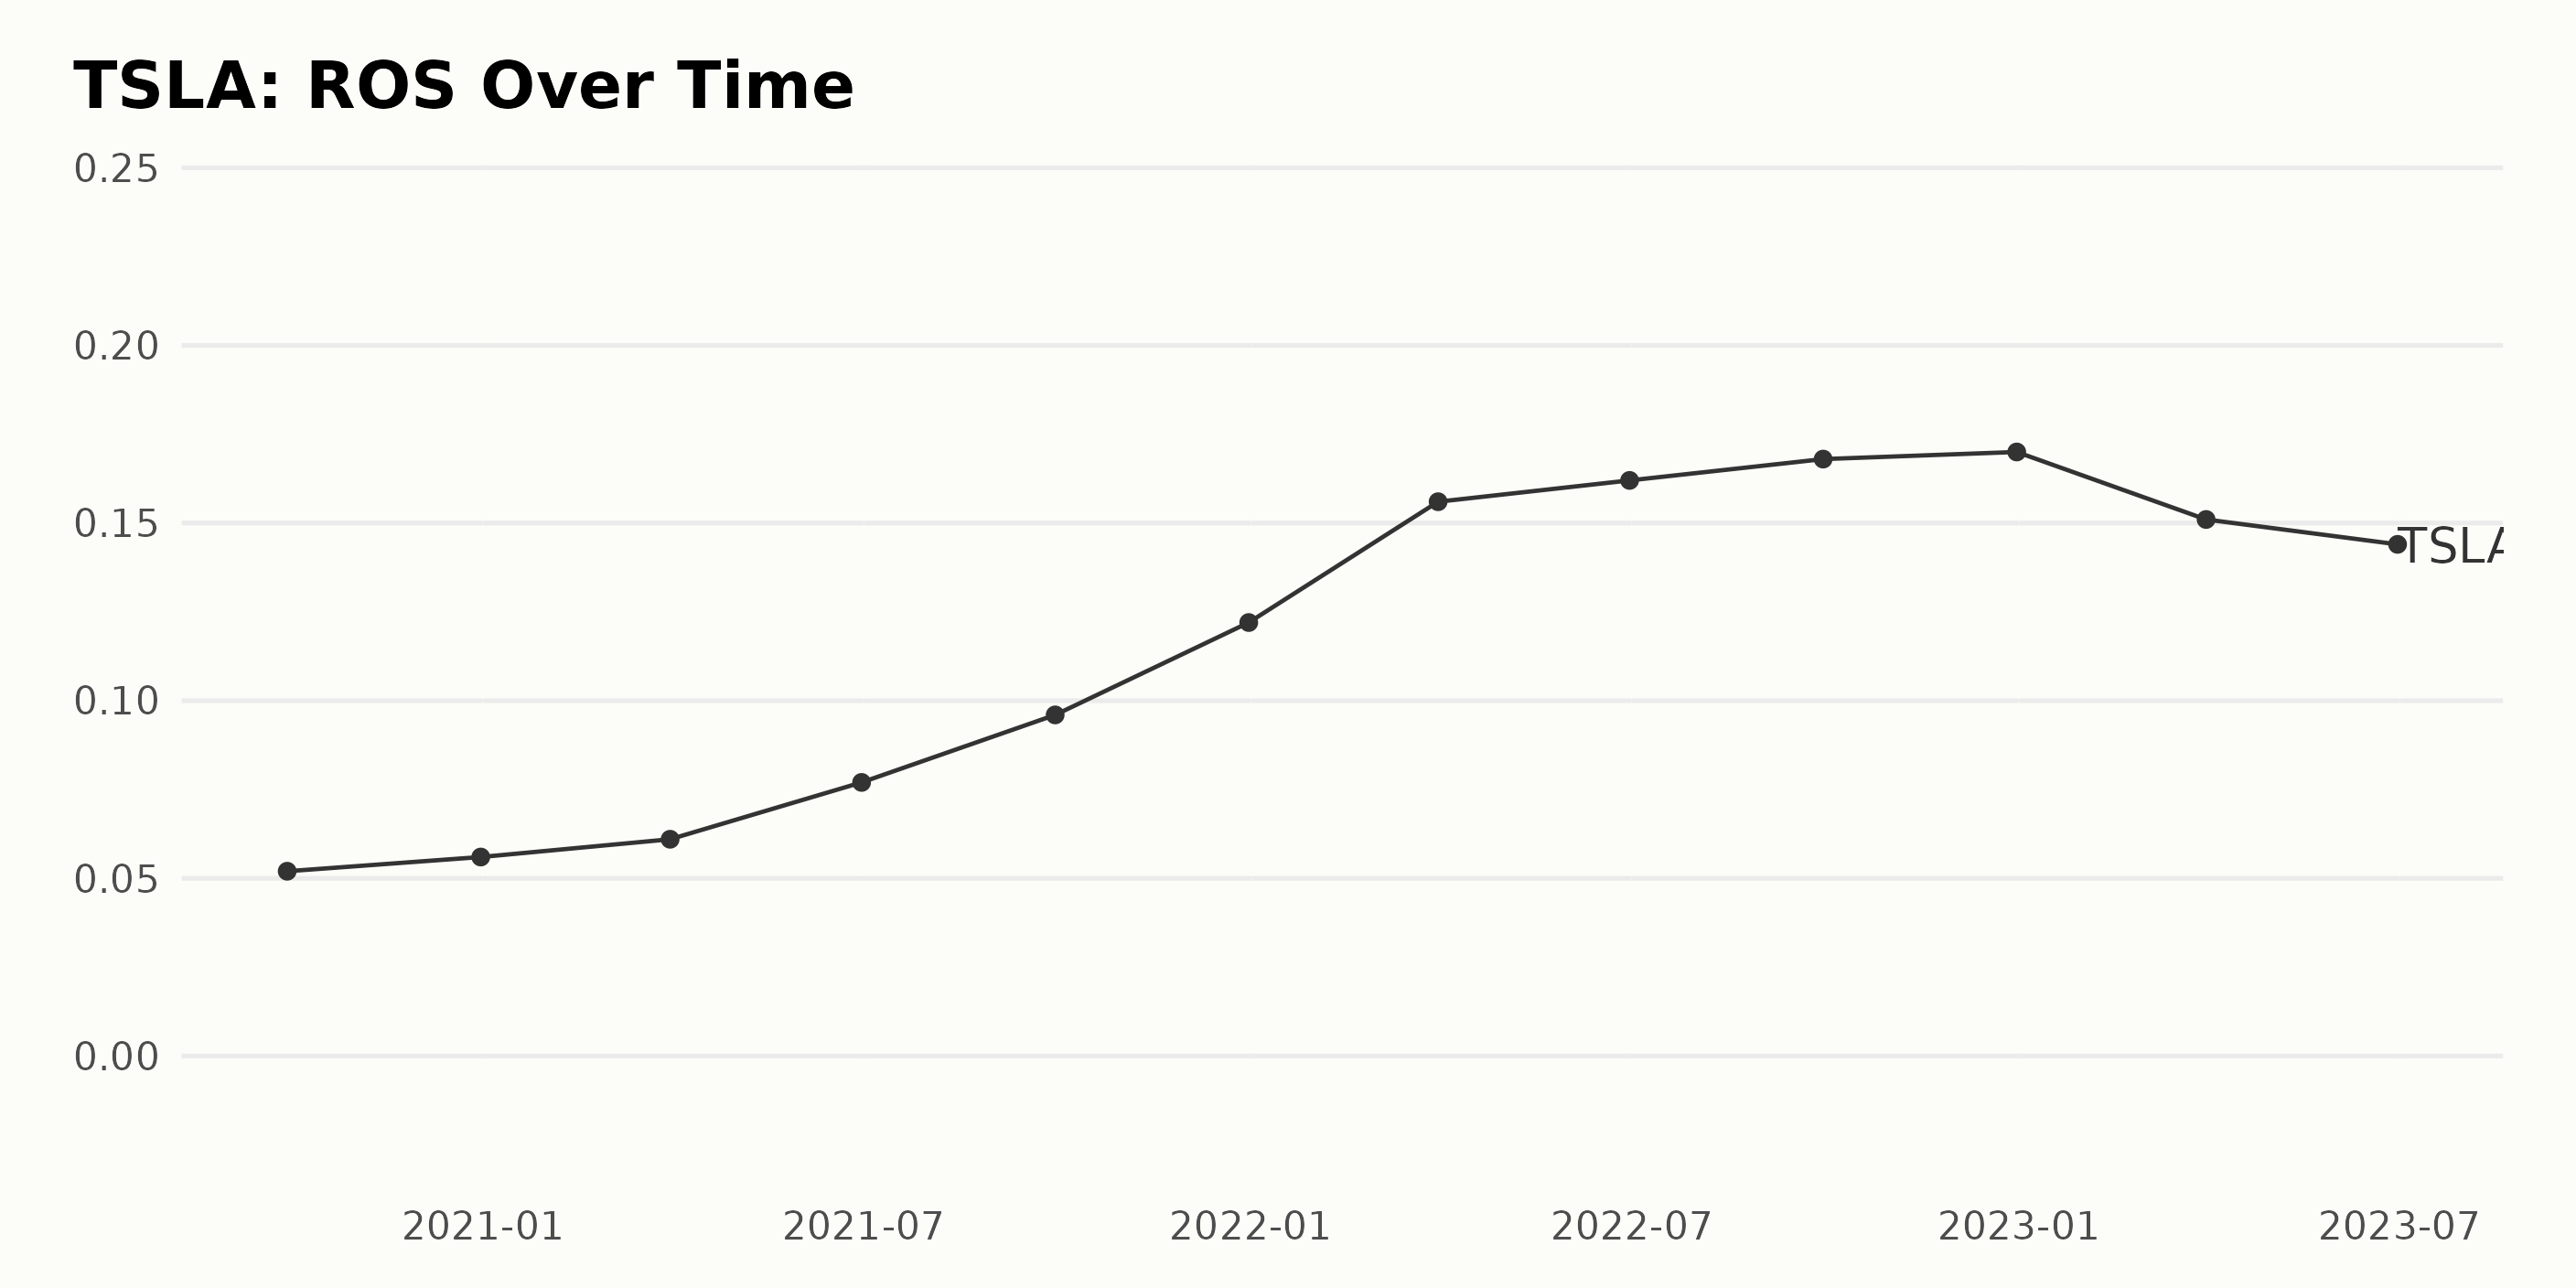
In analyzing TSLA Return On Sales (ROS) over the indicated time period, from September 2020 through June 2023, the ROS shows a general trend of rise with fluctuations.
- As of September 30, 2020, the company's ROS was 0.052.
- It rose slightly to 0.056 by the end of December 2020.
- In 2021, TSLA experienced a steady growth rate in ROS, starting the year at 0.061 (March) and ending at 0.122 (December), almost doubling its figure.
- Through 2022, despite slight variations, ROS kept growing to 0.17 by December 31, 2022, an increase from March's ROS of 0.156.
- However, more recent data from 2023 show a decline. By March 31, 2023, ROS had decreased to 0.151 and then dropped again, to 0.144 by June.
Overall, the long-term trend from September 2020 to June 2023 shows a growth rate of approximately 176%. However, emphasis on the more recent data reveals a downturn in the first half of 2023 after peaking at the end of 2022.
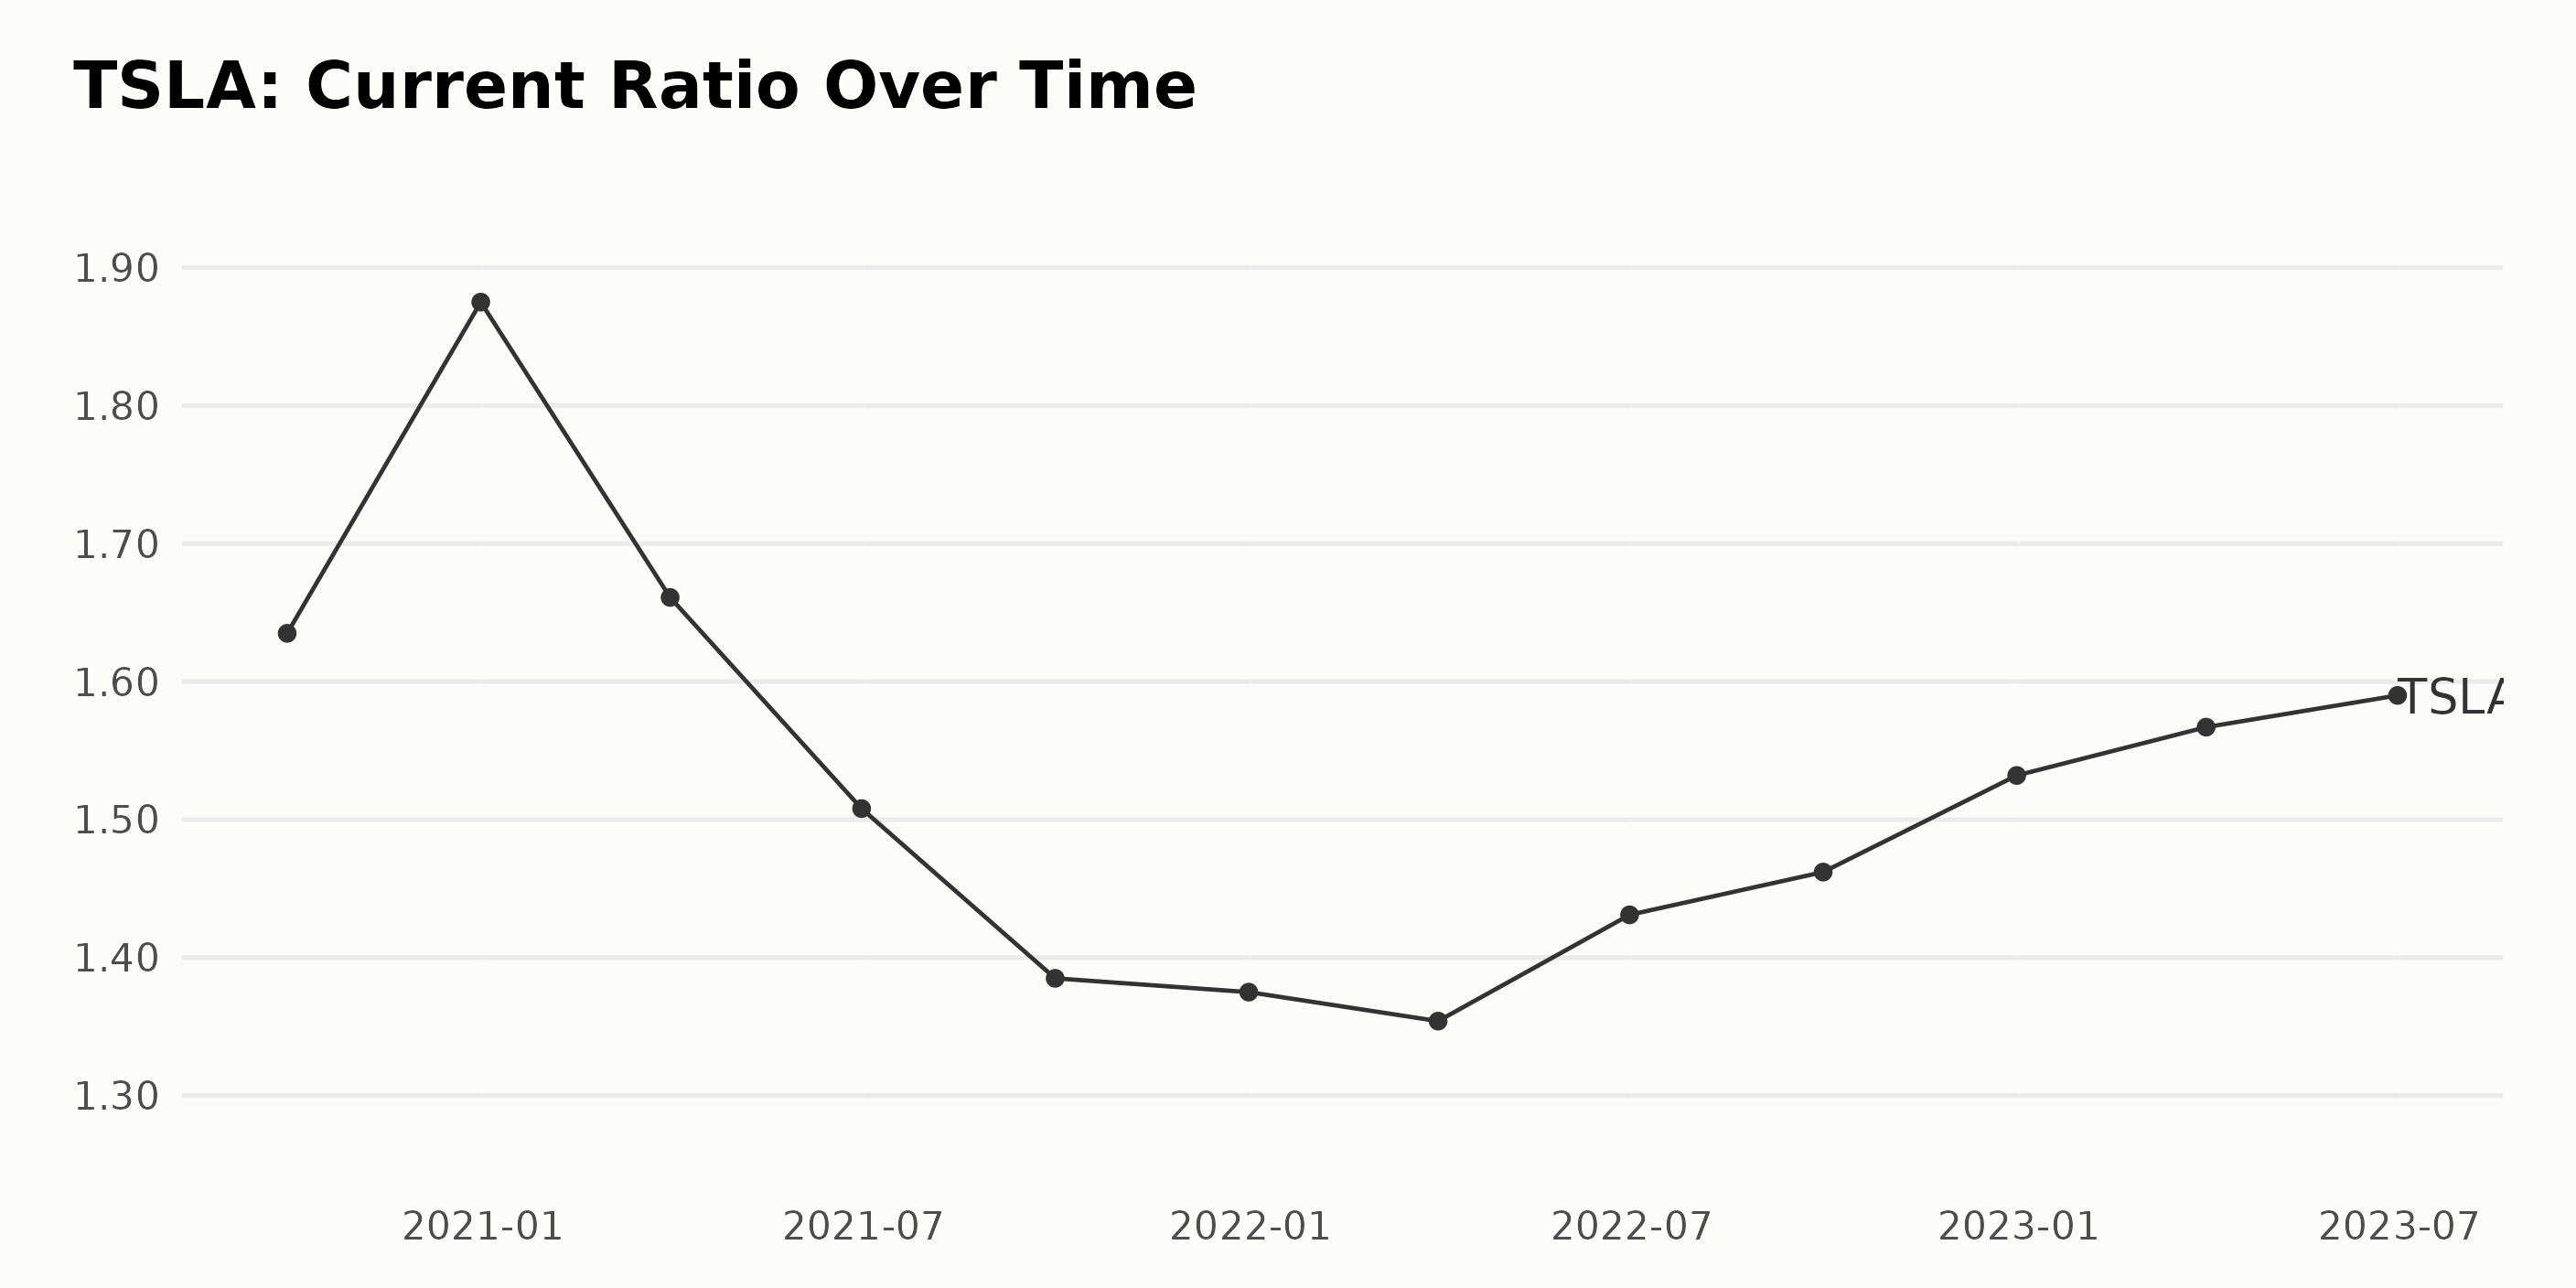
Over the past few years, TSLA’s current ratio has displayed notable fluctuations:
- In September 2020, the current ratio stood at 1.64.
- By the end of 2020, it increased to 1.88.
- However, in the first quarter of 2021, the current ratio decreased to 1.66 and continued this downtrend until March 2022, when it hit a low of 1.35.
- From June 2022 onwards, the current ratio began to recover, rising from 1.43 to 1.59 as of June 2023.
Focusing on more recent figures, TSLA's current ratio has been on an upward course since its lowest point in March 2022. In terms of growth rate, measured from September 2020's ratio of 1.64 to June 2023's ratio of 1.59, there is a decrease of approximately 3%.
However, considering the rebound from its low point in March 2022 (1.35) to its latest data point in June 2023 (1.59), there has been an upward growth of roughly 18%. Overall, TSLA's current ratio trend appears to have initially been marked by notable declines but has recently demonstrated signs of recovery.
Six-Month Analysis of Tesla Stock Performance: Volatility and Fluctuation Prevail
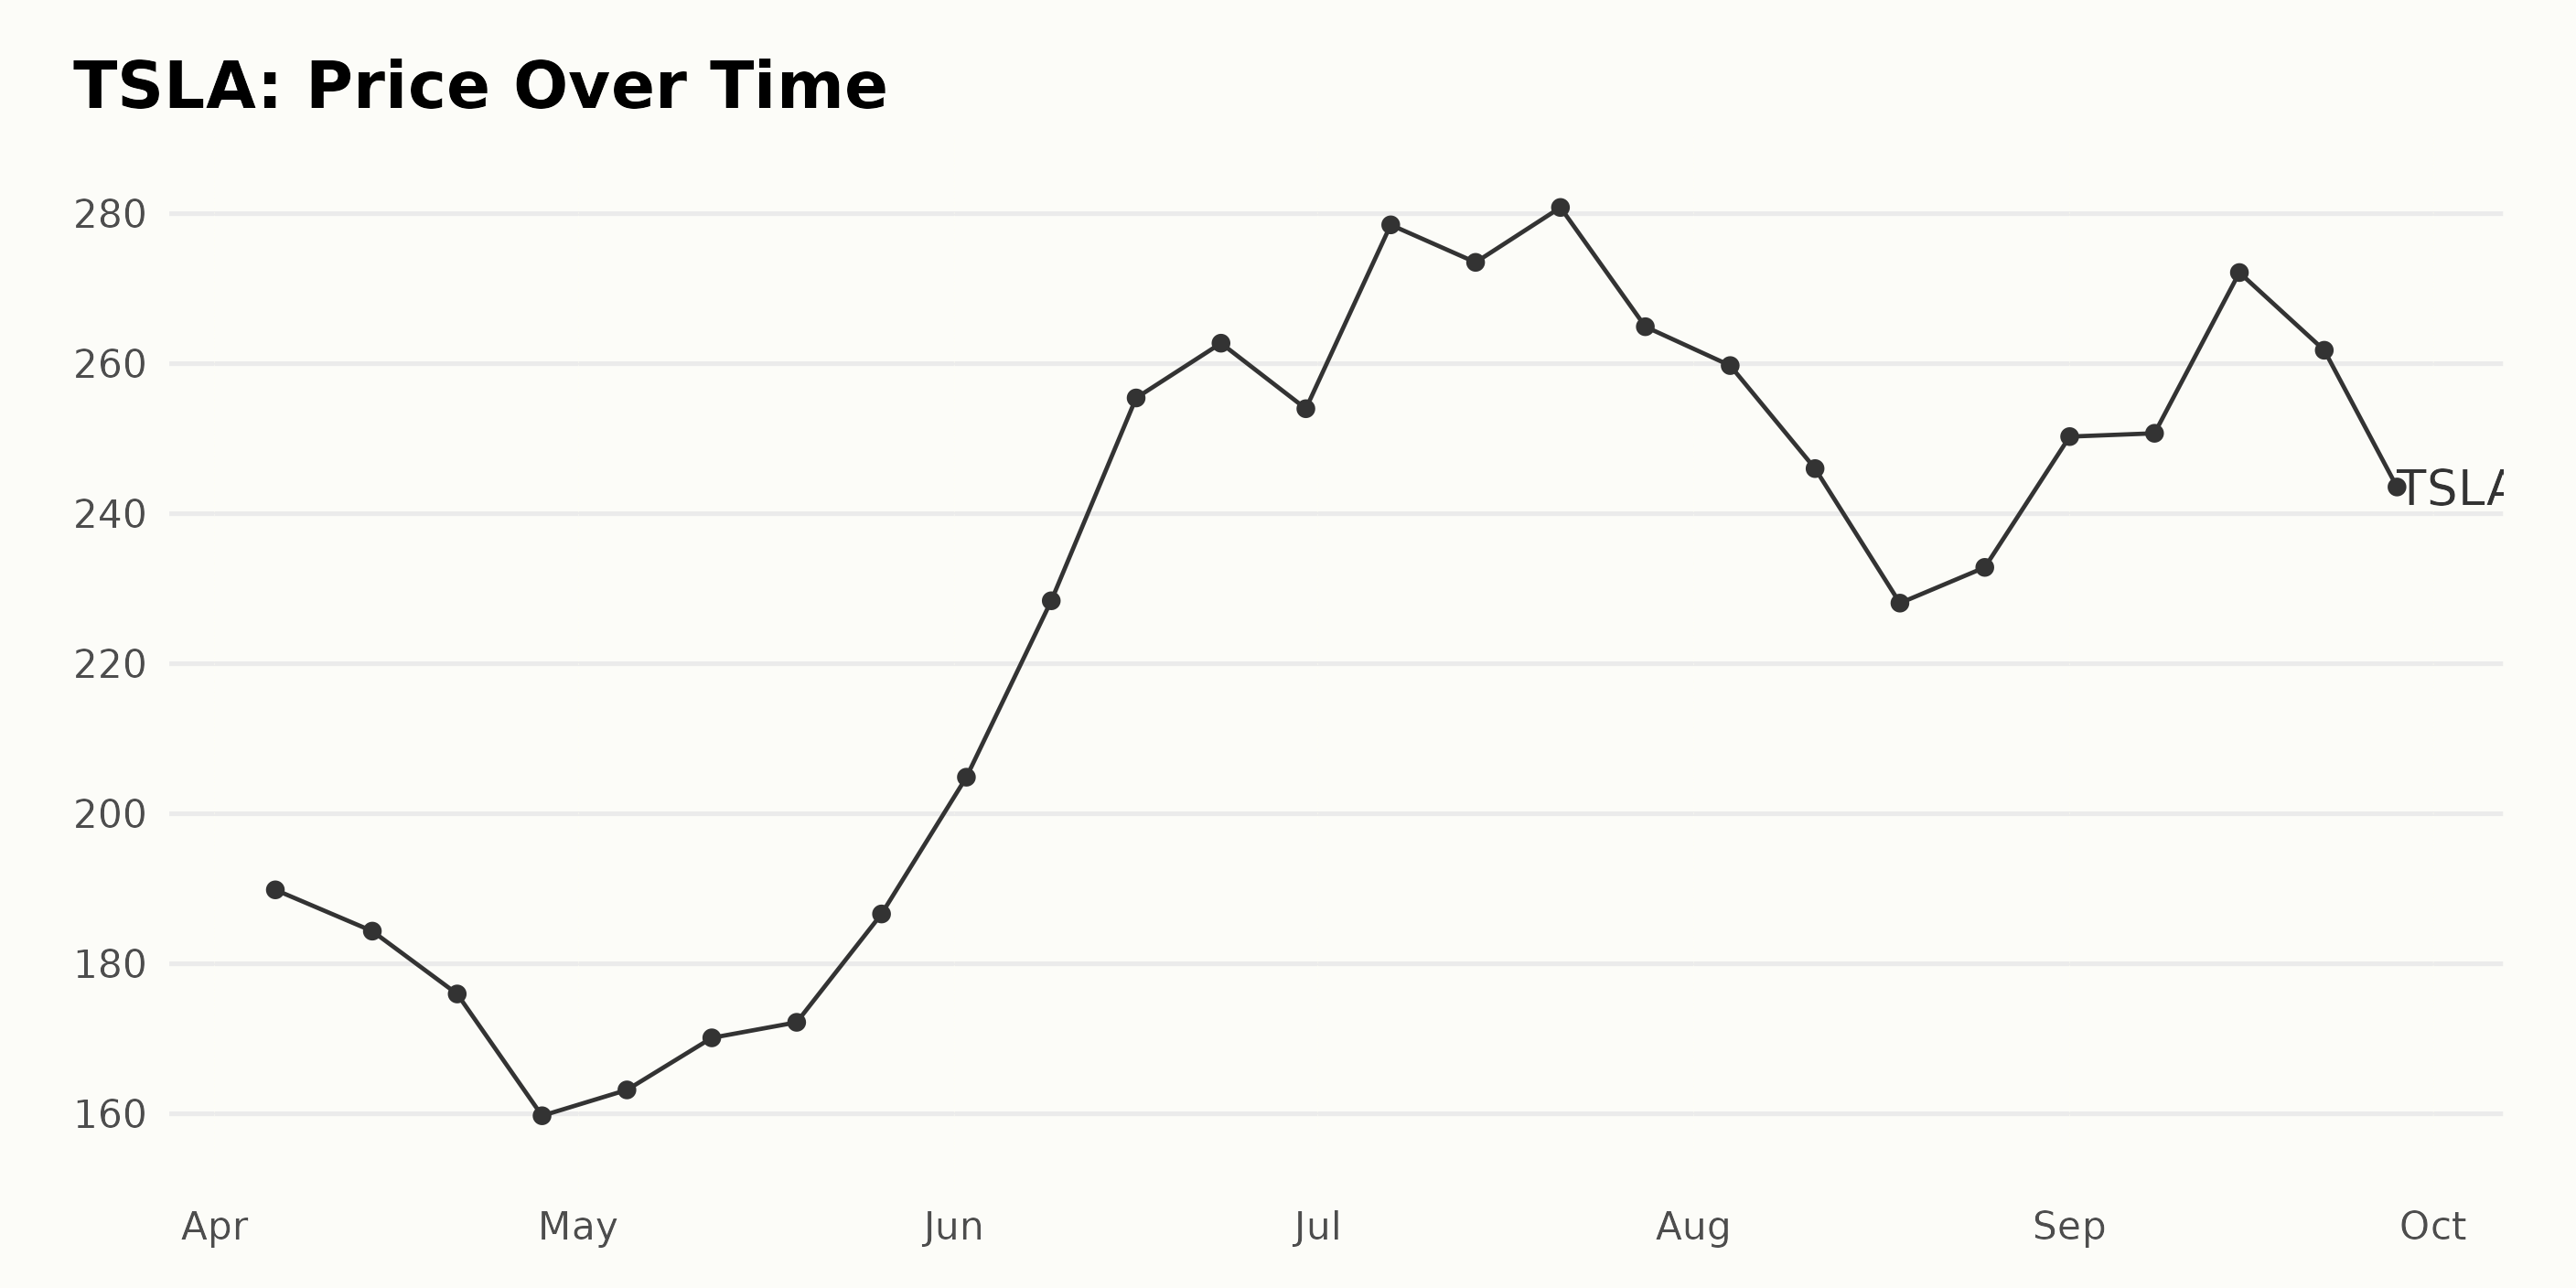
Analyzing the data reveals a fluctuating trend in the share price of TSLA from April to September 2023. While a precise calculation of the growth rate isn't feasible without additional data, there are noticeable trends within each month.
- April 2023: TSLA opened at $189.86 on April 6 and closed at $159.74 on April 28, exhibiting a downward trend through April.
- May 2023: The value had a dip initially but started to recover and ended the month at $186.64. This shows a somewhat recovering trend in May.
- June 2023: TSLA's share price experienced a significant increase, starting the month at $204.87 and peaking at $262.73 on June 23 before experiencing a slight decline to close the month at $253.99.
- July 2023: The stock started rising again, reaching a new peak of about $280.83 on July 21, but fell to $264.93 by the end of the month.
- August 2023: The price experienced a significant decline in August, opening at $259.75 and dropping to $228.08 by August 18. However, it marginally recovered to end the month at $232.84.
- September 2023: The stock saw an initial rise to $272.15 by the middle of the month, followed by a sharp fall to close September 28 at $246.38.
Overall, the trend can be characterized as irregular and volatile, with both rising and falling phases. A clear pattern of acceleration or deceleration is not evident from the given data. The data suggests months of downturns and recovery rather than a steady growth or decline rate over the observed period. Here is a chart of TSLA's price over the past 180 days.
Analyzing Tesla's POWR Ratings: Quality, Momentum, and Growth Dimensions Explained
TSLA, which belongs to the Auto & Vehicle Manufacturers category that boasts a total of 54 stocks, has generally maintained a consistent POWR Ratings grade over time. A quick analysis of the provided data shows that from April to September 2023, it held a POWR Grade of C (Neutral). Here's a more detailed review:
- In April, TSLA's rank fluctuated between #37 and #39 within its category.
- During May, it saw a slight drop in its position, settling at a rank of #40 by the end of the month.
- Throughout June, its rank fluctuated between #39 and #40 while still keeping its POWR grade.
- Fairly stable throughout July, TSLA held onto the #38 position in its rank and persistently maintained its C (Neutral) grade.
- In August, it oscillated between #38 and #39 ranks.
- Quite consistently, in September, it hovered around the same ranks.
Based on the latest information available, on September 29, 2023, TSLA remained at the #39 rank in its category with a POWR grade of C (Neutral). The stability of the POWR grade indicates that the performance of TSLA has been relatively steady over the observed period.
Nevertheless, its ranking within the category suggests that there is ample room for improvement relative to its peer set within the Auto & Vehicle Manufacturers category.
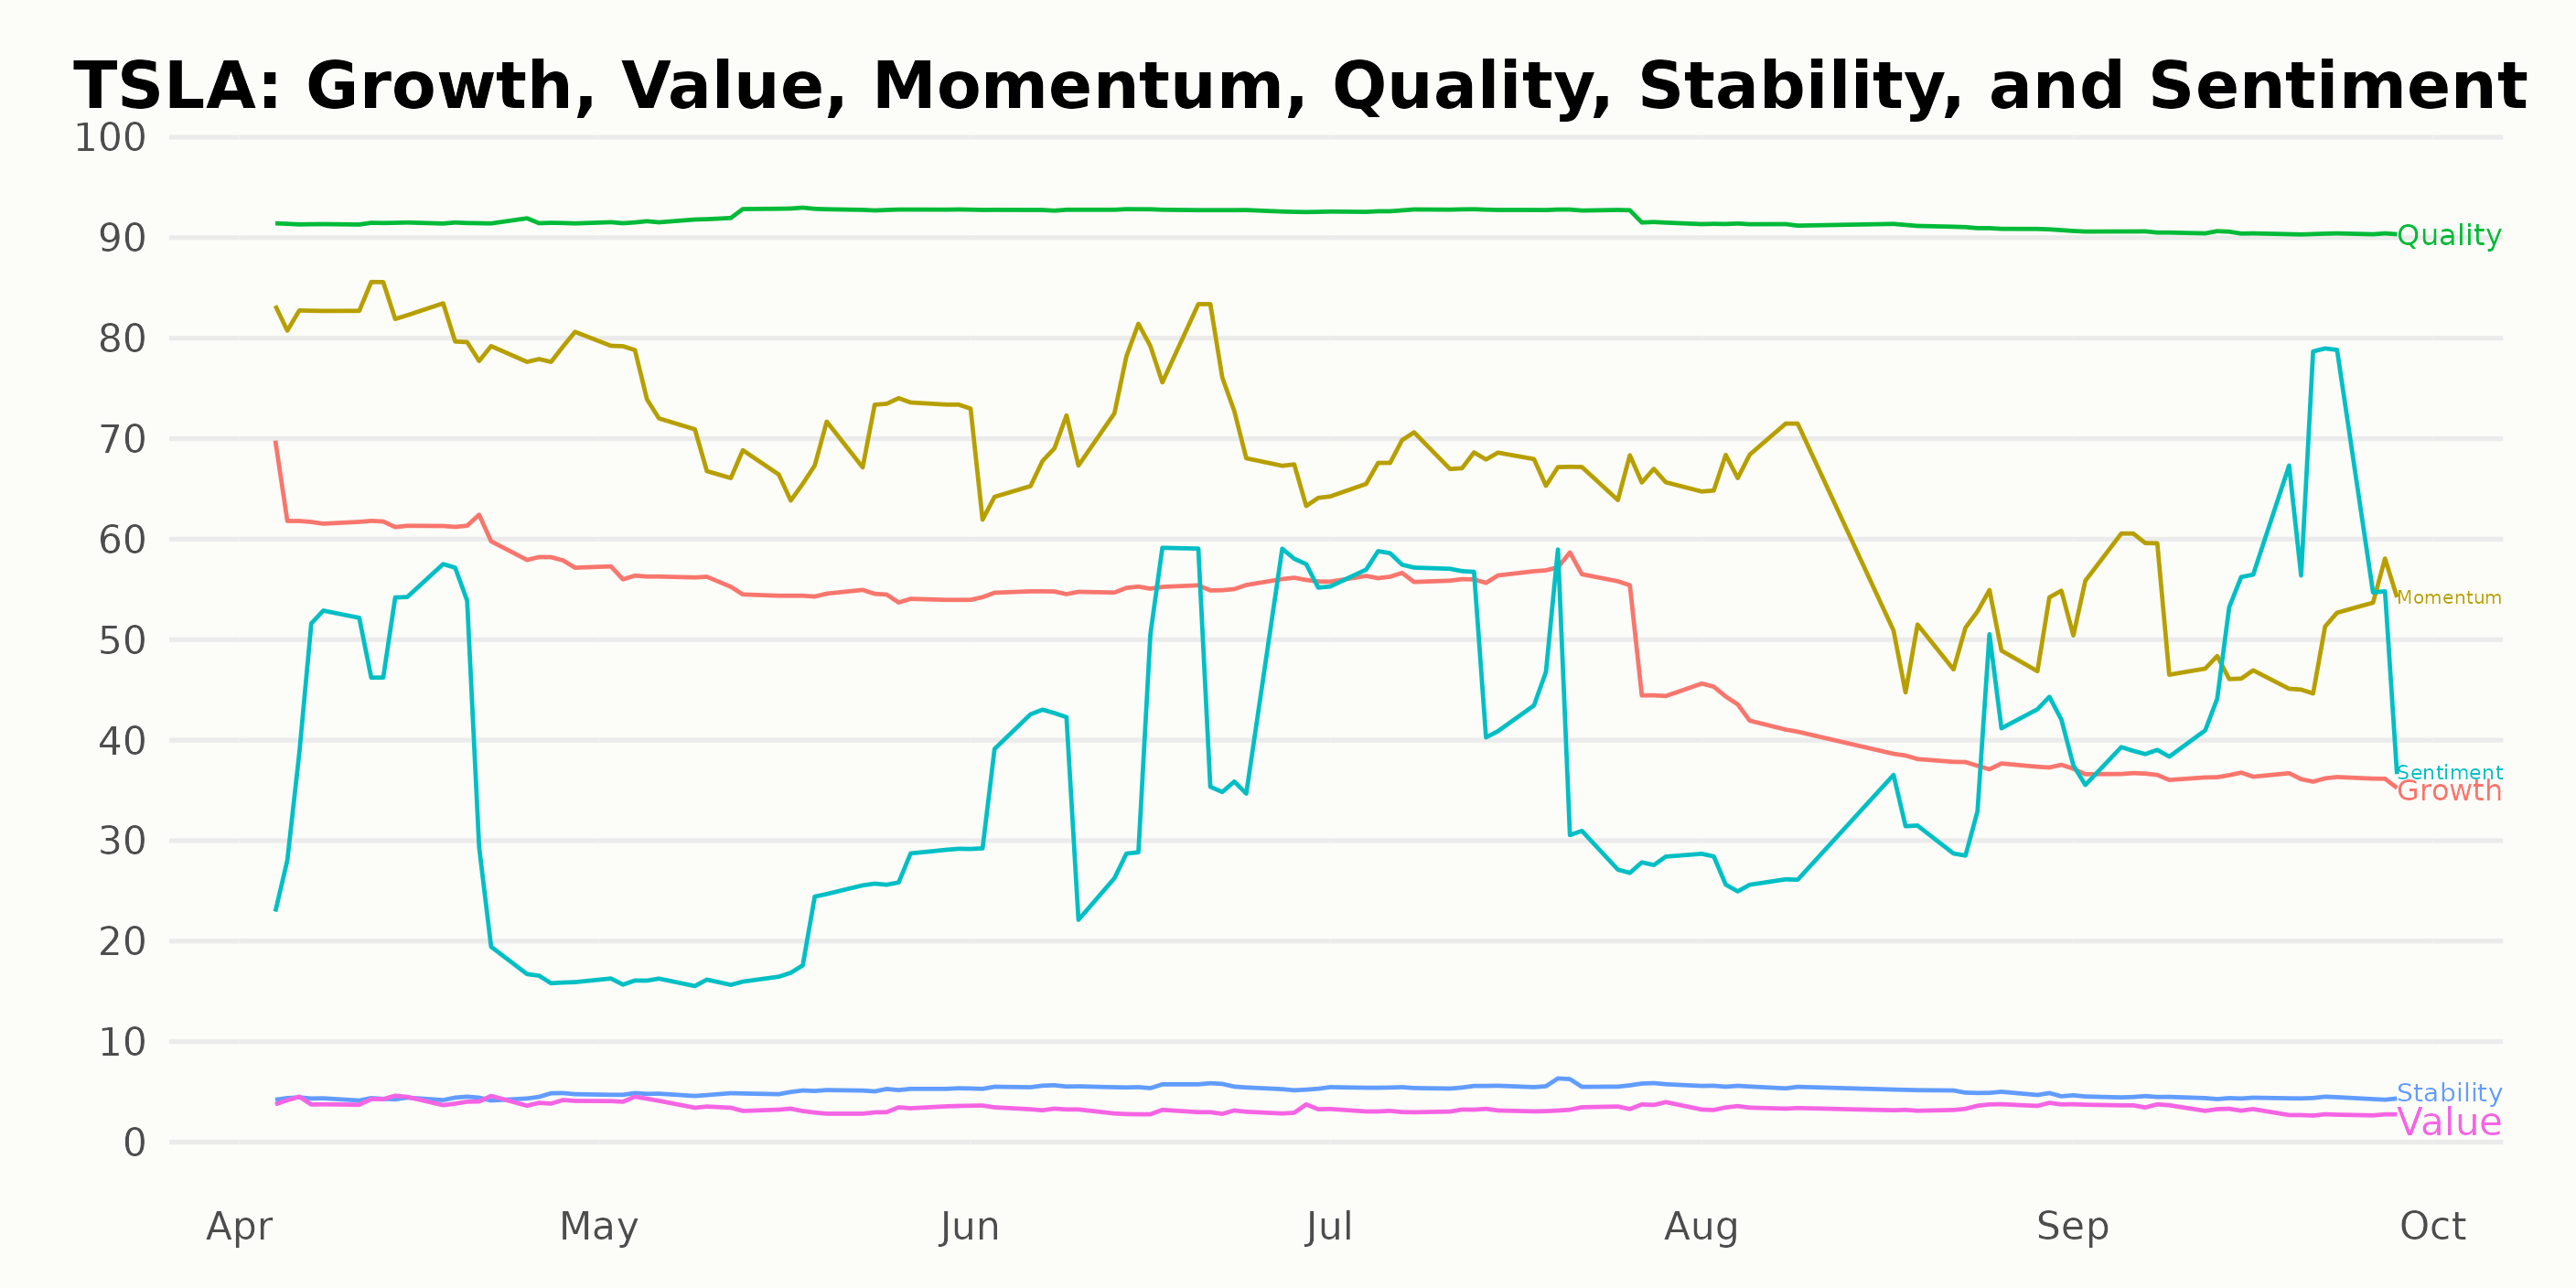
In analyzing the POWR Ratings for TSLA, it is clear that the three most noteworthy dimensions that have considerably higher values are Quality, Momentum, and Growth. Let's examine these more closely.
Quality:
TSLA's Quality rating consistently rates the highest among all dimensions across the provided time frame. This indicates sustained confidence in the robustness of TSLA's fundamentals. The ratings start at a high score of 91 in April 2023. There is a steady increase to 93 in June and July 2023, followed by a slight decline, but still relatively high scores of 91 in August and 90 in September 2023.
Momentum:
The Momentum rating also ranks highly, implying that investors perceive a strong, positive growth trend. It begins with a peak at 81 in April 2023, then gradually declines over time, reaching 57 in August and 52 by September 2023. Despite the decrease, the momentum dimension still shows substantial scores, which signifies a consistent performance trajectory.
Growth:
Lastly, the Growth dimension reflects TSLA's capacity to expand its business and profits. This rating starts at 61 in April 2023, demonstrates a decline to 55 from May to July 2023, and further drops to 40 in August before hitting a low of 36 in September 2023. While this overall declining trend signals some slowdown in TSLA's Growth potential, the dimension still remains important due to its initial high scores.
Therefore, according to POWR ratings, Quality, Momentum, and Growth appear to be the most significant dimensions for TSLA during this period.
How does Tesla, Inc. (TSLA) Stack Up Against its Peers?
Other stocks in the Auto & Vehicle Manufacturers sector that may be worth considering are Honda Motor Co., Ltd. (HMC), REV Group, Inc. (REVG), and Stellantis N.V. (STLA) - they have better POWR Ratings. Click here to explore more stocks in the Auto & Vehicle Manufacturers sector.
What To Do Next?
43 year investment veteran, Steve Reitmeister, has just released his 2024 market outlook along with trading plan and top 11 picks for the year ahead.
TSLA shares were trading at $249.09 per share on Friday afternoon, up $2.71 (+1.10%). Year-to-date, TSLA has gained 102.22%, versus a 12.88% rise in the benchmark S&P 500 index during the same period.
About the Author: Anushka Dutta

Anushka is an analyst whose interest in understanding the impact of broader economic changes on financial markets motivated her to pursue a career in investment research.
The post Tesla (TSLA) - October Buy or Hold? appeared first on StockNews.com