


Prominent athletic footwear and apparel giant NIKE, Inc. (NKE) is slated to unveil its first-quarter results for fiscal 2024 next week, following an uncharacteristic earnings shortfall in the last reported quarter. Fiscal 2023 saw the firm experience a year-over-year decline in its bottom-line performance.
China's tepid recovery and intensifying merchandise inventories have negatively impacted NKE's shares. It's important to note that China plays a pivotal role in the growth strategy of this sports industry behemoth.
Despite these challenges, as a dominant brand in the athletics industry, the company continues to maintain a degree of financial resilience. For instance, in August, NKE announced a quarterly cash dividend of $0.340 per share on its existing Class A and Class B common stock, scheduled for distribution to shareholders on October 2, 2023.
With an annual dividend of $1.36, offering a yield of 1.45% based on current prices, and marking ten years of continuous dividend growth, the company displays financial consistency.
In light of this scenario, it is essential to review the trends of NKE's critical financial indicators to ascertain why postponing investment until a more favorable entry point in the stock may be the prudent choice.
Analyzing NIKE, Inc.'s Financial Performance: A Detailed Examination of Net Income, Price/Earnings Ratio and Other Key Indicators from 2020 to 2023
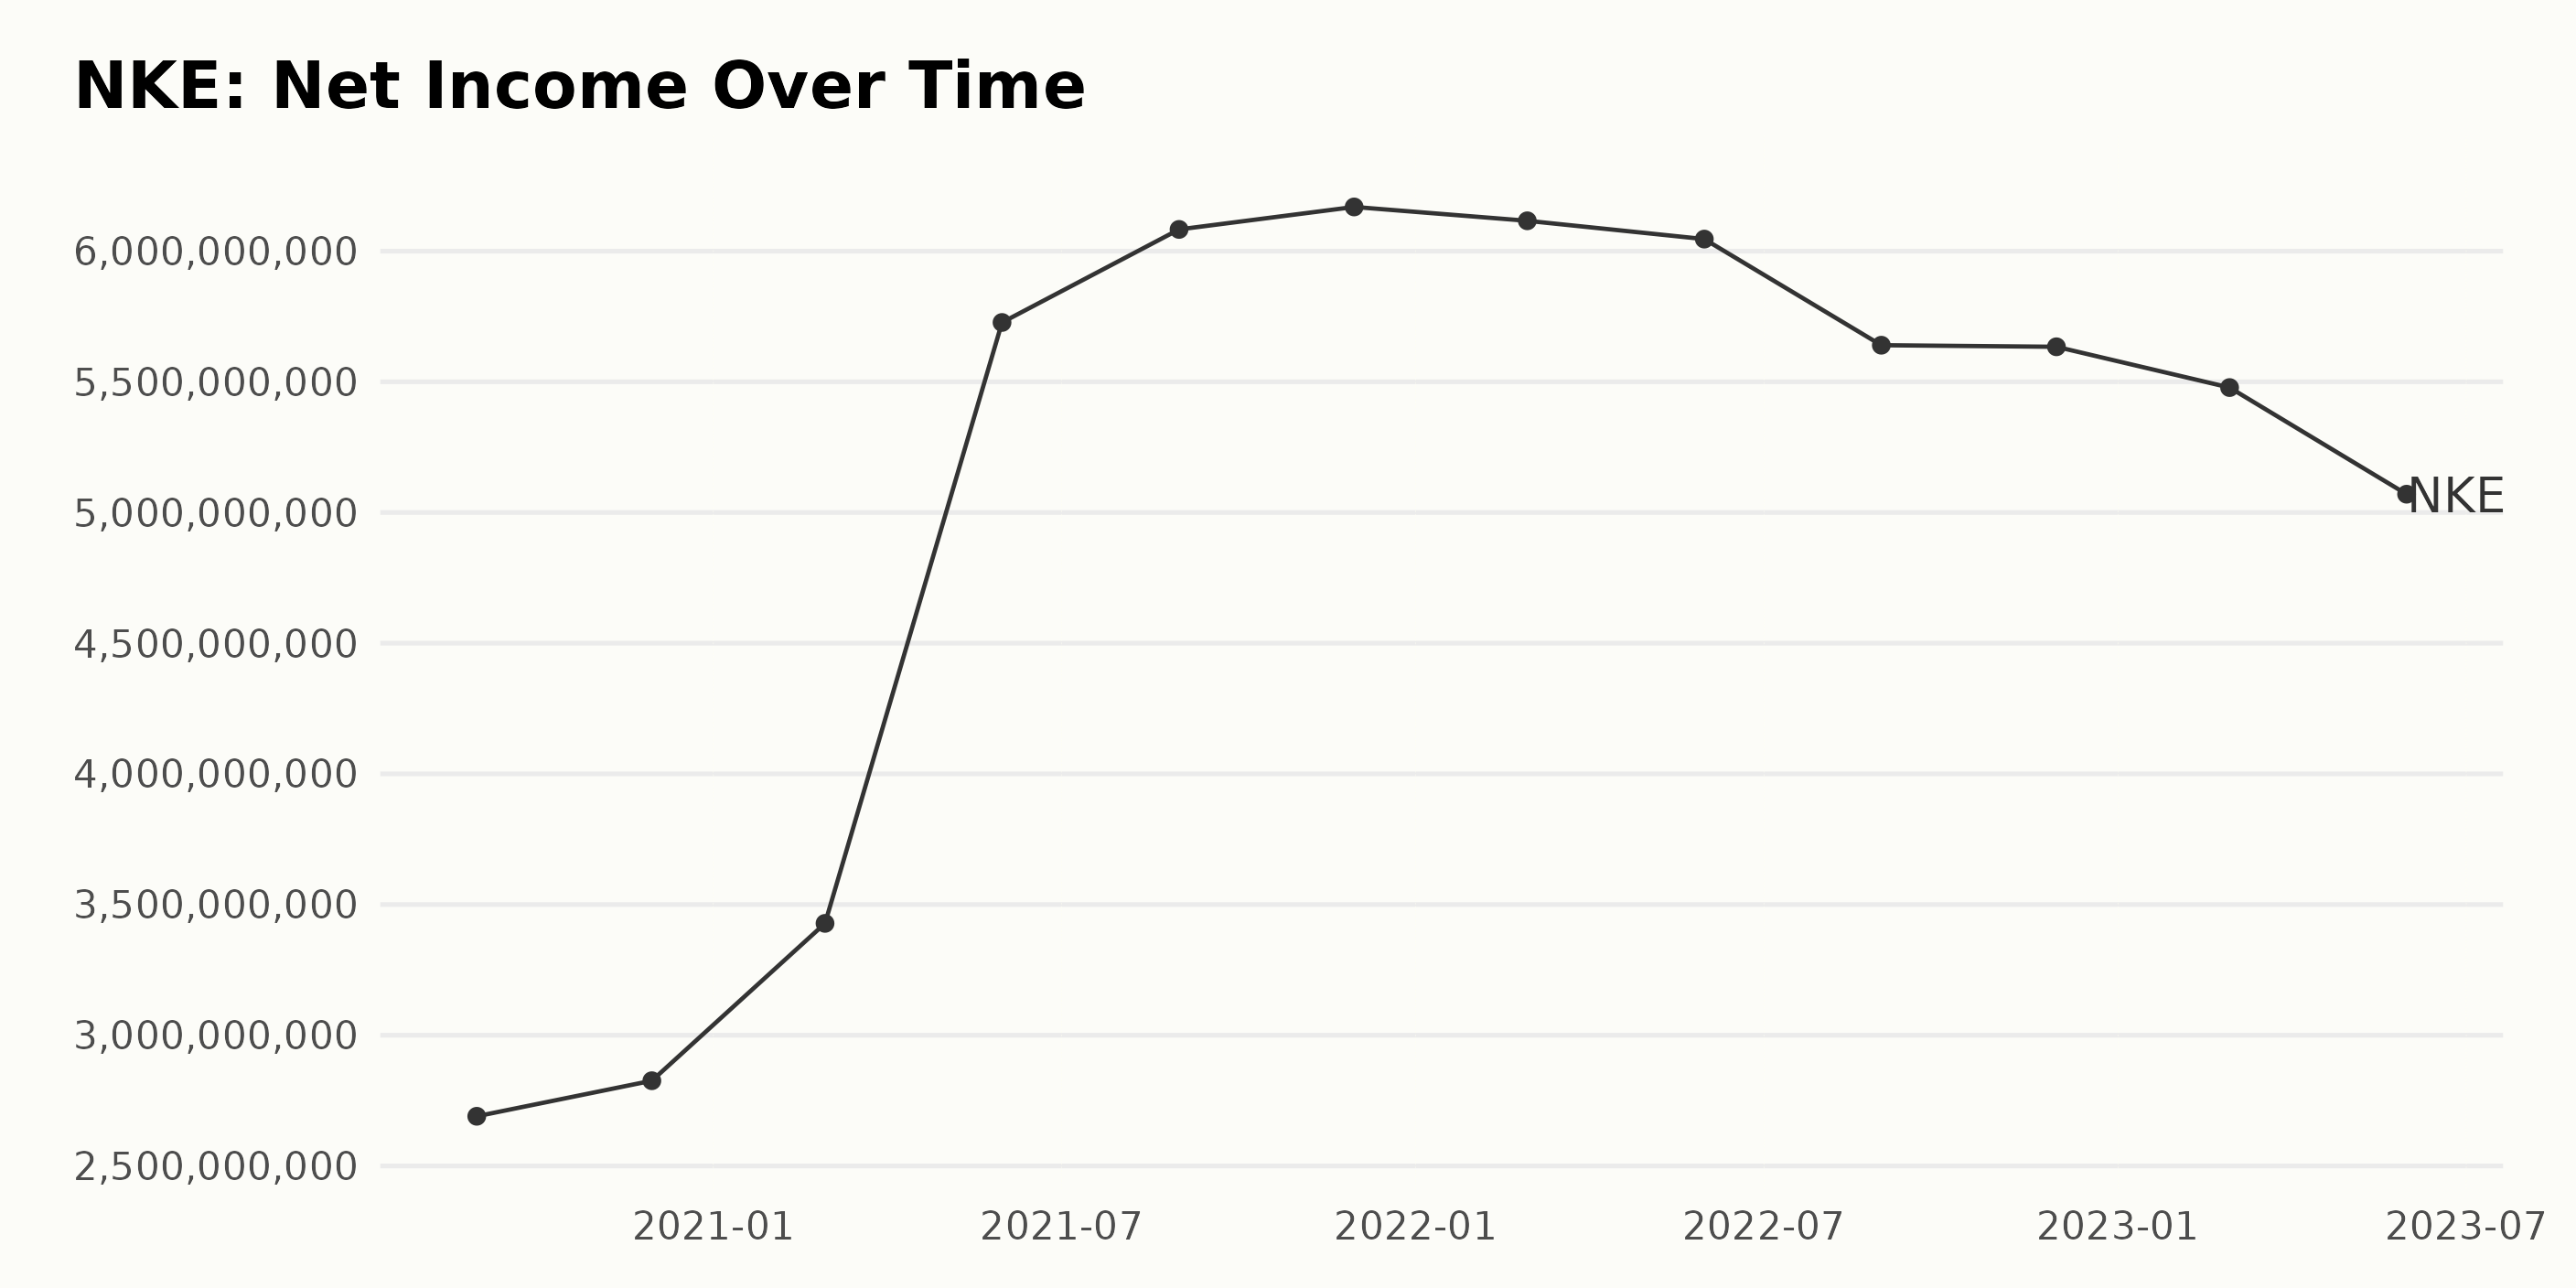
NKE has seen an overall increase in the trailing-12-month net income from August 2020 to May 2023 with some fluctuations. Below is a summary of the trends and changes:
- From August 2020 through November 2021, NKE's net income demonstrated consistent growth. Starting at $2.69 billion in August 2020, it increased to $2.83 billion by November 2020, eventually reaching its peak at $6.17 billion in November 2021.
- In February 2022, there was a minor dip in net income to $6.12 billion, followed by a slight reduction to $6.05 billion by May 2022.
- From August 2022, a further decrease occurred, with a net income of $5.64 billion. This trend continued until November 2022, with only a minor decrease from $5.64 billion to $5.63 billion.
- From February 2023 to May 2023, a steady downward trend was observed, with the net income reducing from $5.48 billion in February 2023 to $5.07 billion in May 2023.
Calculating based on the first and last value in the series, the overall growth rate of NKE's net income stands at approximately 88% over the reported period. Despite some periods of reduced net income, the general trend shows growth.
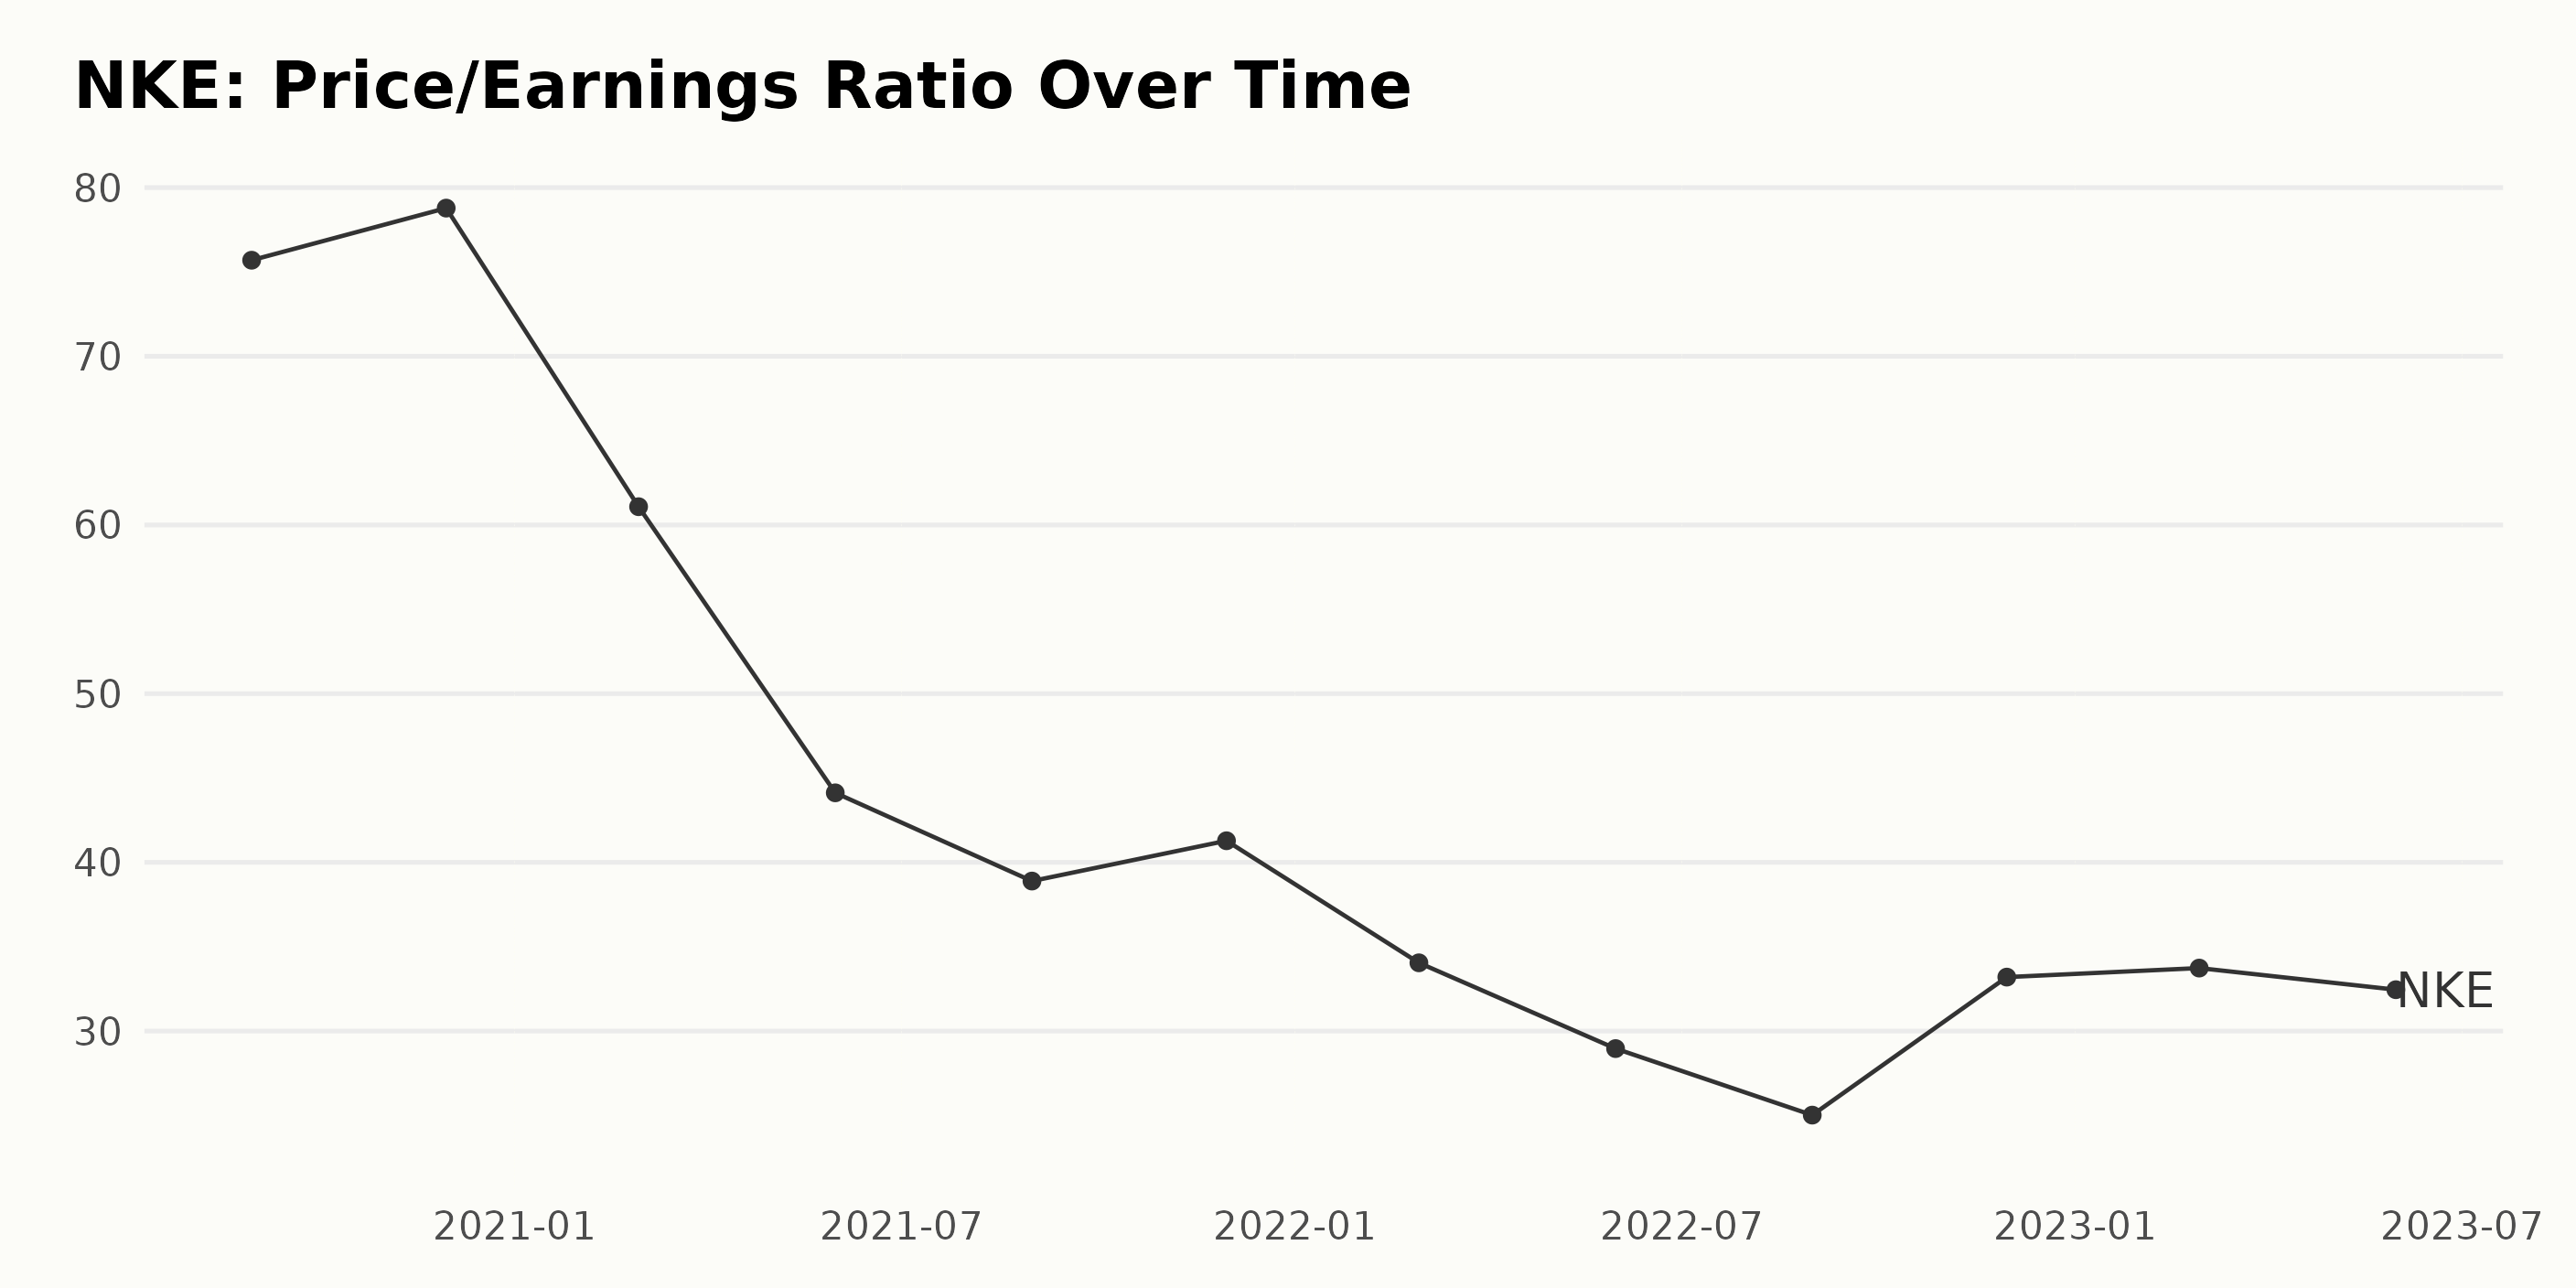
The Price/Earnings ratio (P/E) of NKE has depicted a significant and consistent decline from August 2020 to May 2023, despite some minor fluctuations. Here is a summary:
- Starting at 75.70 in August 2020, the P/E ratio rose marginally to 78.79 by November 2020.
- However, this was followed by a notable drop to 61.08 by February 2021 and further down to 44.12 by May 2021.
- Despite minor upticks in November 2021 (41.28) and February 2023 (33.73), the general declining trend continued, with the ratio falling to 32.45 by May 2023.
The most recent data for May 2023 shows that the P/E ratio of NKE stands at 32.45, which is substantially lower compared to its start point in August 2020. This represents a decrease of approximately 58% over the period under observation.
Considering the trend in NKE's P/E ratio, the company has been seeing increasingly lower valuation relative to its earning capacity since 2020. This could indicate a perception of slowing growth, increased risk, or potentially undervalued stock price.
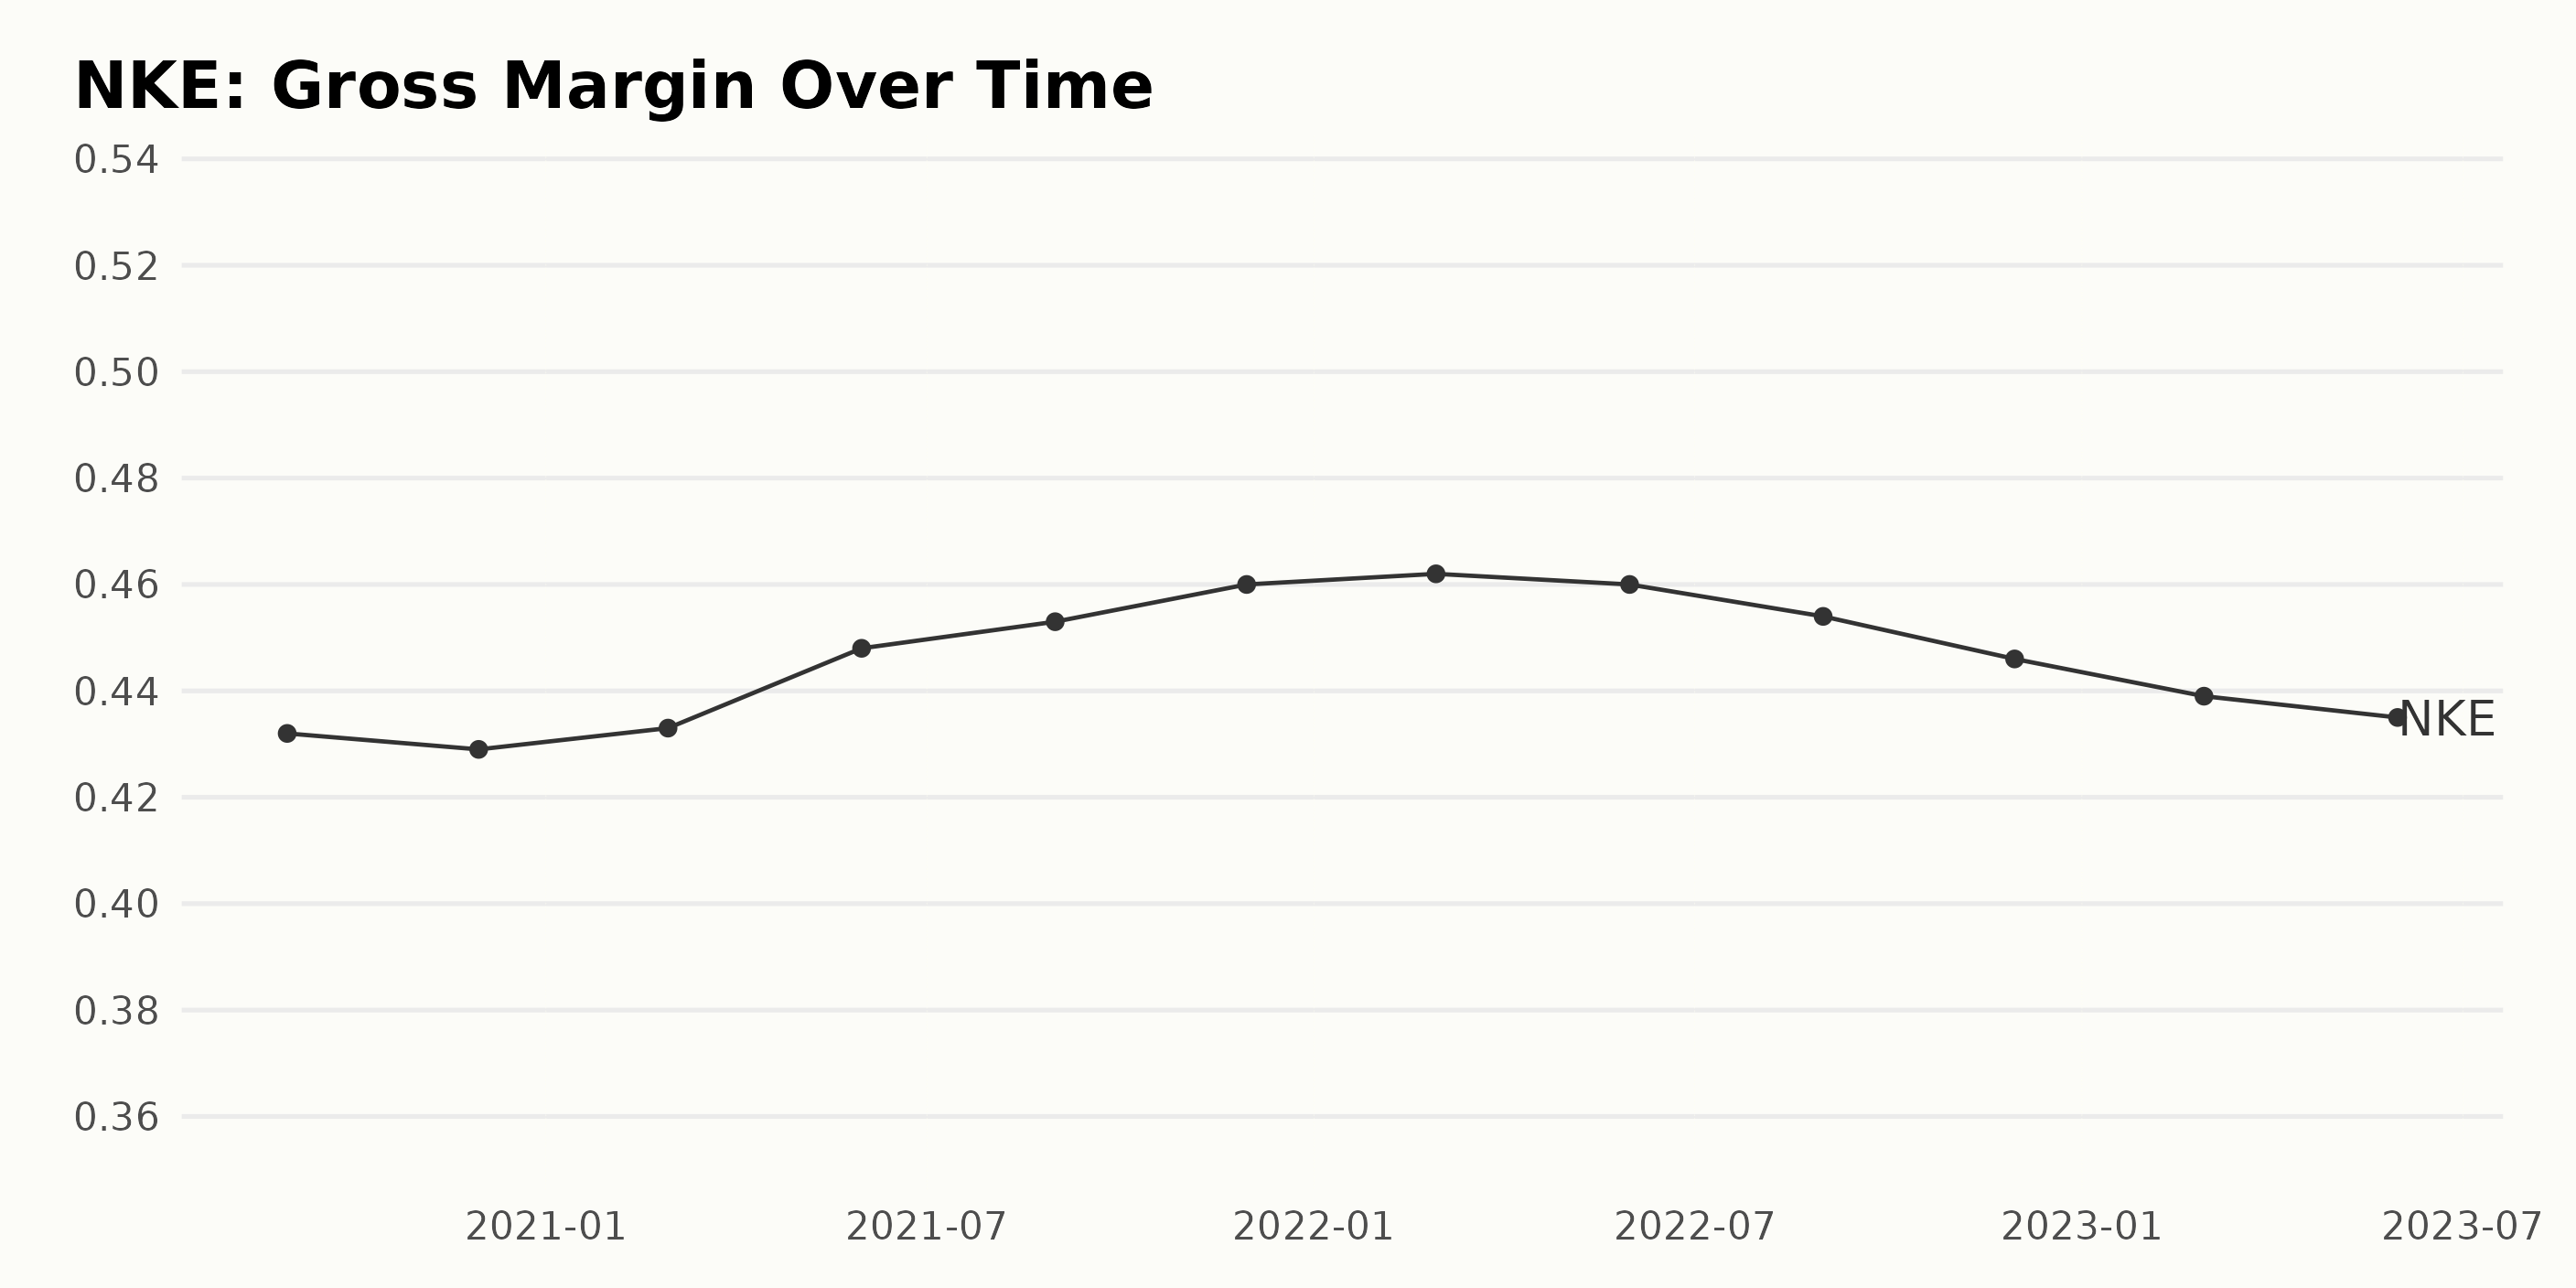
The gross margin data for NKE from August 31, 2020, to May 31, 2023, can be summarized as follows:
- August 31, 2020: The gross margin was 43.2%.
- Between August and November of 2020, there was a slight decrease to 42.9%.
- Then, in the first quarter of 2021, there was an increase to 43.3%. This growth continued until May, with an impressive value of 44.8% recorded.
- By August 31, 2021, the gross margin had increased further to 45.3%. This quarter was marked by a growth spurt that continued until November 30, 2021, when the gross margin reached a high of 46%.
- A similar peak was maintained in February 2022. However, the gross margin slightly decreased to 46% by May 2021.
- From August 31 to November 30, 2022, there was a noticeable decline from 45.4% to 44.6%.
- This downward trend continued into early 2023, with the gross margin declining to 43.9% by February and further to 43.5% by the end of May.
The significant growth rate observed was between August 2020 and November 2021, where the gross margin increased from 43.2% to 46%. However, since then, there appears to have been a steady decline. More emphasis should be placed on the latter part of this data set, as these more recent figures indicate a downward trend in gross margin, reaching as low as 43.5% in May 2023.
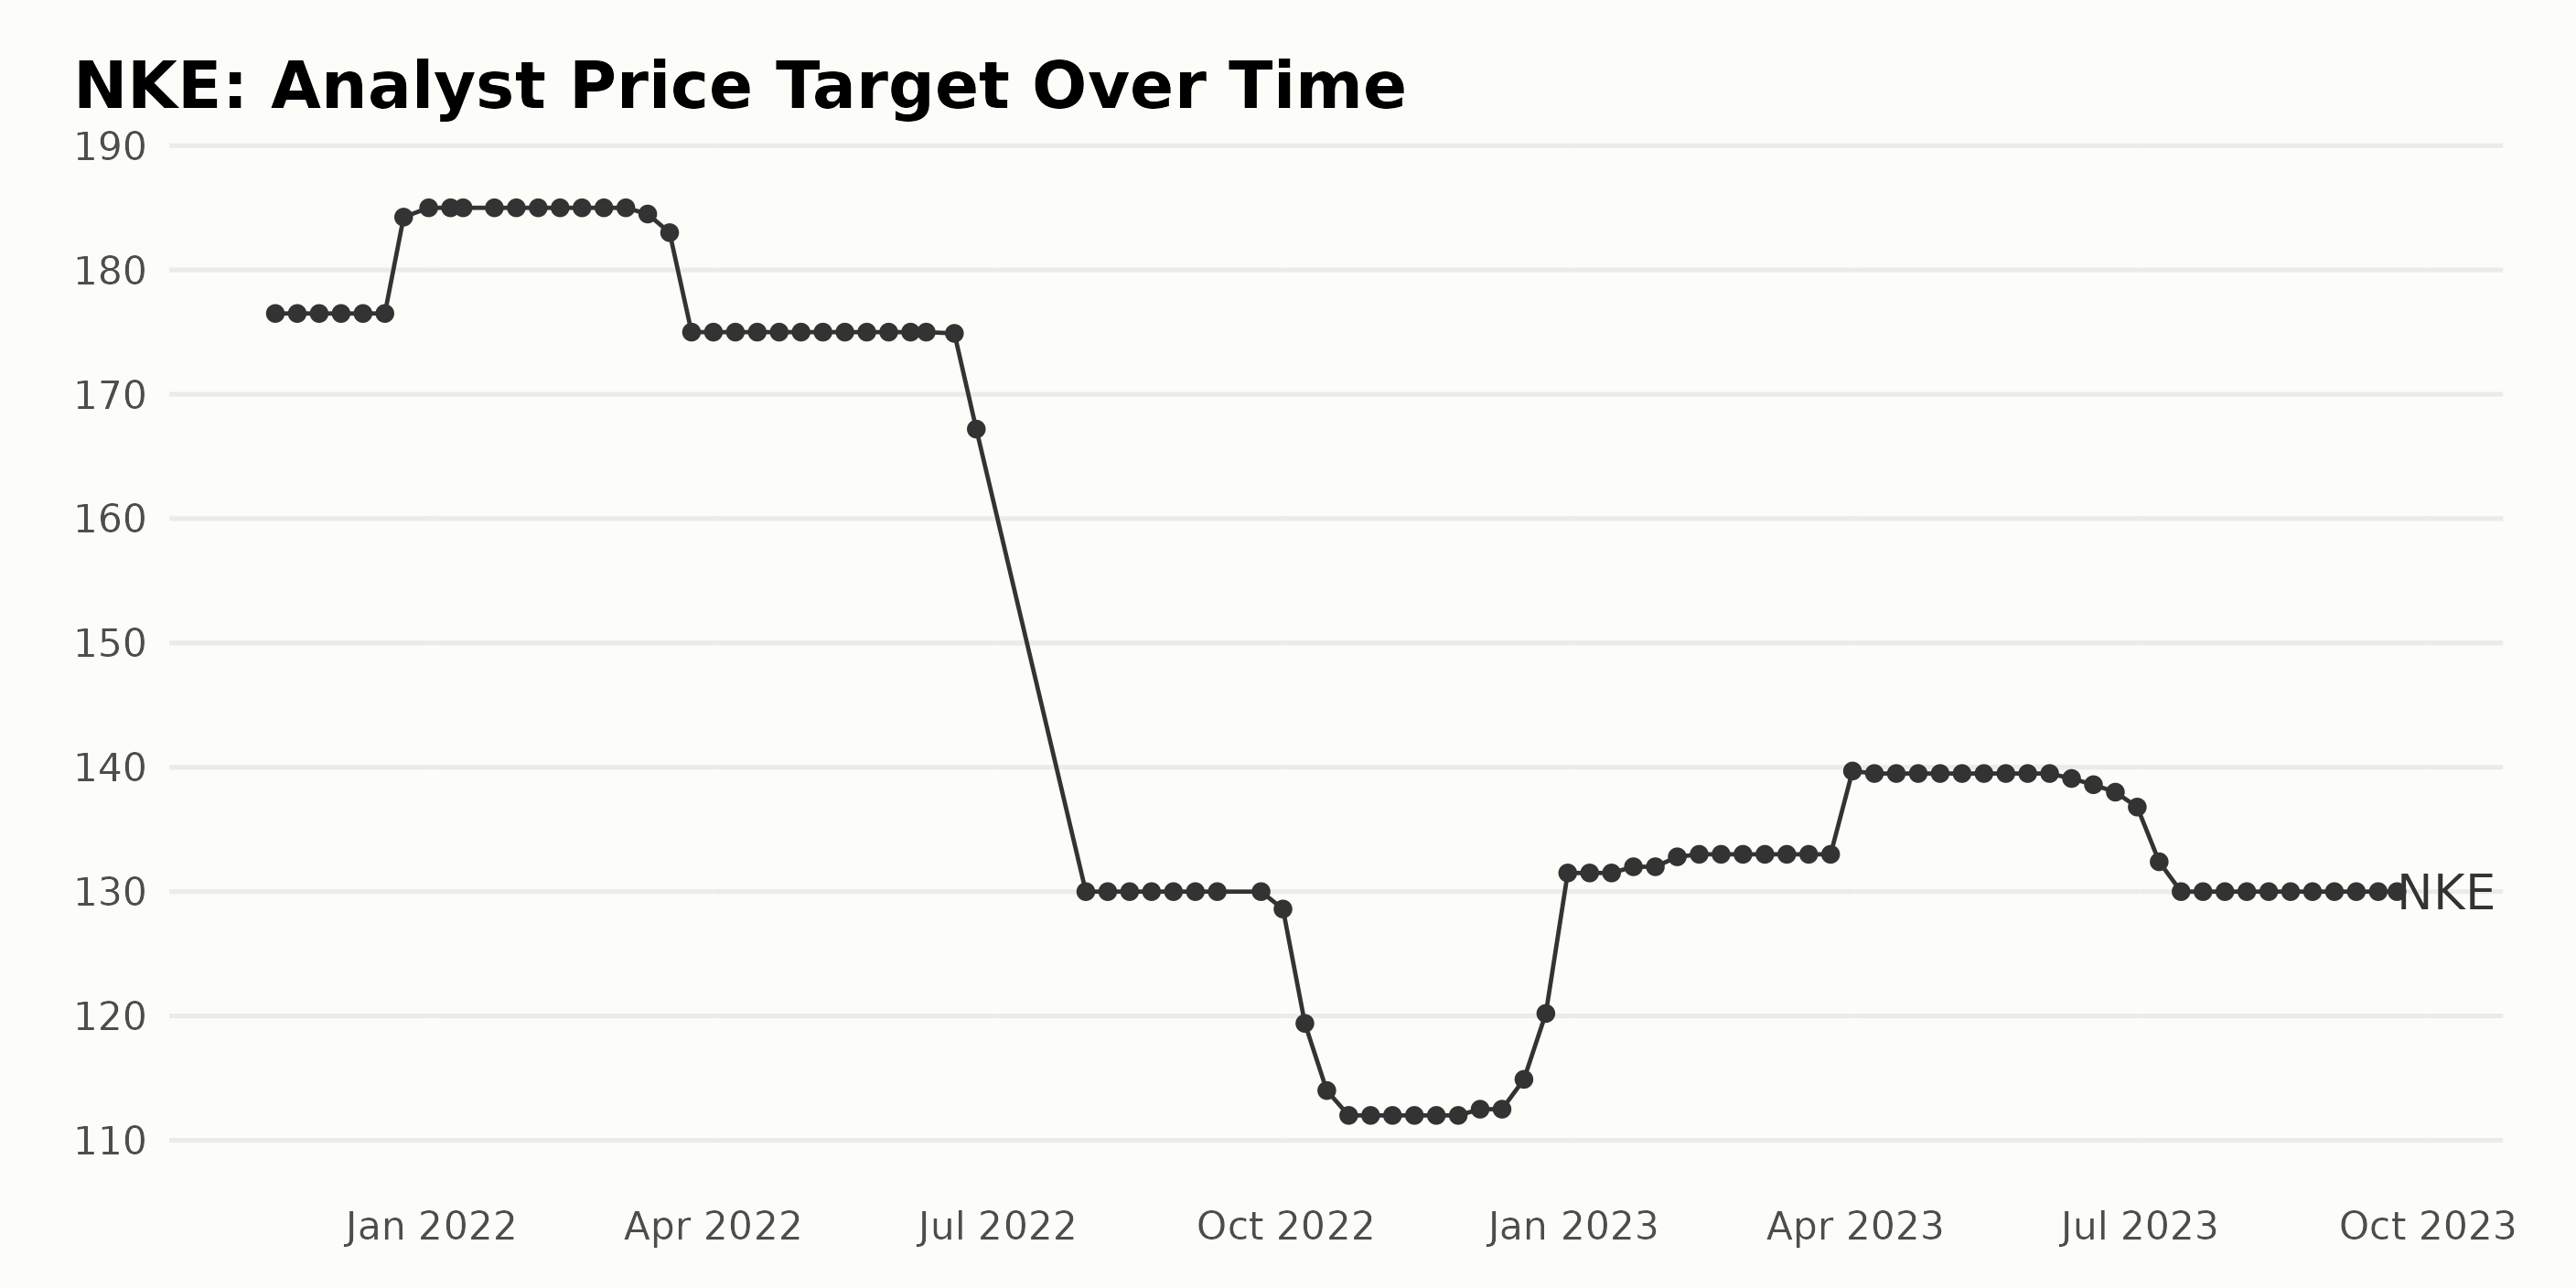
The analyst price target for NKE over the examination period showed a notable fluctuation with certain trends discernible.
- Starting on November 12, 2021, at a value of $176.5, the price target remained stable till December 17, 2021.
- In the following week leading up to December 23, 2021, there was a notable jump to $184.25, and the value further inched upward to peak at $185 on December 31, 2021. This marked level stayed the same until March 11, 2022.
- A slight decrease occurred on March 18, 2022, lowering the analyst price target to $183. The figure then dived sharply to $175 by March 25, 2022.
- For the subsequent months, continuing until June 17, 2022, the price target stabilized around $175, with only minor variations within this range.
- The data then shows a dramatic decay, with the analyst price target tumbling to $130 by July 29, 2022, where it stayed consistent till September 30, 2022.
- October 2022 marks another downfall, declining to $112 by October 21, 2022, and showing a small increase to $112.5 by early December 2022.
- In late December 2022, the price target ascended again, reaching $120.2 and eventually peaking again at $131.5 by December 30, 2022. This spike represents a rise of approximately 16.9% in a single month.
- The value seemed to hover around the $130 bracket until the end of March 2023 but grew to $139.7 by March 31, 2023.
- This trend persisted with a minor decrease until June 9, 2023, after which a gradual drop began, bringing the analyst price target down to $130 again by July 14, 2023.
- Data from July 14, 2023, until the end of the series on September 21, 2023, shows the price target remaining steady at $130.
Calculating the growth rate from the start point to the endpoint (from $176.5 in November 2021 to $130 in September 2023) reveals a negative growth of about -26.34%. Emphasizing recent data and considering the last significant change, a period of stability has been observed in the analyst price target for NKE since July 2023.
NIKE, Inc. Share Prices: An Analysis of Fluctuating Trends from March to September 2023
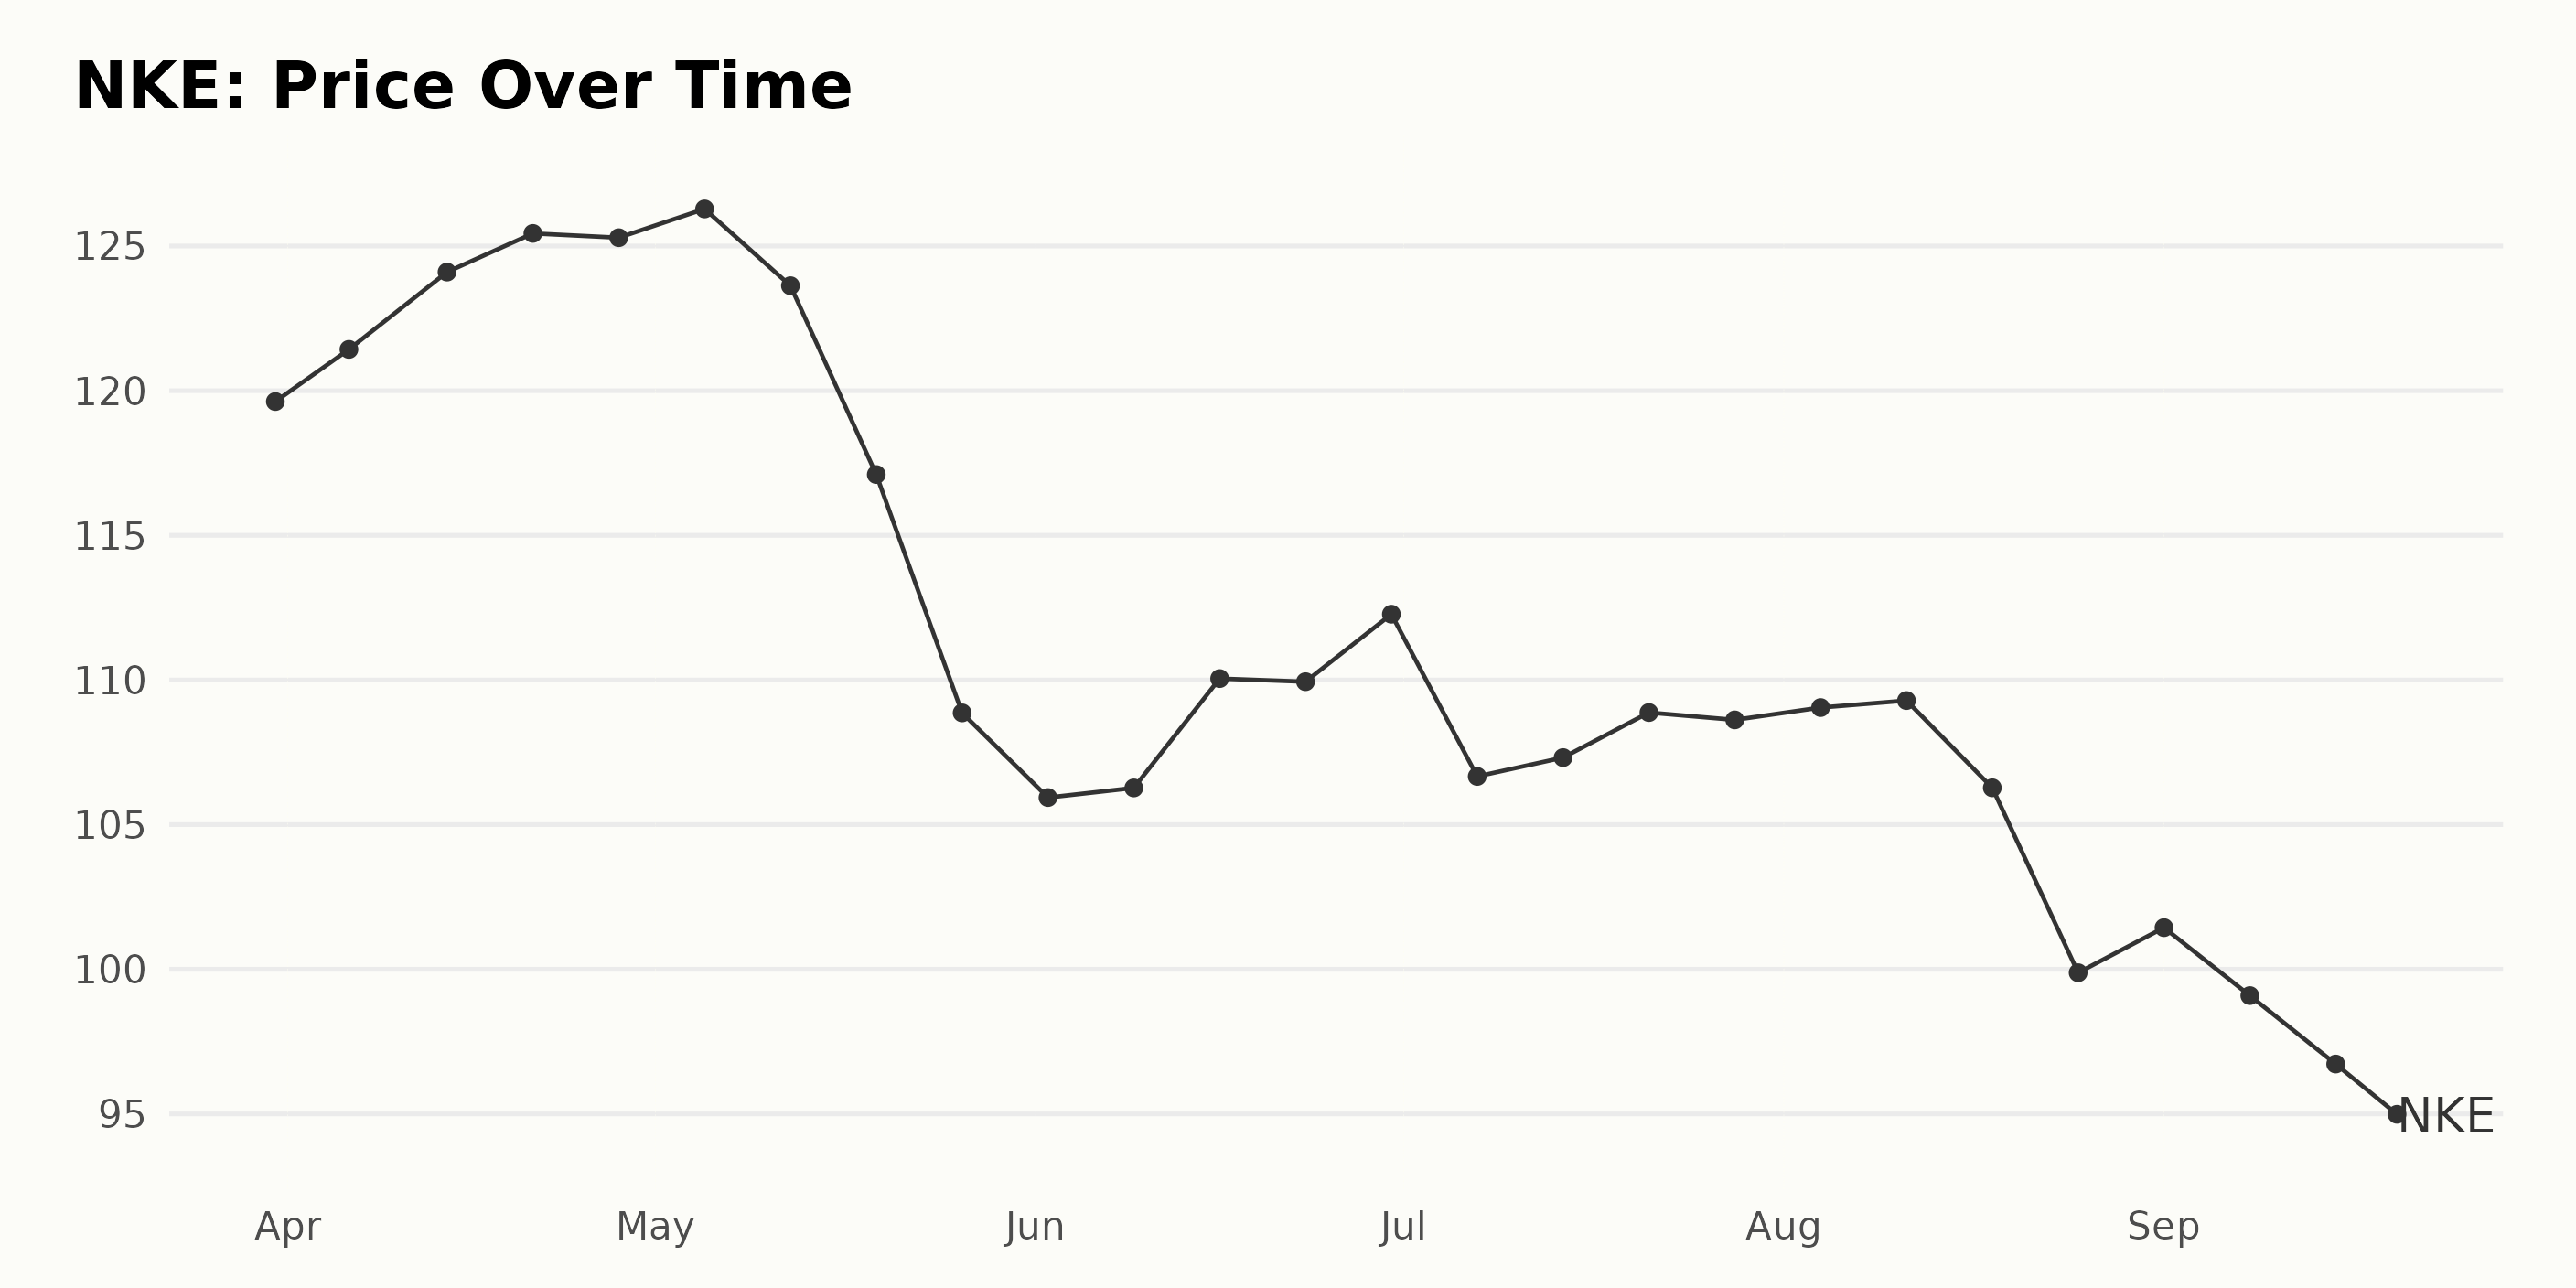
The share prices of NKE display a fluctuating trend, as indicated by the following data.
- On March 31, 2023, the share price was $119.62.
- On April 6, 2023, the share price appreciated to $121.43.
- By April 14, 2023, there was an increase to $124.10.
- There was a slight gain on April 21, 2023, with the share price at $125.44.
- The end of April 2023 saw a minor drop to $125.29.
- The price rose slightly to $126.28 on May 5, 2023, then fell to $123.63 a week later.
- A significant decline happened in May, with the shares valued at just $117.10 on May 19 and further falling to $108.86 on May 26.
- June 2023 brought a bit of recovery, but the price remained largely below $112, closing the month at $112.27.
- The trend in July 2023 hovered around $108 and stayed relatively stable.
- Throughout August 2023, the price gradually decreased, ending the month at $99.88.
- As of the end of September 20, 2023, the share price stands at $94.04.
Overall, the growth rate of NKE share prices observed from the data shows a decelerating trend from late April 2023 through September 20, 2023. Here is a chart of NKE's price over the past 180 days.
Analyzing NIKE's Performance: Insights from POWR Ratings - Quality, Sentiment, and Stability
Based on the provided data, the stock NKE in the Athletics & Recreation category has a POWR Ratings grade of C (Neutral). Here's an overview of NKE's rank in the category over time:
- As of March 25, 2023, NKE's rank in category was #14.
- From April 1 to April 8, 2023, the rank remained steady at #14. However, it improved slightly to #12 for the weeks of April 15 to April 29, 2023.
- In May 2023, there was further improvement, and NKE's rank fluctuated between #10 and #11.
- In June 2023, it alternated between ranks #10 and #11.
- Throughout July 2023, the rank varied slightly more, oscillating between #10 and #13.
- Starting August 5, 2023, there was a slight dip, with the rank going down to #15.
- Between September 2 and September 20, 2023, the rank stood firm at #14.
The latest recorded POWR grade value is C (Neutral) as of September 21, 2023, and the corresponding rank in the category is also #17 out of a total of 37 stocks.
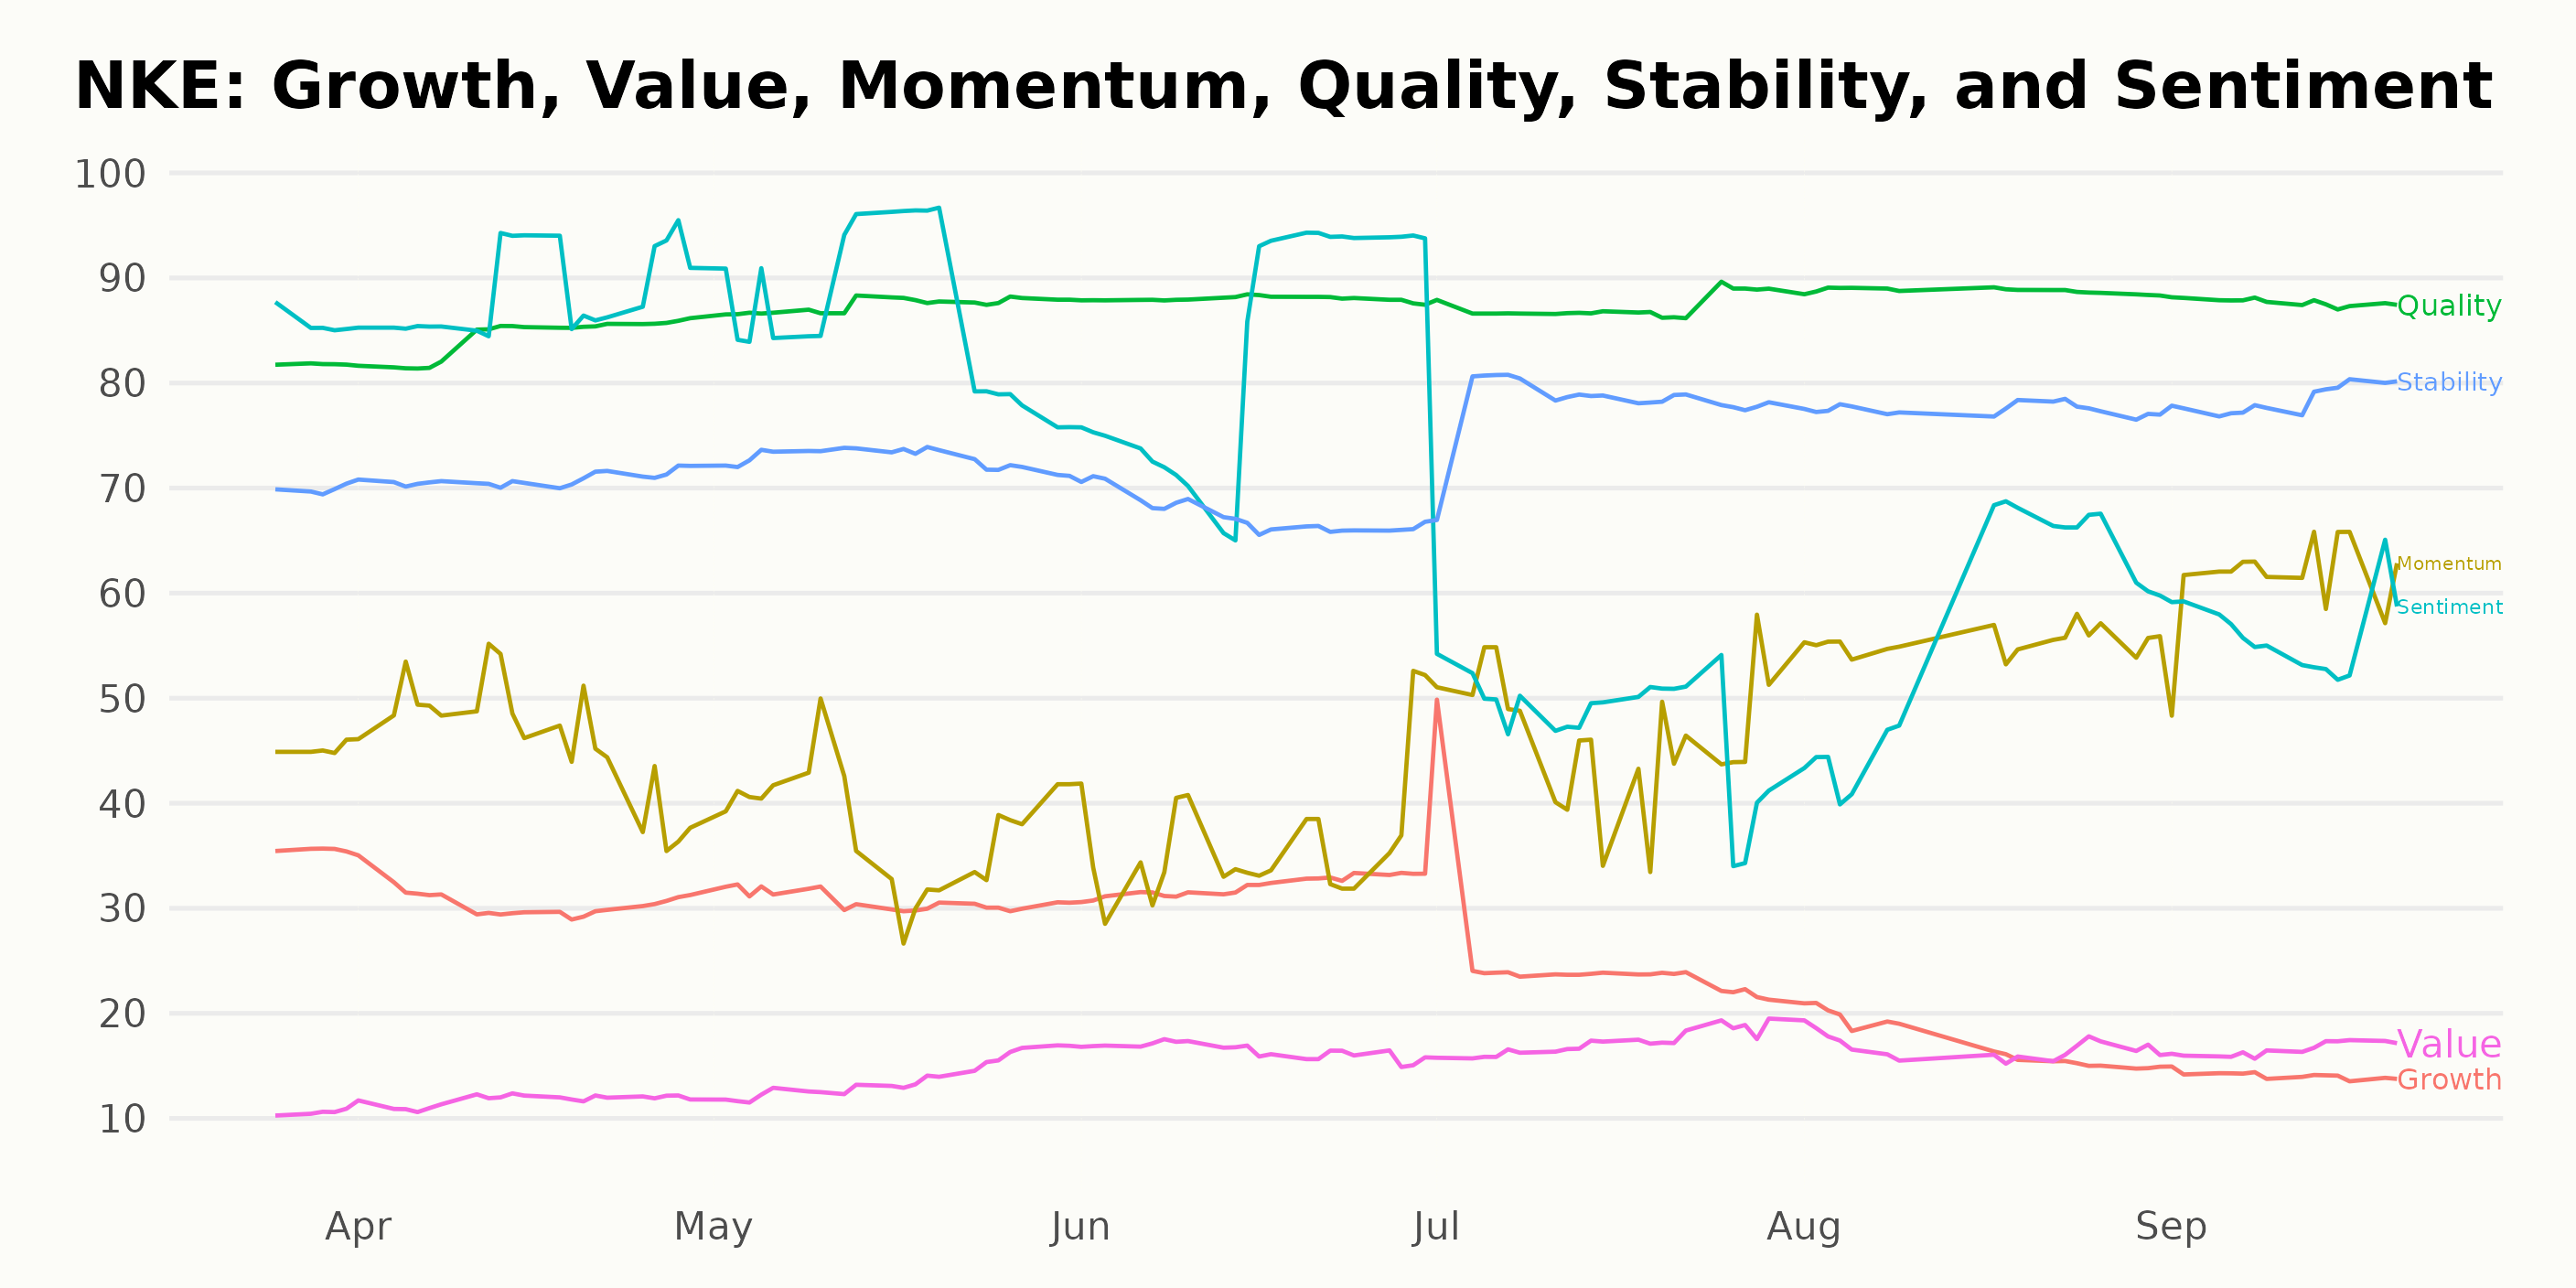
The three most noteworthy dimensions in the POWR ratings for NKE are Quality, Sentiment, and Stability.
- Quality: This has consistently been the highest-rated dimension over several months. Starting from a rating of 82 in March 2023, it improved steadily to reach a peak of 89 by August 2023, maintaining an upward trend during this period. Despite a minor drop in September 2023, Quality still remained the highest-rated dimension for NKE.
- Sentiment: The Sentiment dimension scored highly initially, with a rating of 86 in March 2023. While it did increase to an annual peak of 89 in April 2023, the rating showed signs of volatility. It dropped to 83 by June 2023, rebounded slightly, and then had a significant decrease to 48 in July 2023. Sentiment made slight gains into August and September 2023 but didn't return to its initial high levels.
- Stability: Though not the highest, Stability exhibited a steady increase over time. It started at 70 in March 2023 and ended at 78 in September 2023, showing consistent growth with brief fluctuations along the way.
These dimensions provide useful insight into the performance trends of NKE based on specific criteria. Note, however, that each dimension should be considered in the context of overall performance.
How does NIKE, Inc. (NKE) Stack Up Against its Peers?
Other stocks in the Athletics & Recreation sector that may be worth considering are Marine Products Corporation (MPX), American Outdoor Brands, Inc. (AOUT), and Skechers U.S.A., Inc. (SKX) - they have better POWR Ratings. Click here to explore more Athletics & Recreation sector stocks.
43 Year Investment Pro Shares Top Picks
Steve Reitmeister is best known for his timely market outlooks & unique trading plans to stay on the right side of the market action. Click below to get his latest insights…
Steve Reitmeister’s Trading Plan & Top Picks >
NKE shares were trading at $92.42 per share on Thursday afternoon, down $1.62 (-1.72%). Year-to-date, NKE has declined -20.26%, versus a 14.72% rise in the benchmark S&P 500 index during the same period.
About the Author: Anushka Dutta

Anushka is an analyst whose interest in understanding the impact of broader economic changes on financial markets motivated her to pursue a career in investment research.
The post How Stable Is NIKE (NKE) Stock? appeared first on StockNews.com