


Last month retail sales surpassed Wall Street estimates indicating resiliency in US consumer spending. Retail sales rose 0.7% in July from the previous month, more than Wall Street’s estimates for 0.4% growth. Amid upbeat retail spending, big-box retailer Target Corporation (TGT) stock could be worth buying this week.
Although the company missed sales expectations in its most recent quarter, its earnings beat the consensus estimate. The retailer’s profits rebounded, with net income rising to $835 million, or $1.80 per share, from $183 million, or 39 cents per share, a year earlier. Refinitiv consensus EPS estimate was $1.39.
TGT’s profitability had taken a hit last year amid the macro headwinds. “We had talked about this year being a really important year in terms of building back the profitability of the business, and for the team to take a big step forward in the second quarter in spite of softer-than-expected sales is really great progress on that journey,” Chief Financial Officer Michael Fiddelke said.
Furthermore, TGT has an impressive record of 54 consecutive years of dividend growth. The company’s dividend payments have grown at a 17.7% CAGR over the past three years and an 11.7% CAGR over the past five years. Its annual dividend of $4.40 per share yields 3.38% on the current share price.
In addition, with TGT trading at a lower valuation compared to industry peers, potential investors may enjoy a reasonable entry point. Its forward EV/Sales of 0.72x is 57.1% lower than the industry average of 1.69x. Also, its forward P/E multiple of 17.08 compares with the industry average of 19.43.
Now let’s delve further into TGT’s key financial metrics and trends.
Analyzing Target Corporation’s Fluctuating Financial Indicators from 2020-2023
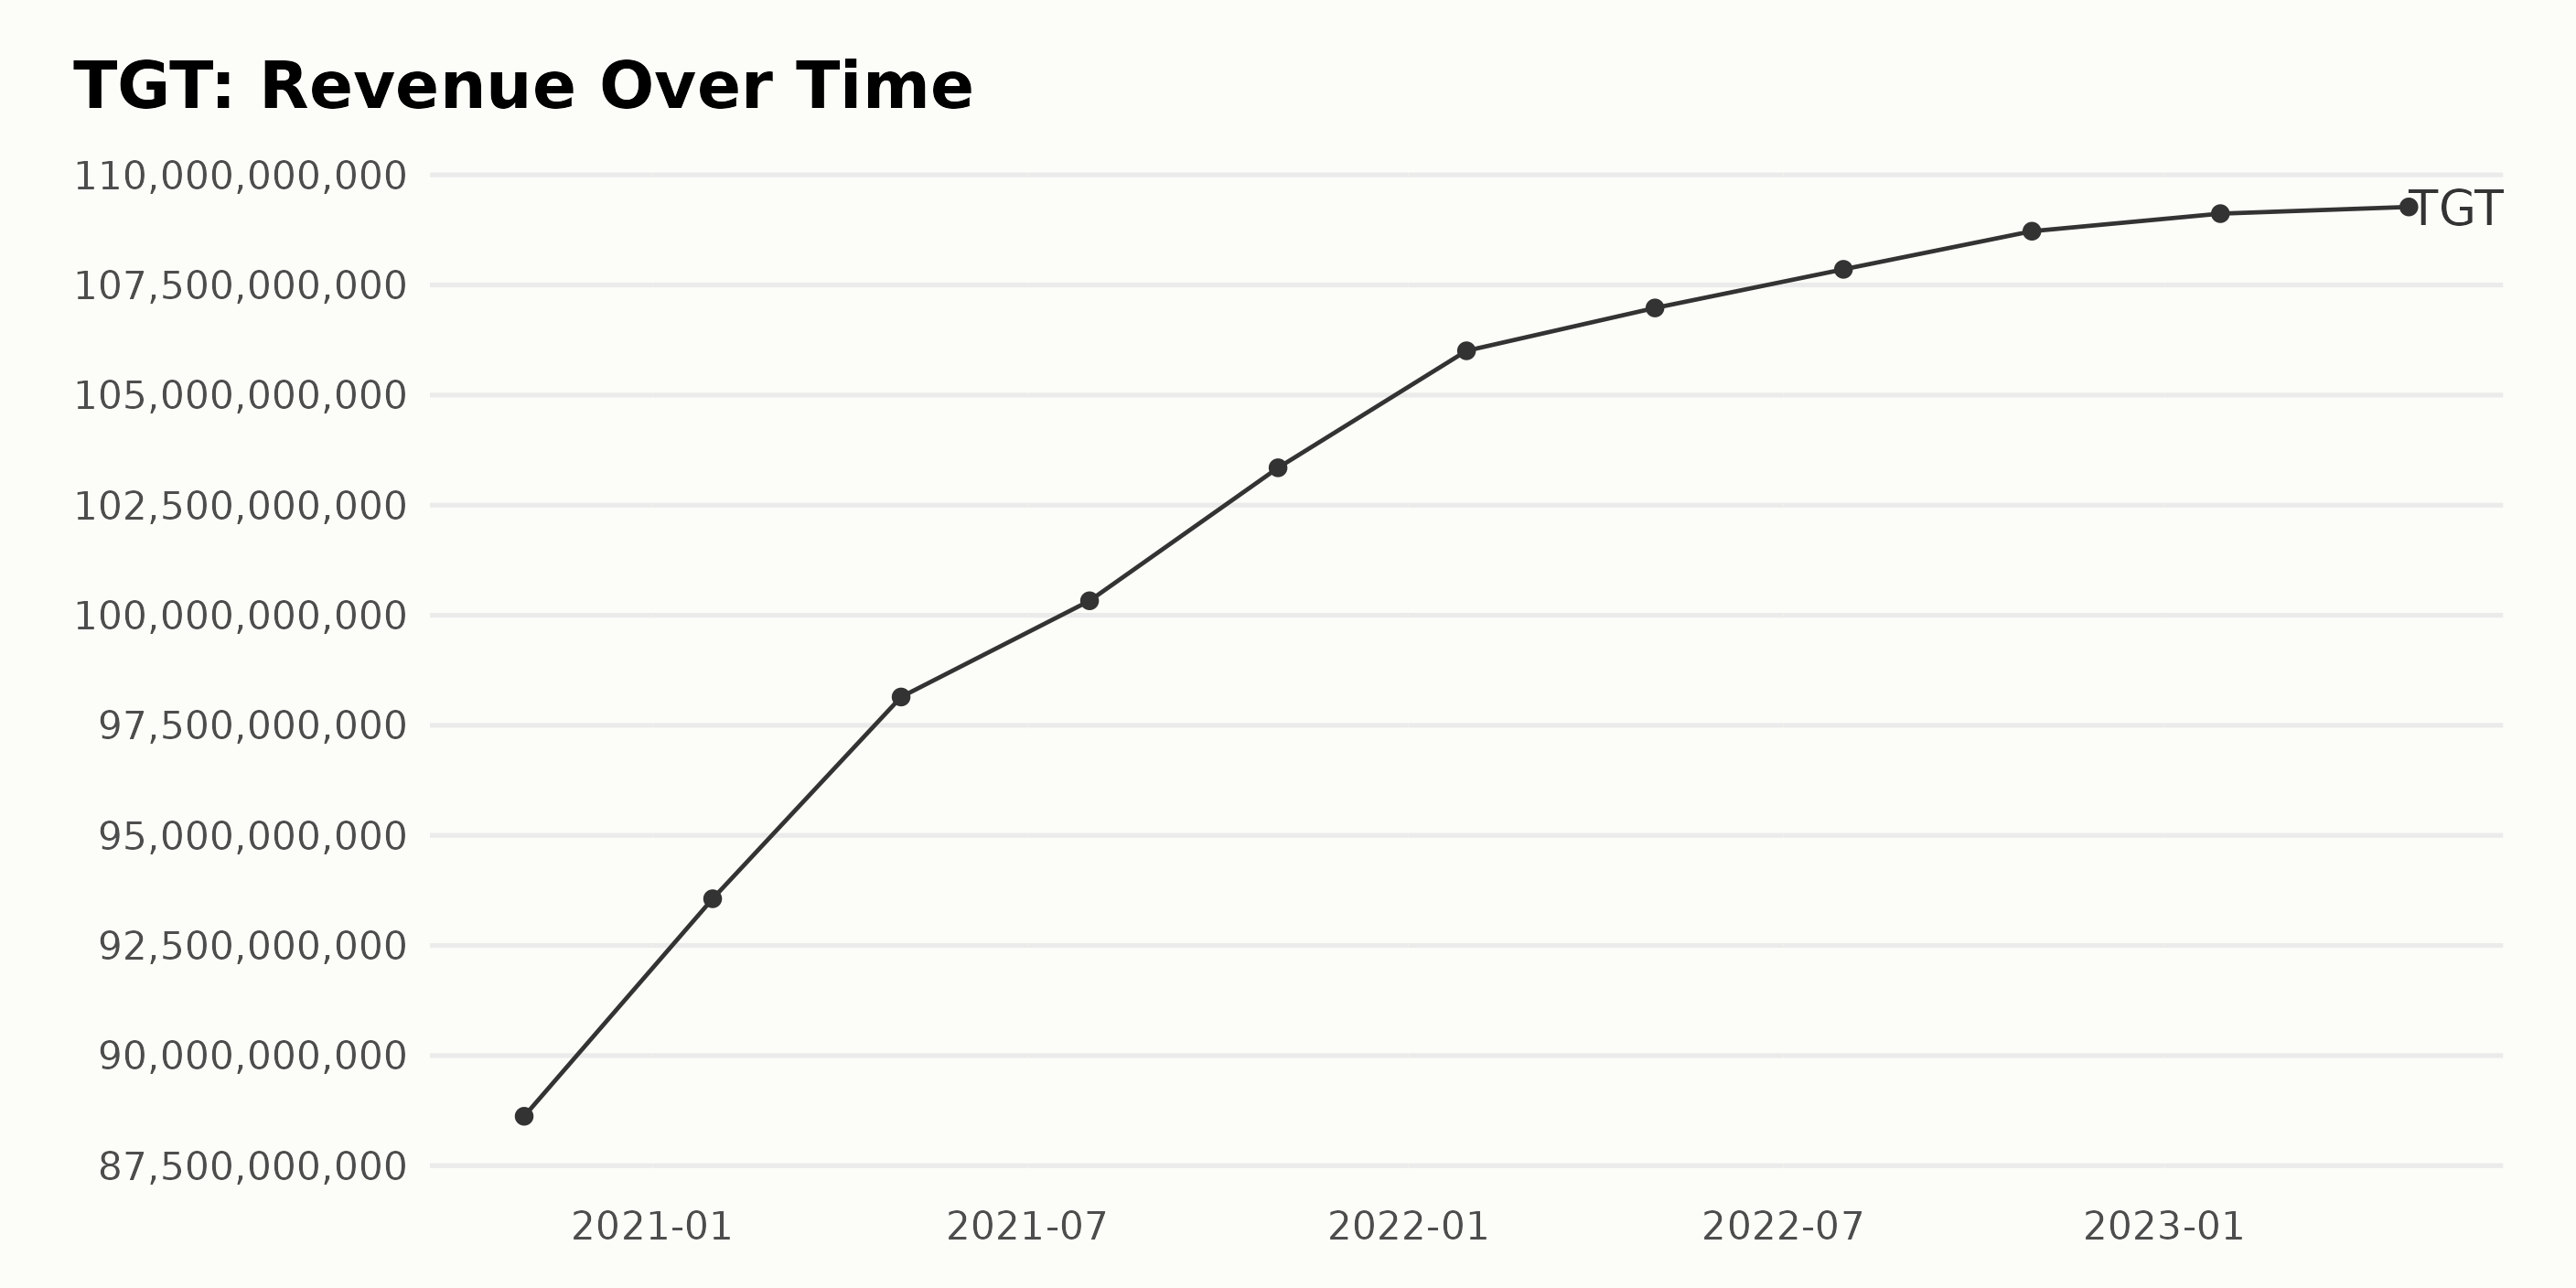
- As of October 2020, TGT’s reported a trailing-12-month revenue of $88.62 billion.
- There was a steady increase in TGT’s revenue up until January 2021, when the corporation saw a noticeable jump to $93.56 billion.
- The trend continued to show a steady upward trajectory, with revenue at $98.14 billion in May 2021 and a further rise to $100.33 billion by July 2021.
- By October 2021, the revenue had increased to $103.35 billion, showing consistent growth across the year.
- In January 2022, the revenue experienced a significant increase reaching $106 billion. However, the climb began to slow down after this point, with only slight increases each quarter, reaching $106.98 billion in April 2022 and $107.86 billion by the end of July 2022.
- In October 2022, the revenue for TGT continued to grow modestly to $108.72 billion; by January 2023, it reached $109.12 billion.
- The final data point shows a minimal increase to $109.27 billion in April 2023.
Overall, the reported revenue of TGT demonstrated a consistent upward trend from October 2020 to April 2023. Over this period, the revenue grew from $88.62 billion to $109.27 billion, signifying an estimated growth rate of around 23.26%.
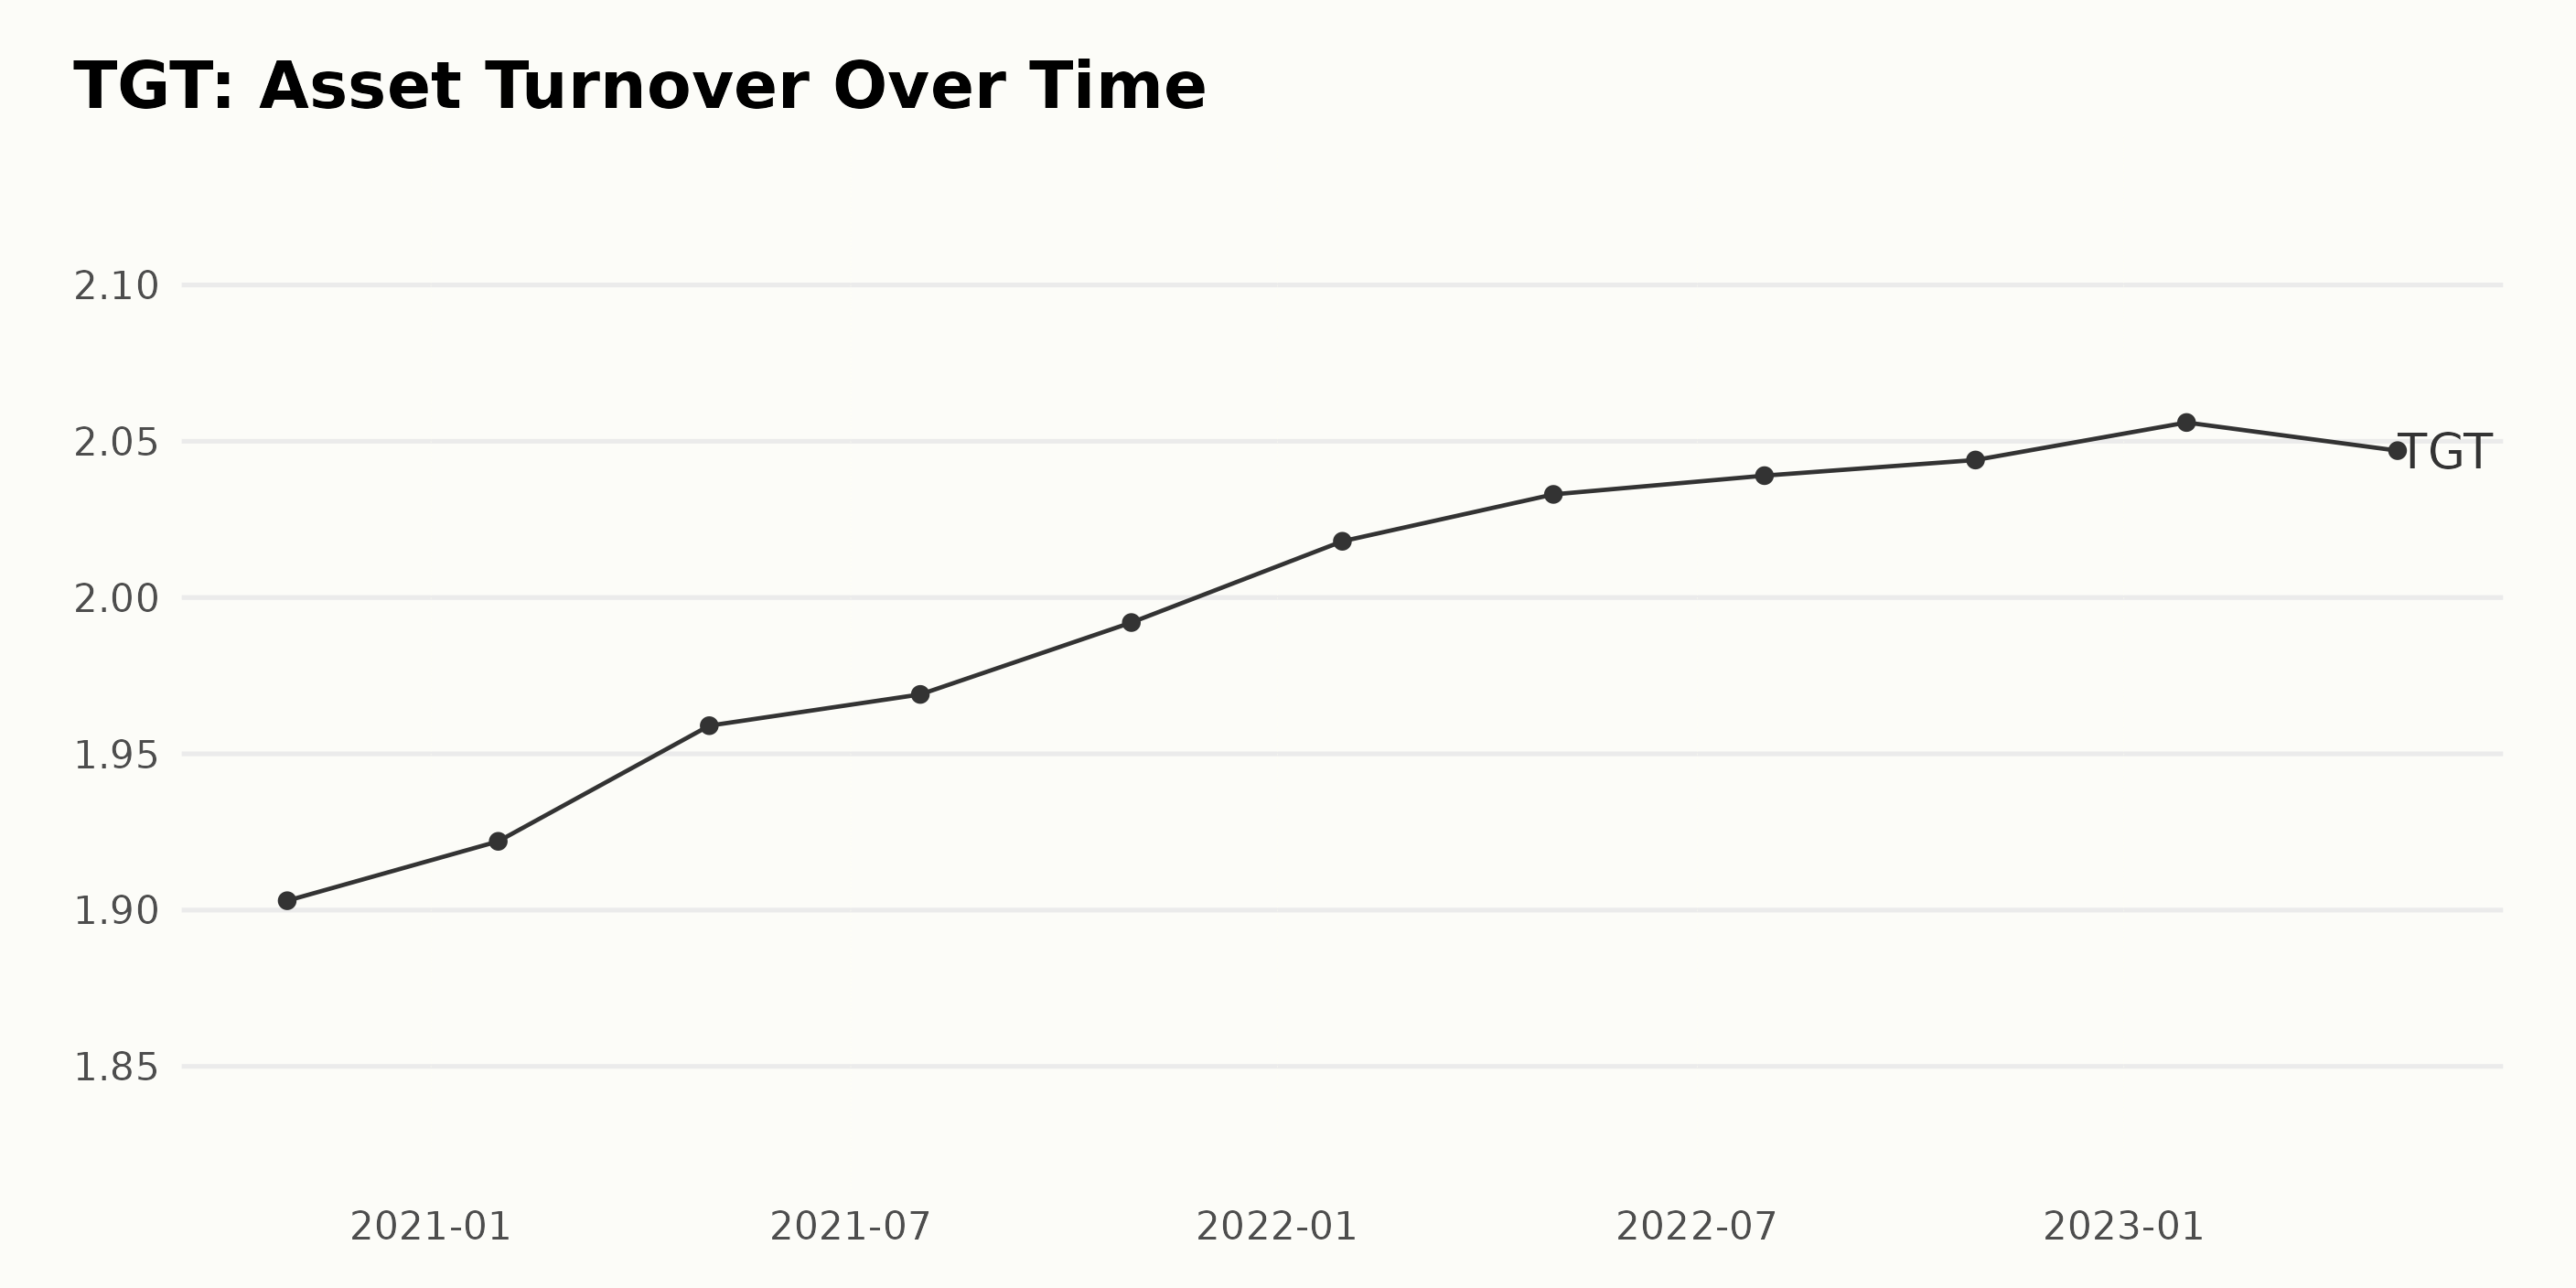
The Asset Turnover data TGT shows a consistent trend of rising over the period from October 2020 to April 2023, with a slight dip noticed in the final reported month.
- The asset turnover value started at 1.90, as measured in October 2020.
- Consistent growth was observed in the asset turnover, averaging a rate of growth of approximately 0.01 per quarter.
- By January 2022, the asset turnover value had increased to 2.02, marking an upward movement.
- In the most recent data from April 2023, it increased slightly from its previous quarter, coming in at 2.05.
On the whole, the asset turnover of TGT has seen a growth of 7.7% between October 2020 and April 2023. This implies that the company’s efficiency in using its assets to generate sales has improved over the period under review.
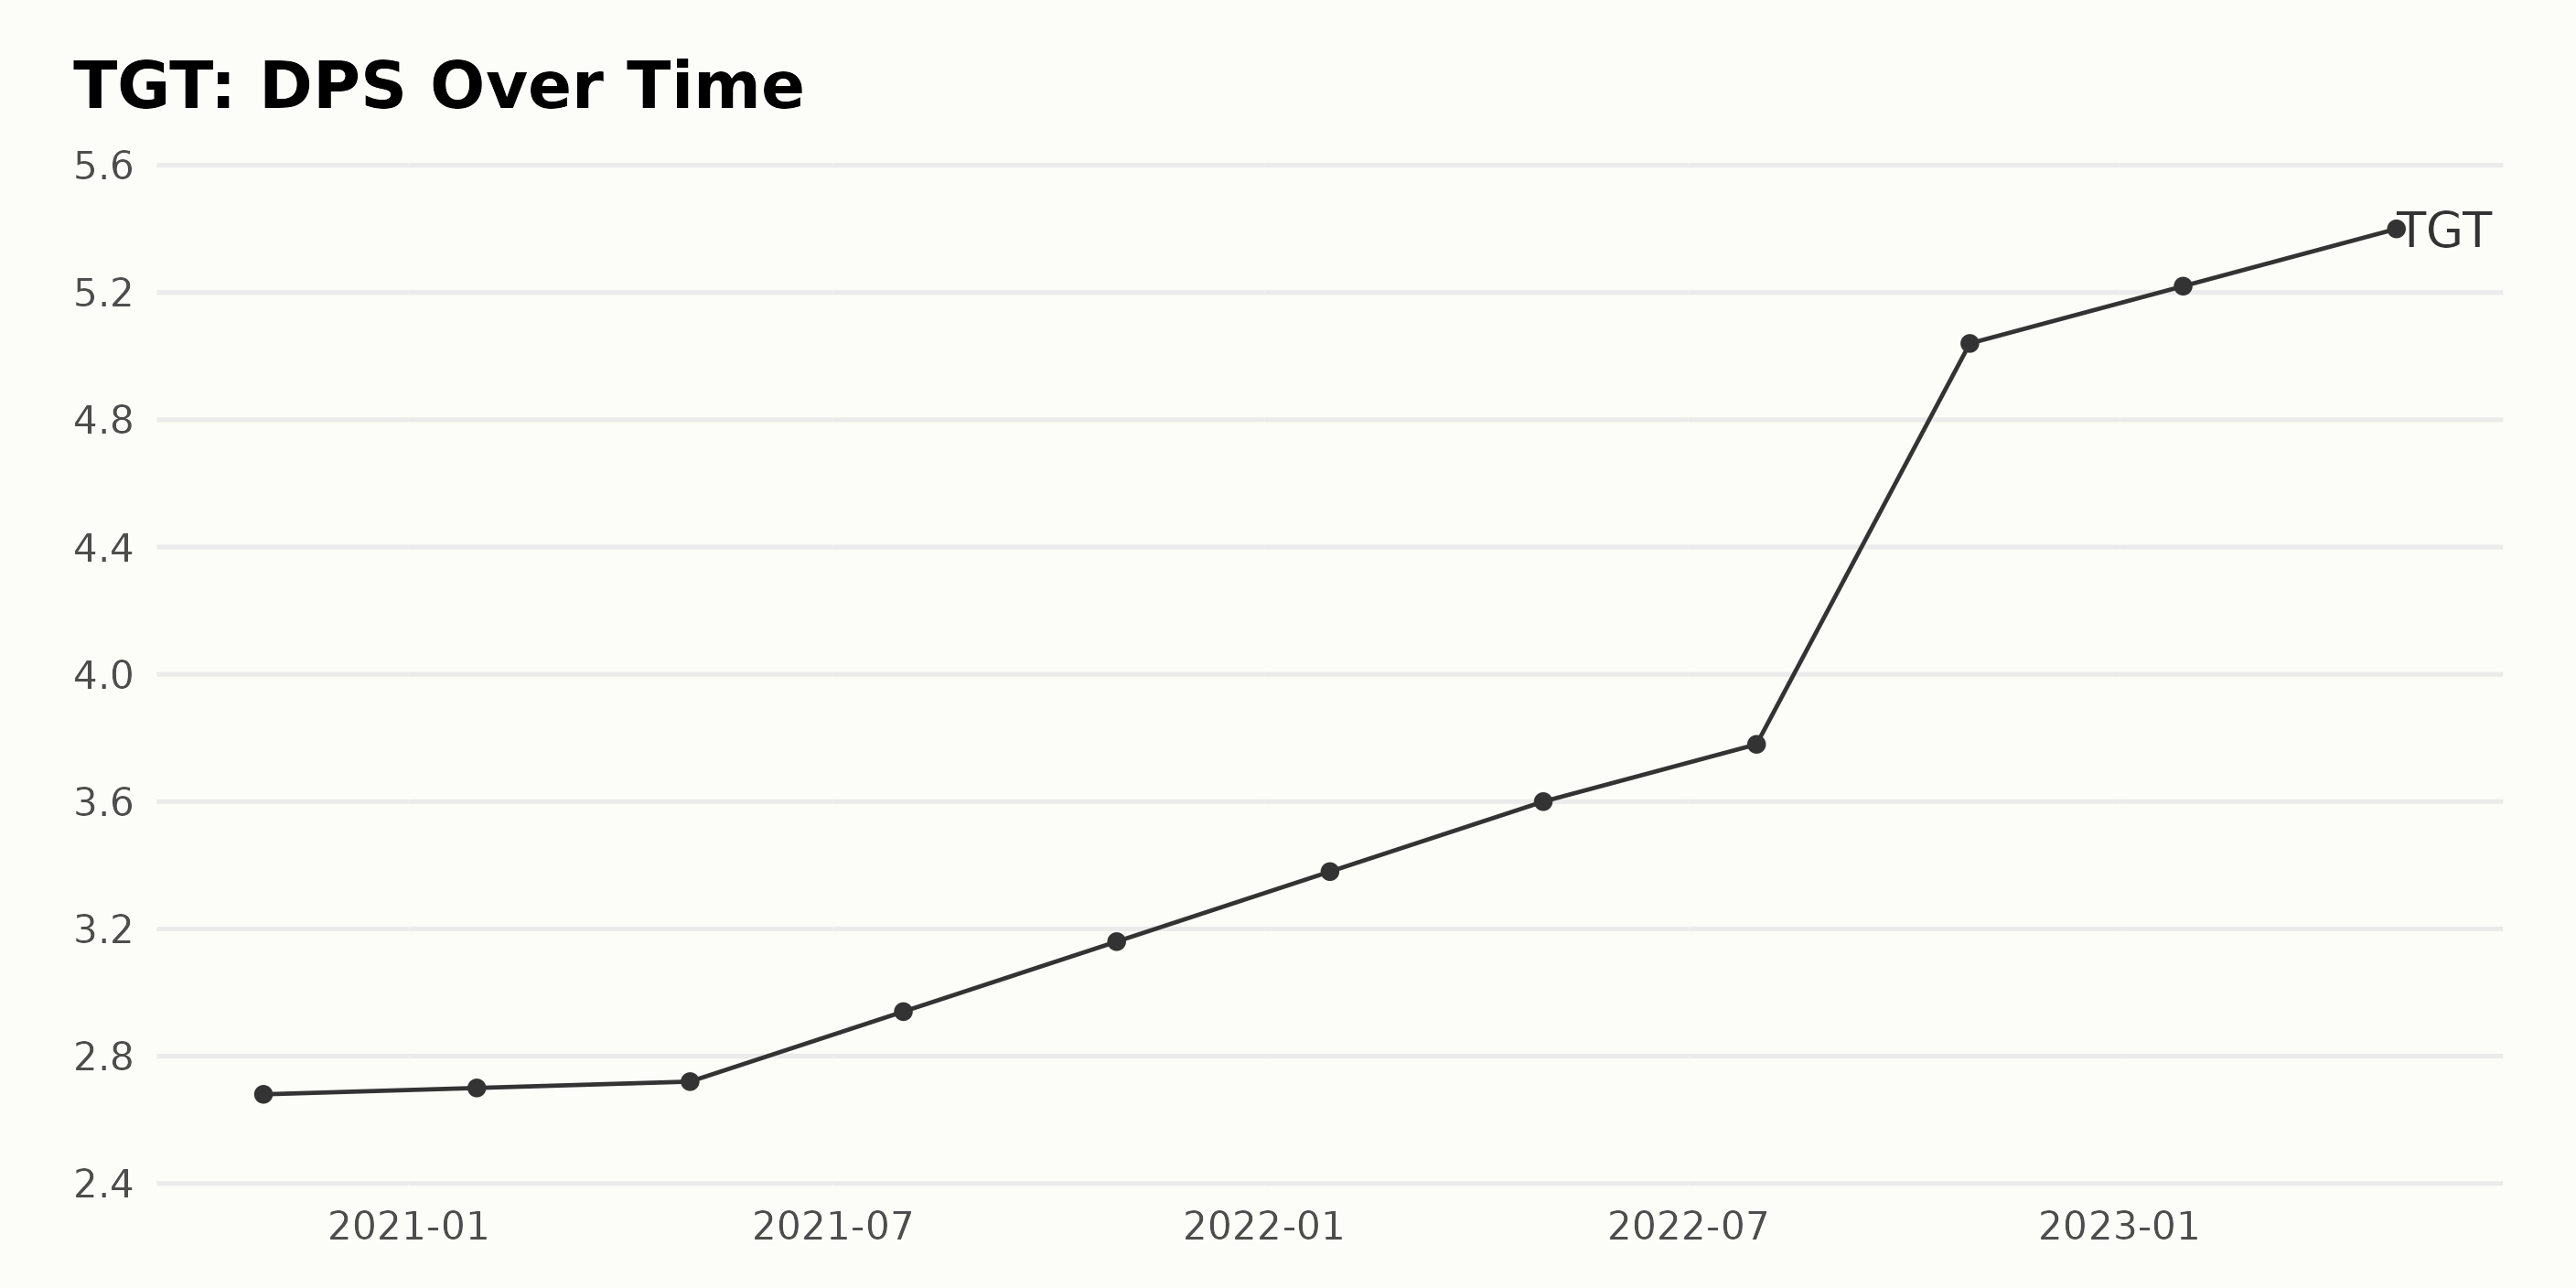
Based on the provided data, the following summarises the Dividend Per Share (DPS) trend and fluctuations for TGT.
- On October 31, 2020, TGT’s DPS was $2.68.
- There was a minor increment to the DPS at the start of 2021, reported as $2.7 on January 30, 2021.
- The DPS continued its incremental rise during 2021, with values at $2.72 in May, $2.94 in July, and ending the year at $3.16 in October 2021.
- The growth pattern persisted through 2022, with the DPS increasing gradually from $3.38 in January, then $3.6 in April, before reaching $3.78 in July 2022.
- A significant jump is noticed by October 2022, with the DPS hitting $5.04, followed by a slight increase to $5.22 in January 2023.
- The latest recorded DPS, as of April 29, 2023, stands at $5.4.
In general, the DPS of TGT has displayed a steady upward trend over the observed period. From October 2020 ($2.68) to April 2023 ($5.4), the growth rate represents an approximate 101.5% increase, emphasizing a more than doubling of the DPS value in just over two and a half years. The most dramatic rise is noticed between July and October 2022, where the DPS soared by around 33%, representing the highest growth within this period. The emphasis on recent data suggests continued growth, although at a slower pace than the sharp increase experienced in late 2022.
Examining TGT’s Share Price Performance
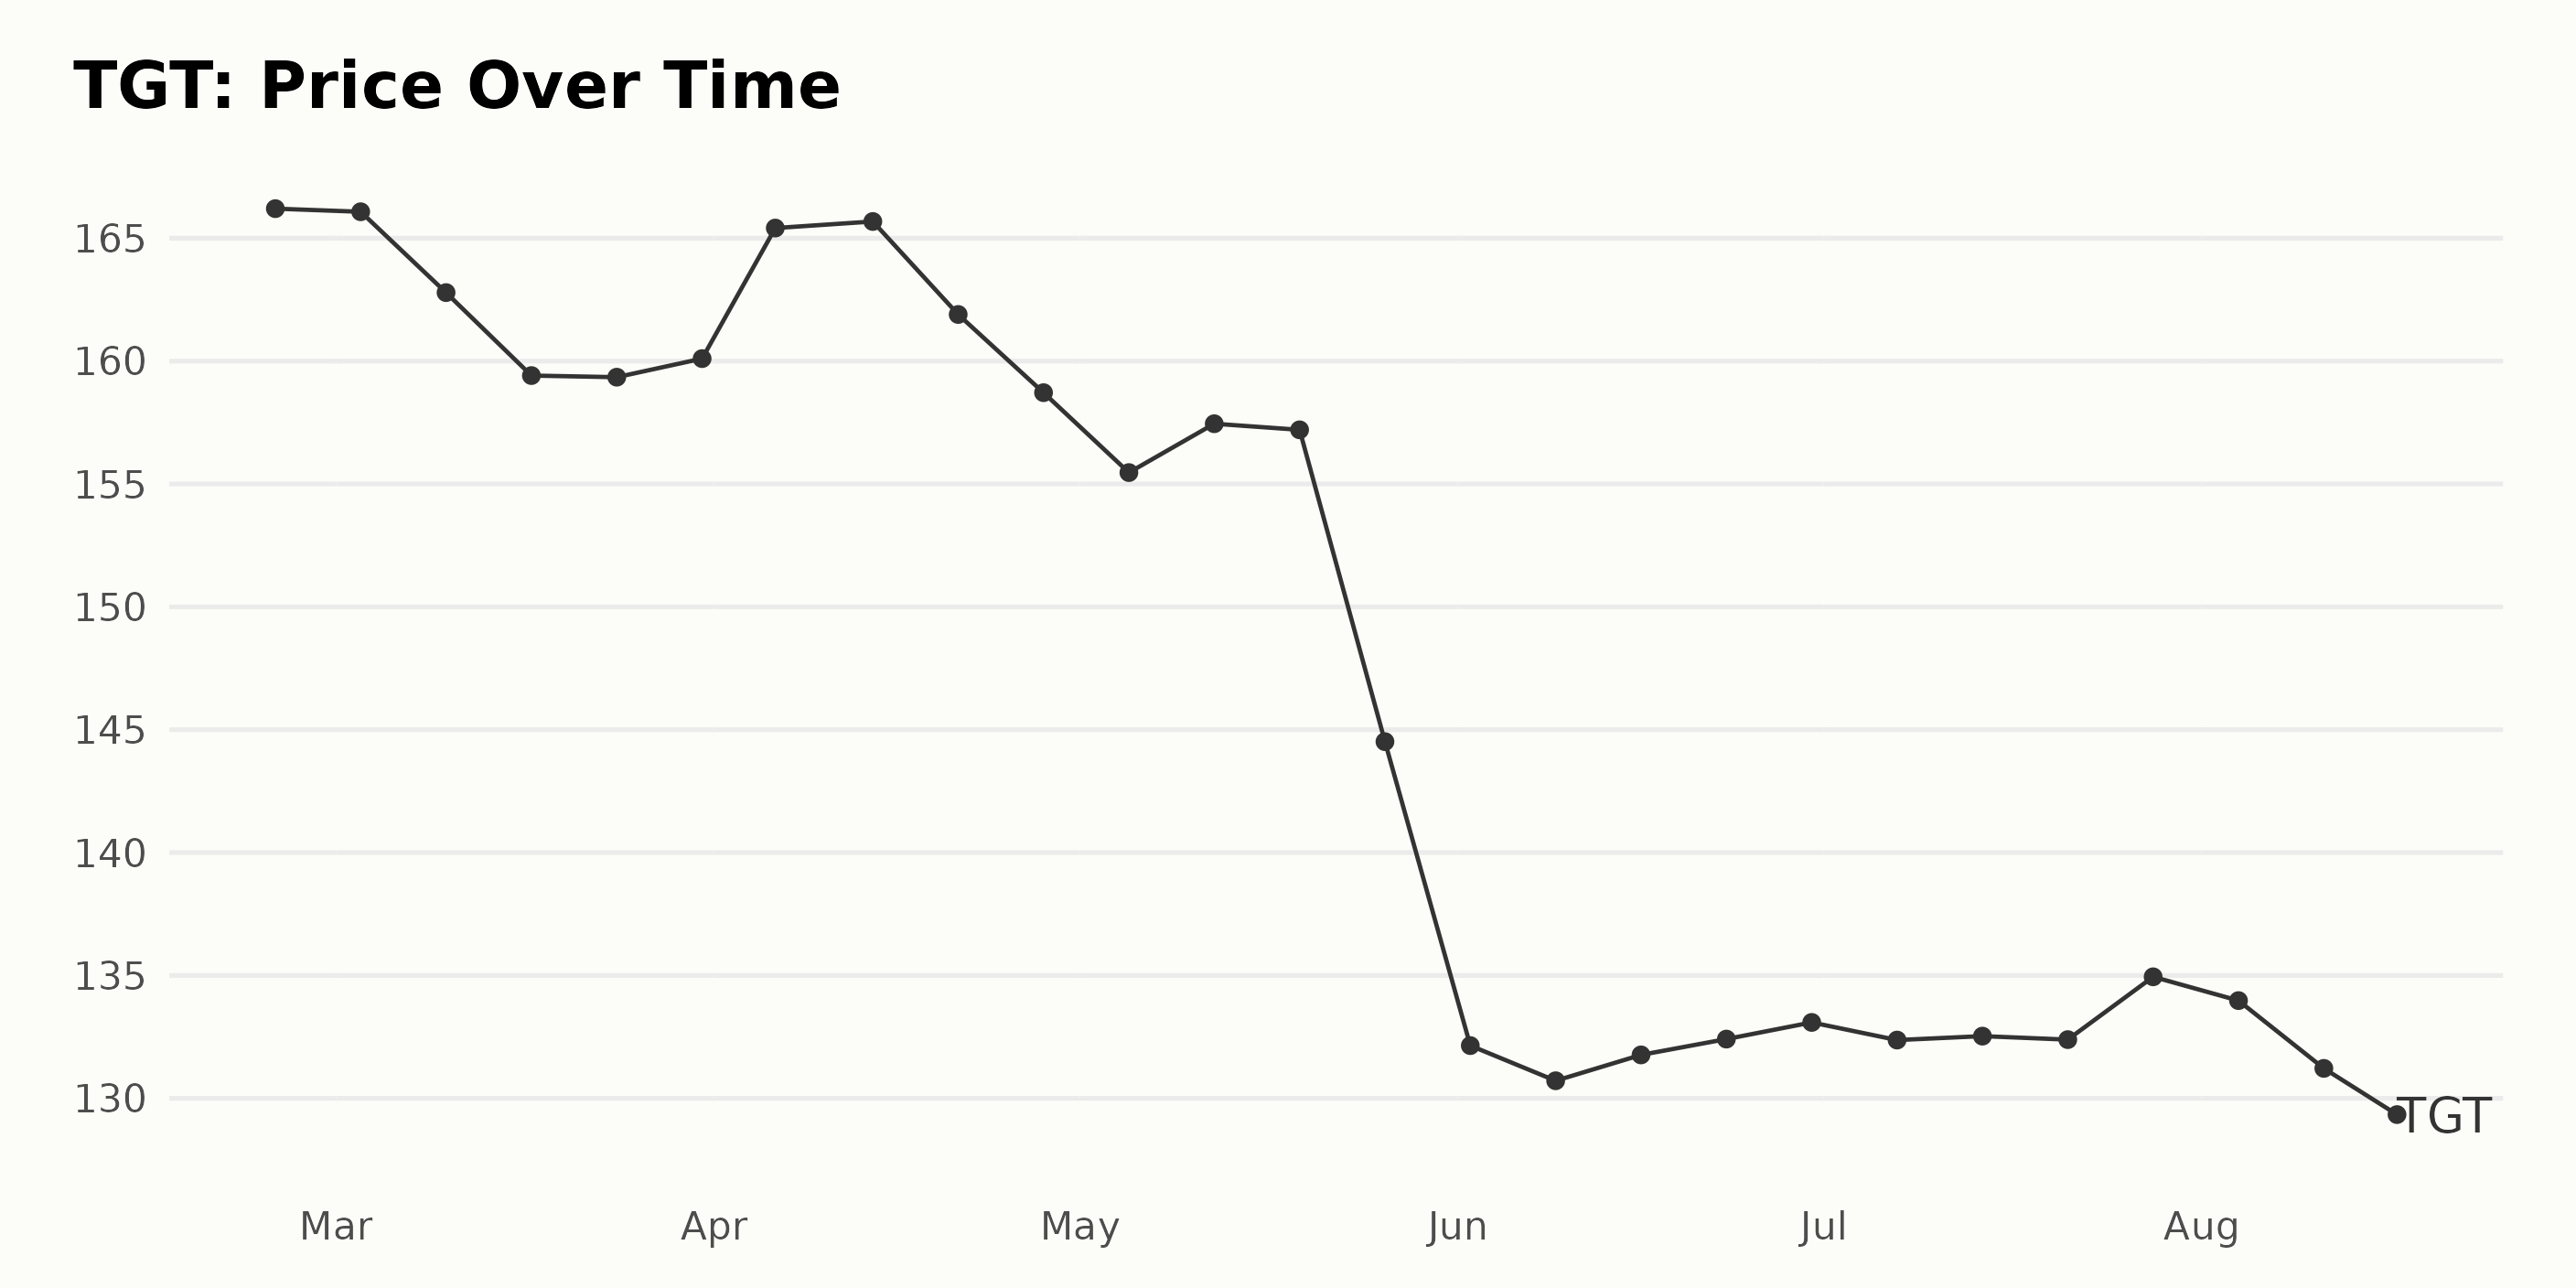
The following points illustrate the trend and growth rate of TGT’s share price between February 24, 2023, and August 17, 2023:
- There was a slight decrease in the share price from $166.21 on February 24, 2023, to $166.08 on March 3, 2023.
- Then there was a steady decline in the share price till the end of March 2023, reaching a value of $160.10.
- The share price then increased in the first two weeks of April 2023, peaking at approximately $165.68 on April 14, 2023.
- After this peak, there was a continuous decelerating trend until May 26, 2023, when it hit a value of $144.51. This was a significant drop compared to the previous month.
- In the first week of June 2023, it further dropped to $132.15. From then onwards, there’s a period of stability until the end of July 2023, with the price hovering around $132-$134.
- The share price started declining again in August, ending at $130.11 by August 17, 2023. Overall, the share price of TGT demonstrated a clear decelerating trend over this period. Here is a chart of TGT’s price over the past 180 days.
Decoding TGT’s Performance: Insights from Value, Growth, and Momentum Dimensions
TGT has an overall B rating, translating to a Buy in our POWR Ratings system. It is ranked #26 out of the 37 stocks in the Grocery/Big Box Retailers category.
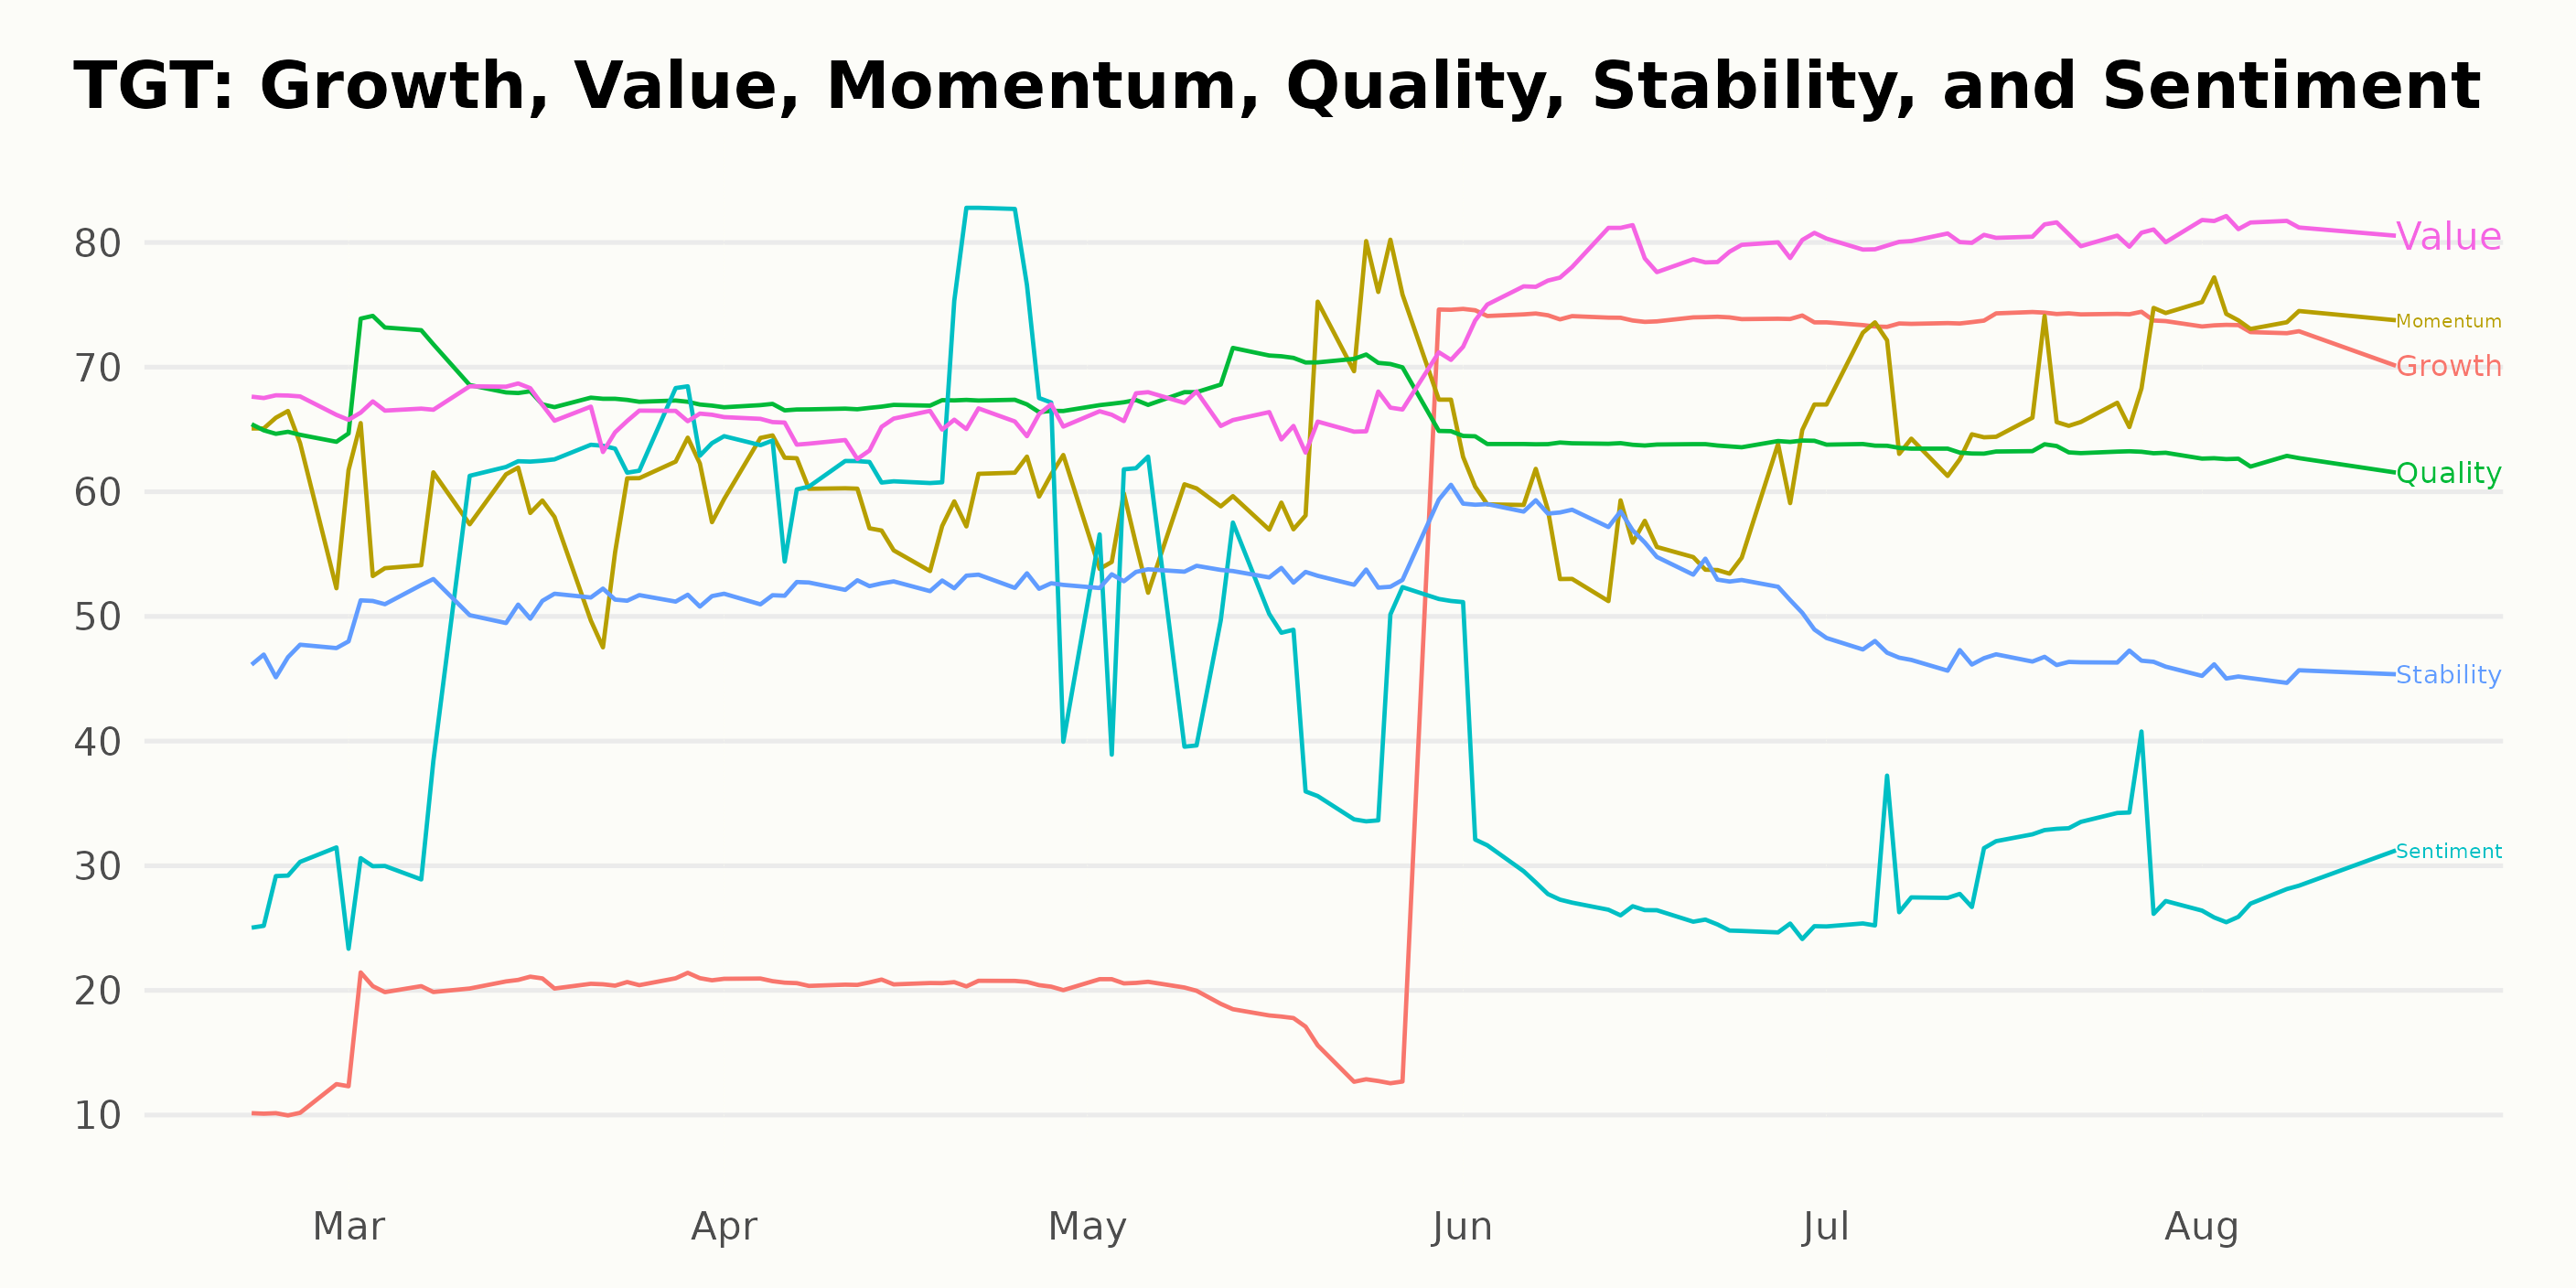
The POWR Ratings for TGT provide insightful data that outlines the company's performance along various dimensions. Upon analyzing the dataset, it is apparent that the three most noteworthy dimensions are Value, Growth, and Momentum.
- Value: The Value dimension has consistently high ratings from February to August 2023 - starting with a rating of 67 in February before finally peaking at 81 by August. This trend indicates that TGT exhibits strong value characteristics.
- Growth: The Growth dimension shows an interesting upward trend. It starts at a low rating of 11 in February 2023 but displays a massive surge to hit 74 by June 2023 and largely maintains this improvement with a slight dip to 73 in August 2023. This suggests a significant increase in TGT’s growth potential over this period.
- Momentum: Throughout the observed period, Momentum scores fluctuate initially but then demonstrate a notable increase. From a rating of 63 in February 2023, it declines to a low point of 58 by March and June but then increases to a high of 74 in August. This reveals a growing momentum in TGT’s performance towards the second half of 2023.
These trends in the Value, Growth, and Momentum dimensions over time offer a robust picture of TGT’s performance over this period and could serve as valuable indicators for investment decisions.
How does Target Corporation (TGT) Stack Up Against its Peers?
Other stocks in the Grocery/Big Box Retailers sector that may be worth considering are Natural Grocers by Vitamin Cottage Inc. (NGVC), Village Super Market Inc. (VLGEA), and RYOHIN KEIKAKU CO., LTD. (RYKKY) -- they have better POWR Ratings.
43 Year Investment Pro Shares Top Picks
Steve Reitmeister is best known for his timely market outlooks & unique trading plans to stay on the right side of the market action. Click below to get his latest insights…
Steve Reitmeister’s Trading Plan & Top Picks >
TGT shares fell $0.13 (-0.10%) in premarket trading Friday. Year-to-date, TGT has declined -11.08%, versus a 14.36% rise in the benchmark S&P 500 index during the same period.
About the Author: Subhasree Kar

Subhasree’s keen interest in financial instruments led her to pursue a career as an investment analyst. After earning a Master’s degree in Economics, she gained knowledge of equity research and portfolio management at Finlatics.
The post How Should Investors Approach Target (TGT) This Week? appeared first on StockNews.com