


Robinhood Markets, Inc. (HOOD) has successfully captured the attention of a substantial user base, particularly among younger and less-experienced investors. Its user-friendly platform and commission-free trading have revolutionized how people participate in financial markets.
Nonetheless, the company is navigating challenges stemming from the regulatory crackdown on cryptocurrencies. These pressures have added complexity to HOOD’s operations and pose potential hurdles to its continued growth and success in the industry.
In recent months, the U.S. Securities and Exchange Commission (SEC) has been actively targeting cryptocurrency companies, including Binance, Coinbase Global Inc, (COIN), etc. The SEC’s primary concern revolves around the classification of non-bitcoin cryptocurrencies as securities. They have taken action against crypto platforms for offering unregistered securities to investors.
Moreover, the company’s crypto-currency based transaction revenue declined 1% to $38 million in the fiscal first quarter that ended March 31, 2023. Also, the company’s May operating data shows that its total crypto trading volumes declined 43% month-over-month and 68% year-over-year.
Let’s look at the trends of some of its key financial metrics to understand why it could be wise to avoid the stock now:
HOOD’s Financial Performance: Analyzing Net Income, P/S Ratio, Gross Margin, Current Ratio, and Asset Turnover Ratio:
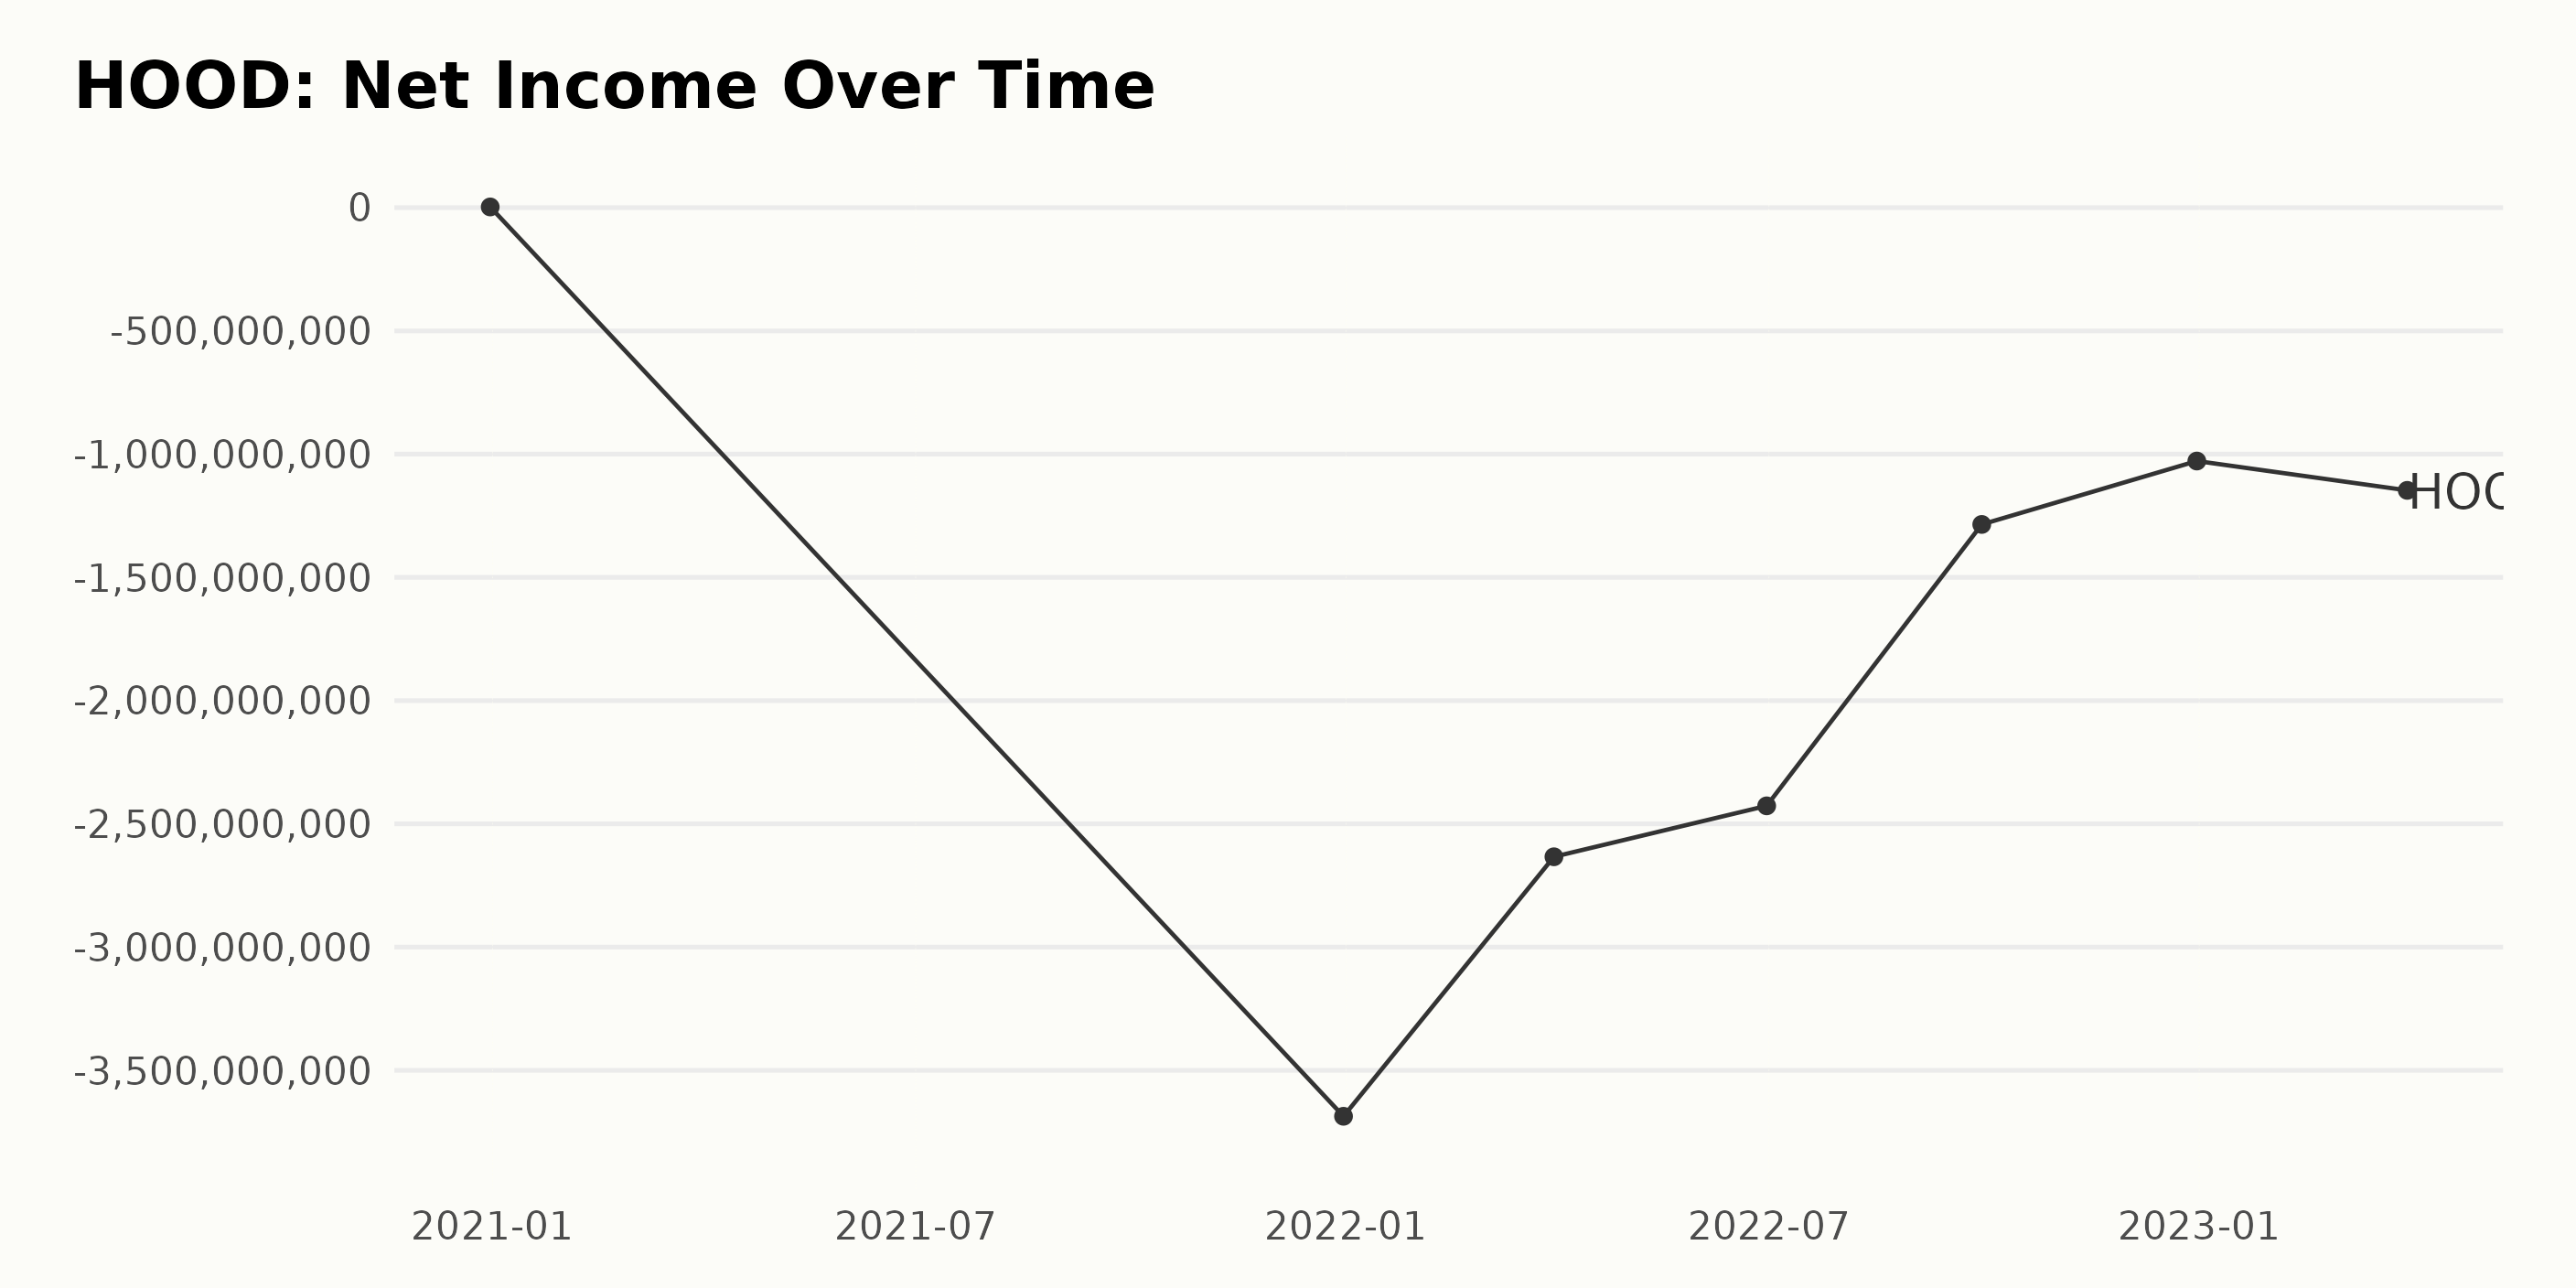
The trend and fluctuations in the trailing-12-month net income of HOOD over the given period warrant some attention.
- At the beginning of the observed period, on December 31, 2020, HOOD’s net income stood at $2.85 million.
- Subsequently, HOOD reported a significant decline - its net income dropped to -$3.69 billion by the end of 2021.
- Throughout 2022, while HOOD kept experiencing negative net income, an improvement was seen.
- By the end of the first quarter(March 31, 2022), the net income was -$2.63 billion.
- At the end of the second quarter (June 30, 2022), HOOD’s net income further decreased to -$2.43 billion.
- The third quarter ended with the net income being negative $1.29 billion (September 30, 2022).
- The last value recorded for the year 2022, on December 31, stood at negative $1.03 billion.
- In the first quarter of 2023 (March 31, 2023), HOOD saw a further decline in its net income as compared to the end of 2022, going down to a negative $1.15 billion.
In terms of growth rate, measuring the last value from the first, there is a stark decrease. While the company started from a modest positive net income of $2.84 million in late 2020, the latest recorded value shows a net loss of $1.15 billion in early 2023.
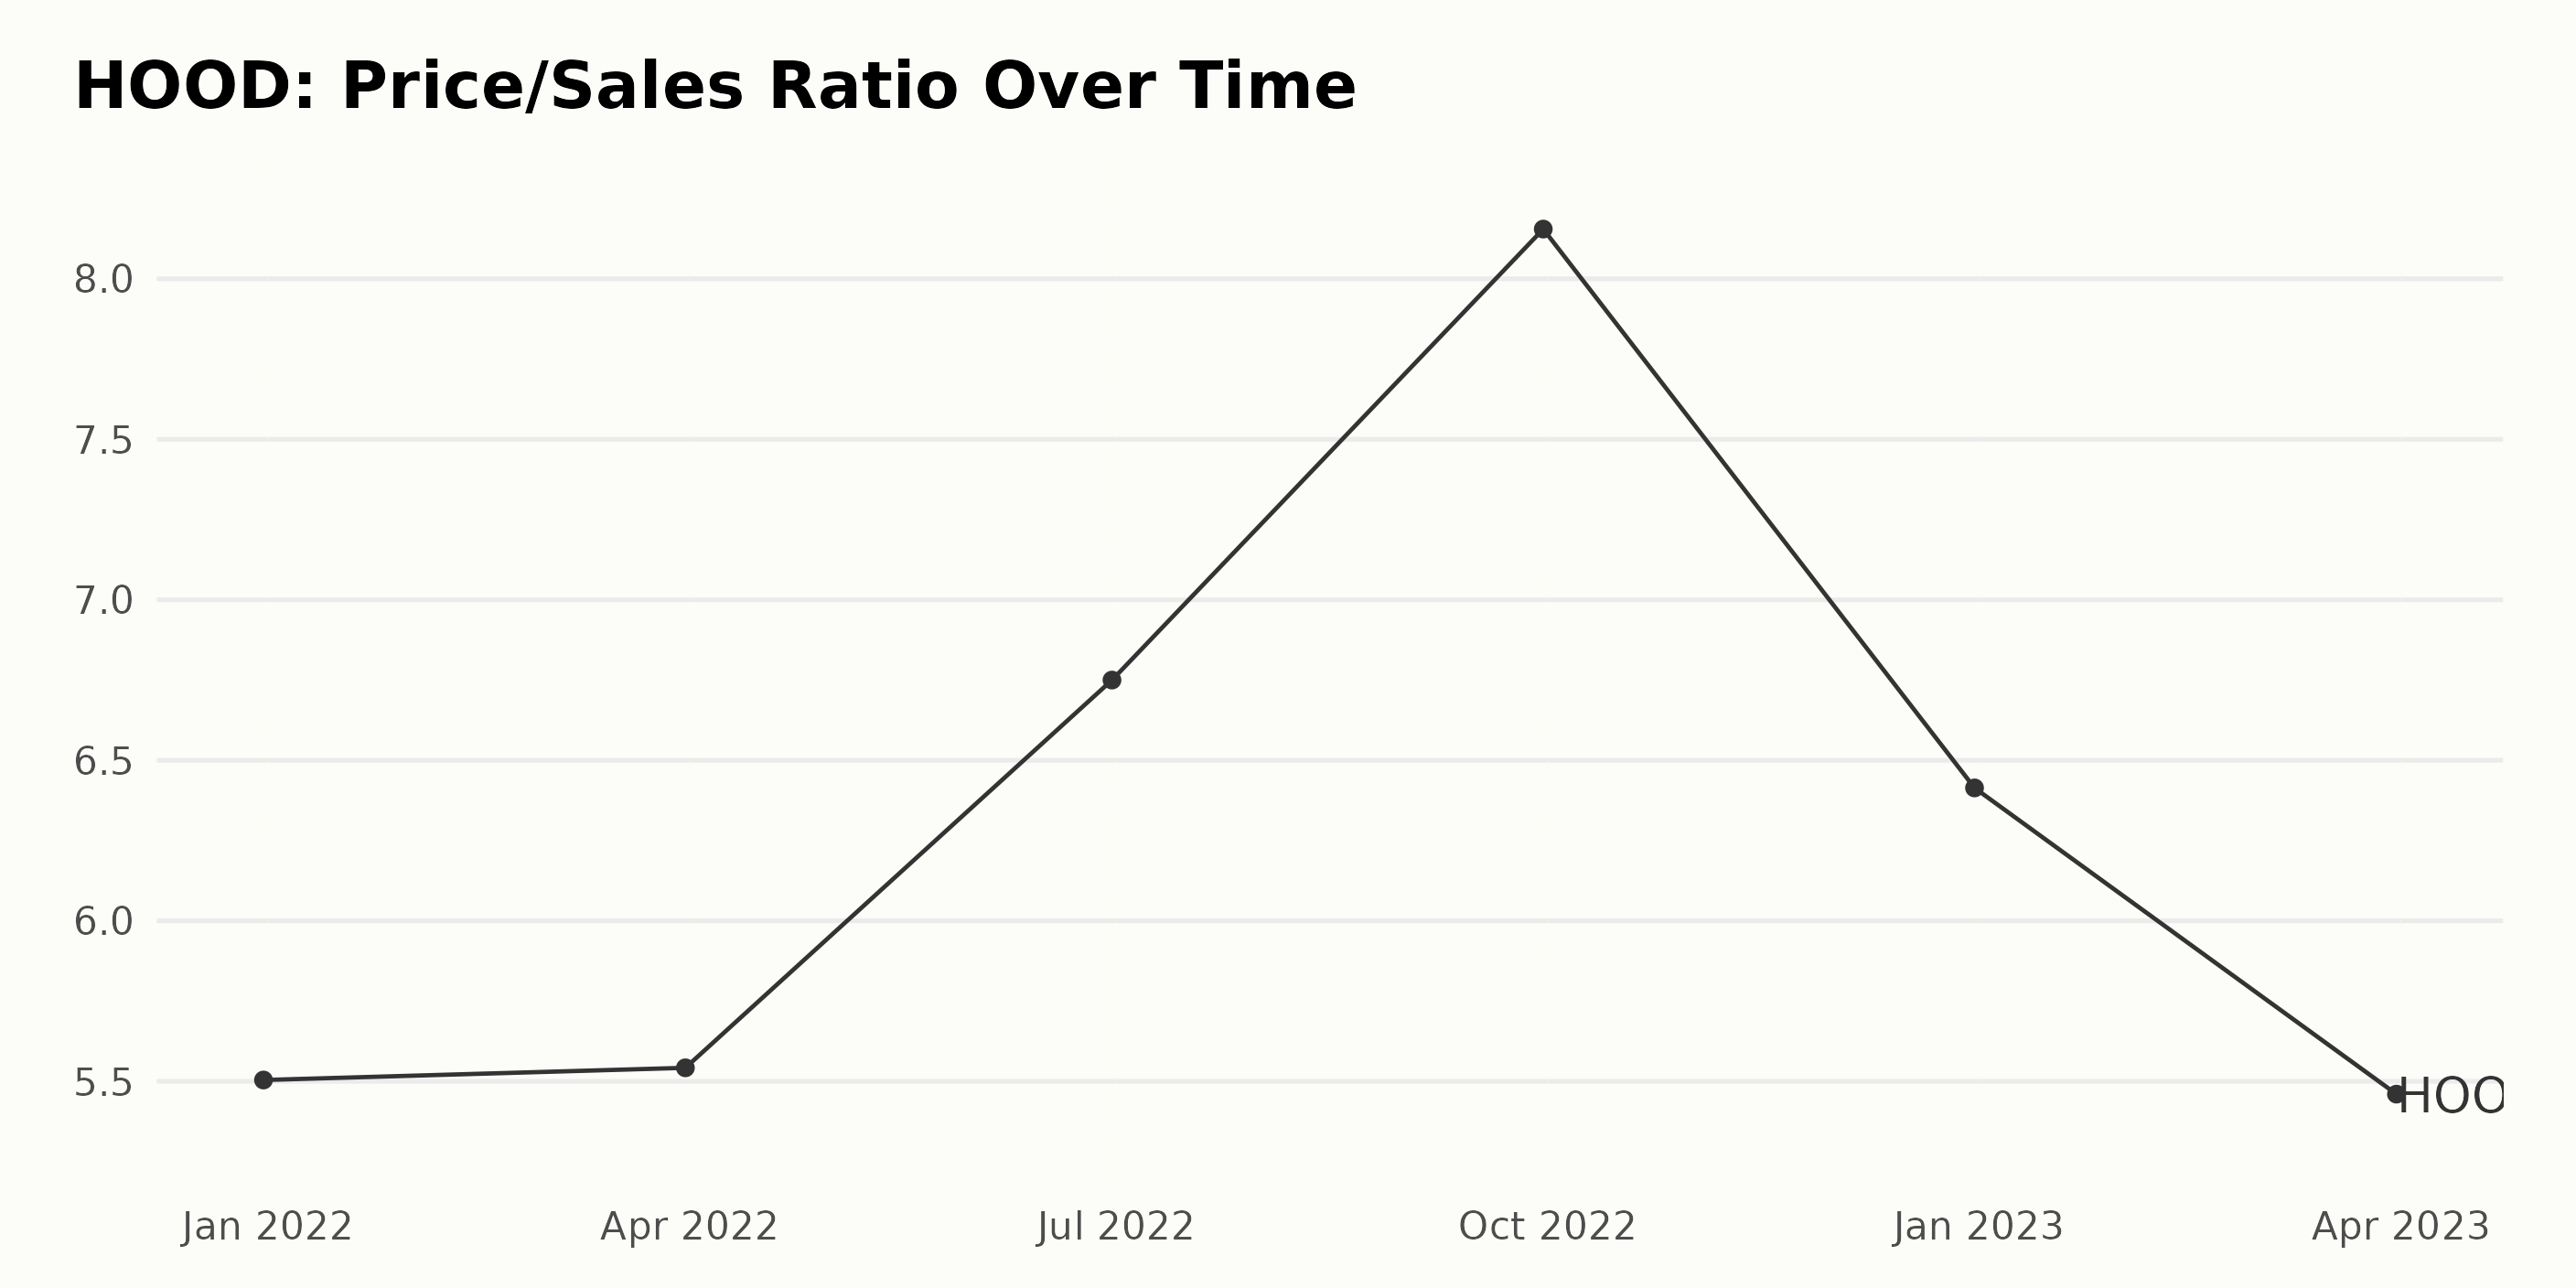
The Price/Sales Ratio (P/S) of the publicly traded US company HOOD has shown both an overall increasing trend and notable fluctuations throughout the evaluated period, from December 31, 2021, to March 31, 2023. Key points:
- The P/S of HOOD started at 5.50 on December 31, 2021.
- There was a marginal increase over the subsequent quarter, reaching 5.54 by March 31, 2022.
- Expandingly, the highest value observed during this period occurred on September 30, 2022, when the P/S climbed to 8.16, a notable jump from the previous quarter.
- This peak was followed by a decline, with the ratio ending at 5.46 on March 31, 2023.
- The calculated growth rate for the entire period, from the first value to the last, indicates a decrease of approximately 0.6%. Besides, more recent data from the latter half of 2022 onwards suggests a downward trend.
These trends demonstrate variability in HOOD’s P/S and highlight a period of escalated valuation in late 2022, followed by a subsequent decline into early 2023. It’s important to continue monitoring these patterns closely in the context of broader market conditions and specific factors affecting the company’s profit margins and sales volume.
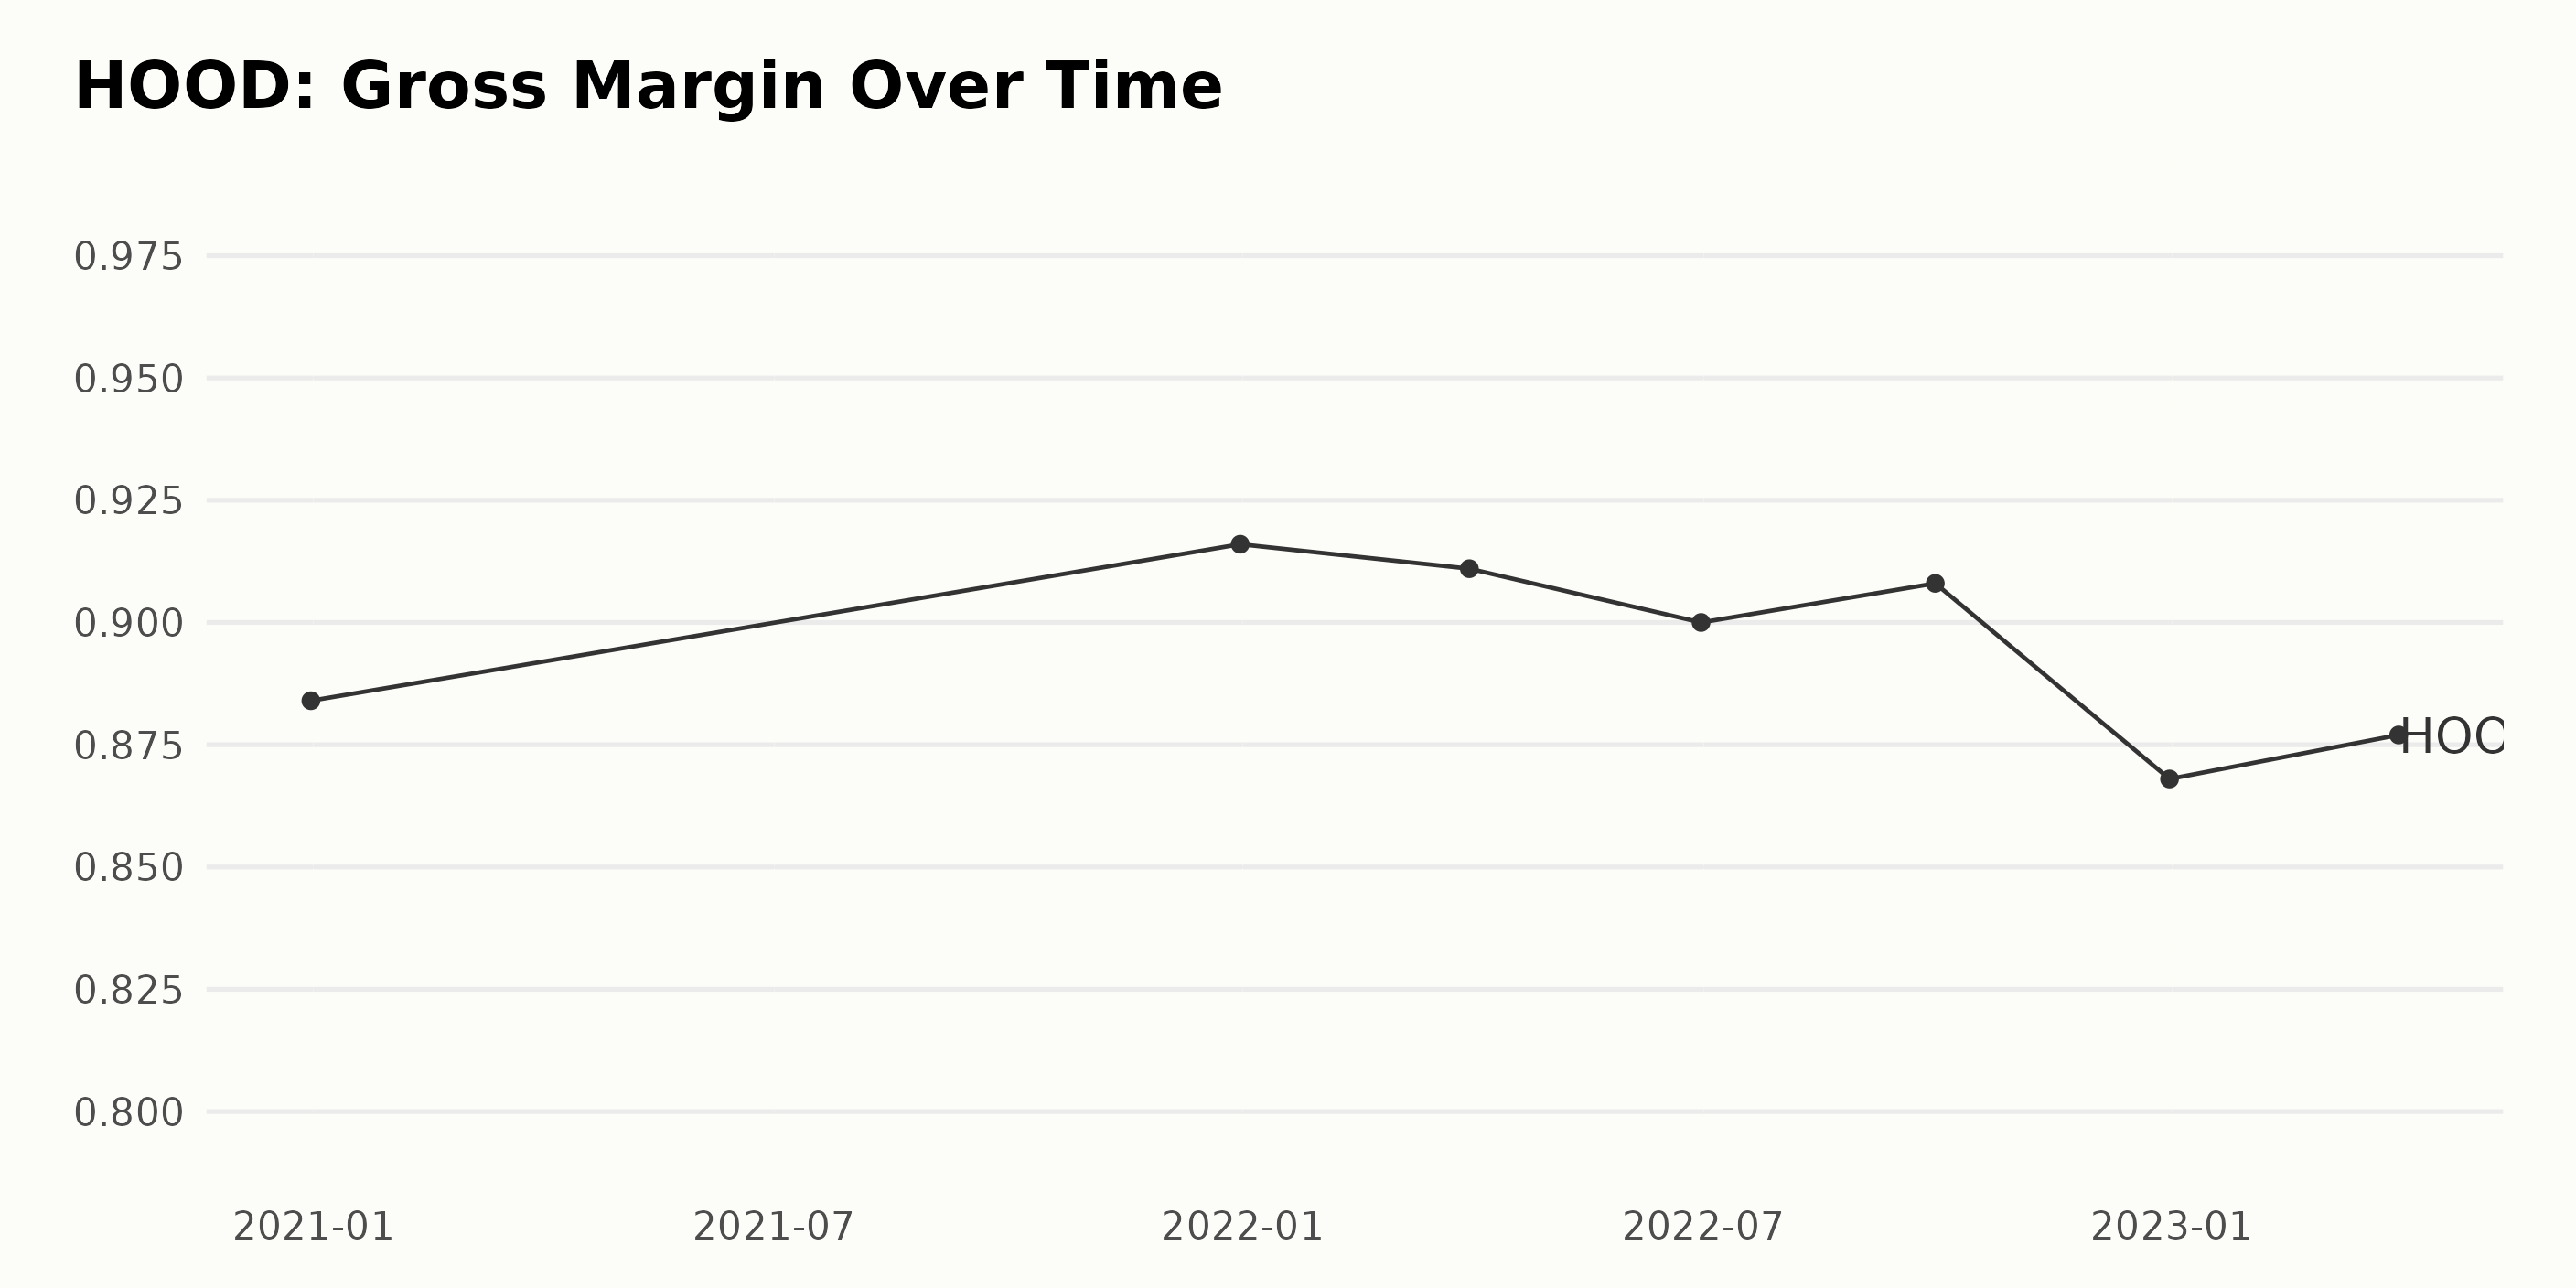
The Gross Margin trend and fluctuations of HOOD are summarized as follows:
- December 31, 2020: The gross margin was 88.4%.
- December 31, 2021: An increase was observed as the gross margin rose to 91.6%, marking a growth rate of approximately 3.6% over the year.
- March 31, 2022: A slight decrease occurred with the gross margin reaching 91.1%.
- June 30, 2022: Further decline was seen, as the gross margin dropped to 90.0%.
- September 30, 2022: There was a mild uptick as the gross margin increased slightly to 90.8%.
- December 31, 2022: A significant drop was registered, with the gross margin falling sharply to 86.8%.
- March 31, 2023: The most recent data shows a slight recovery, with the gross margin at 87.7%.
Despite some oscillations, HOOD experienced a decrement in its Gross Margin from 88.4% on December 31, 2020, to 87.7% on March 31, 2023.
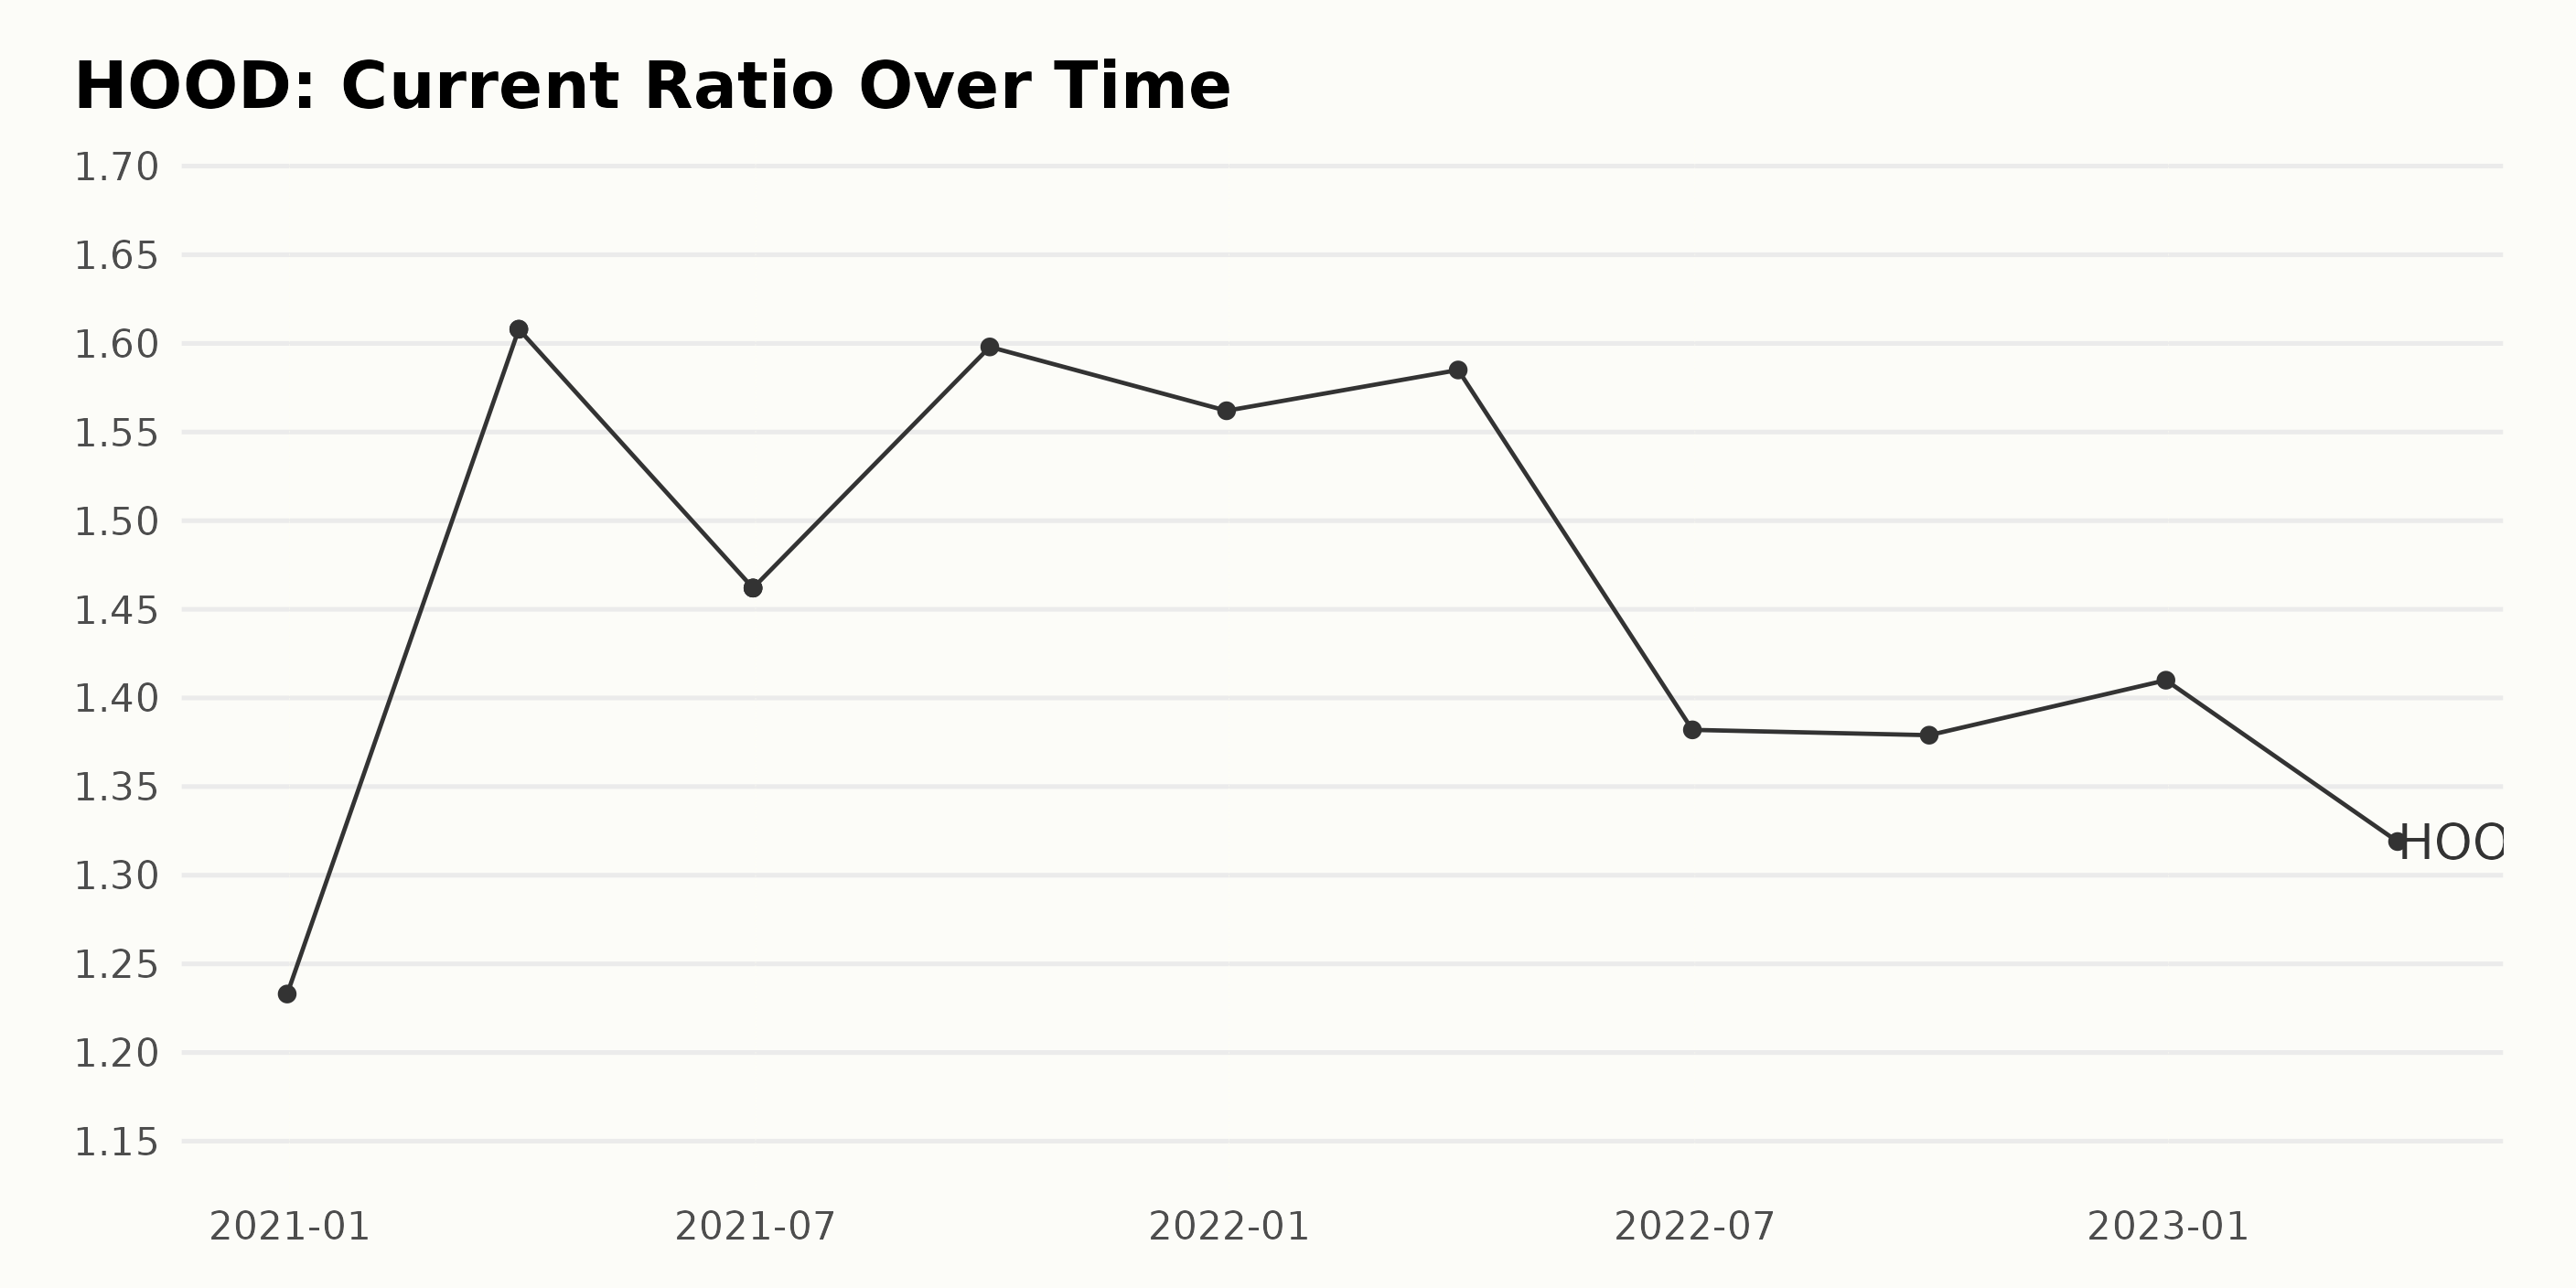
Upon reviewing the data series, a number of trends and fluctuations in the Current Ratio (CR) of HOOD can be identified: -
- From December 2020 to March 2023, the CR decreased from 1.23 to 1.32. Thus, a negative growth rate is noticed over this period, which is -14.2%.
- After an initial surge from 1.23 in December 2020 to 1.61 in March 2021, the CR declined to 1.46 by June 2021.
- A mild recovery was observed from June 2021 as the CR increased to 1.60 by September 2021, after which it again decreased, ending at 1.56 by December 2021.
- The following year in 2022, the CR experienced more downs than ups, starting at 1.59 in March and finishing at a lower 1.41 in December.
- In the first quarter of 2023, the Current Ratio dropped to 1.32.
It is important to note the decrease observed in the most recent value. Given the emphasis on recent data, the Current Ratio’s reduction from 1.41 in December 2022 to 1.32 in March 2023 suggests a continued decline.
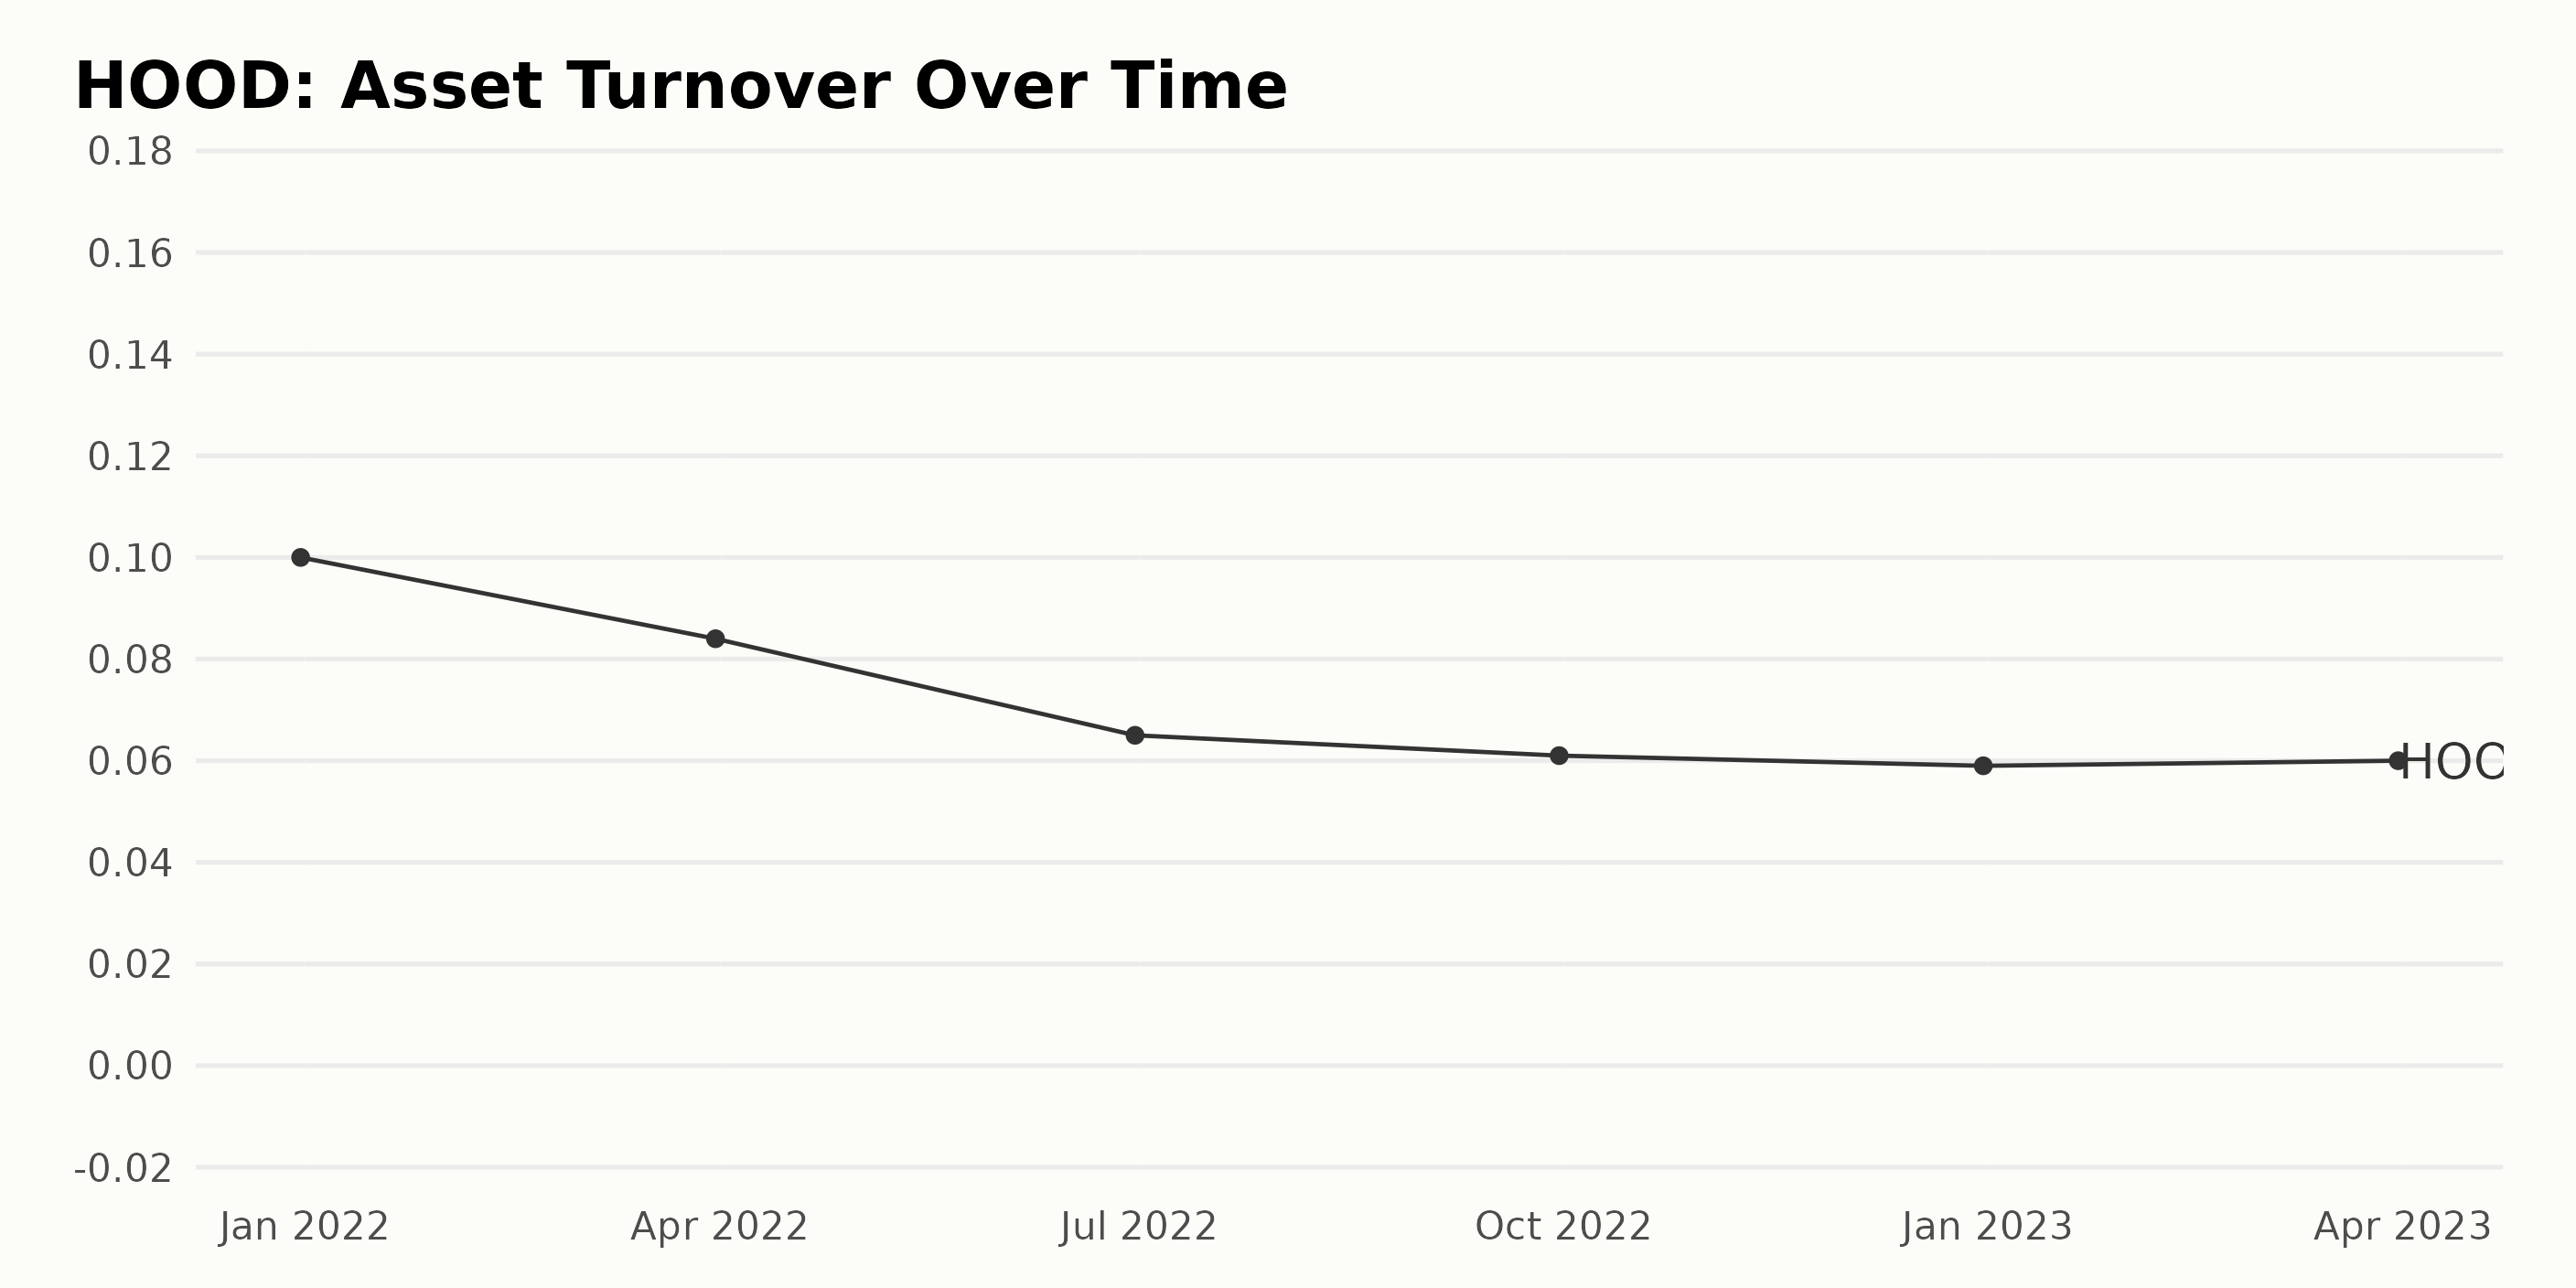
- HOOD’s asset turnover ratio data shows a general downward trend from December 31, 2021, to March 31, 2023.
- On December 31, 2021, the asset turnover was at 0.1.
- There was a slight decrease to 0.084 by March 31, 2022.
- By June 30, 2022, the asset turnover continued to fall to 0.065.
- The fall persisted until September 30, 2022, when it hit 0.061 and fell slightly to 0.059 by December 31, 2022.
- Interestingly, there was a minimal increase, as the asset turnover rose to 0.06 by March 31, 2023.
Comparing the initial value on December 31, 2021, with the latest data point on March 31, 2023, we can deduce that the growth rate of the asset turnover ratio during this period presented a decrease of approximately 40%. Emphasizing the most recent data, there seems to be a potential end to the downward trend with the slight rise observed in the last reported quarter.
Analyzing HOOD’s Share Price Fluctuations: Highlights from January to July 2023
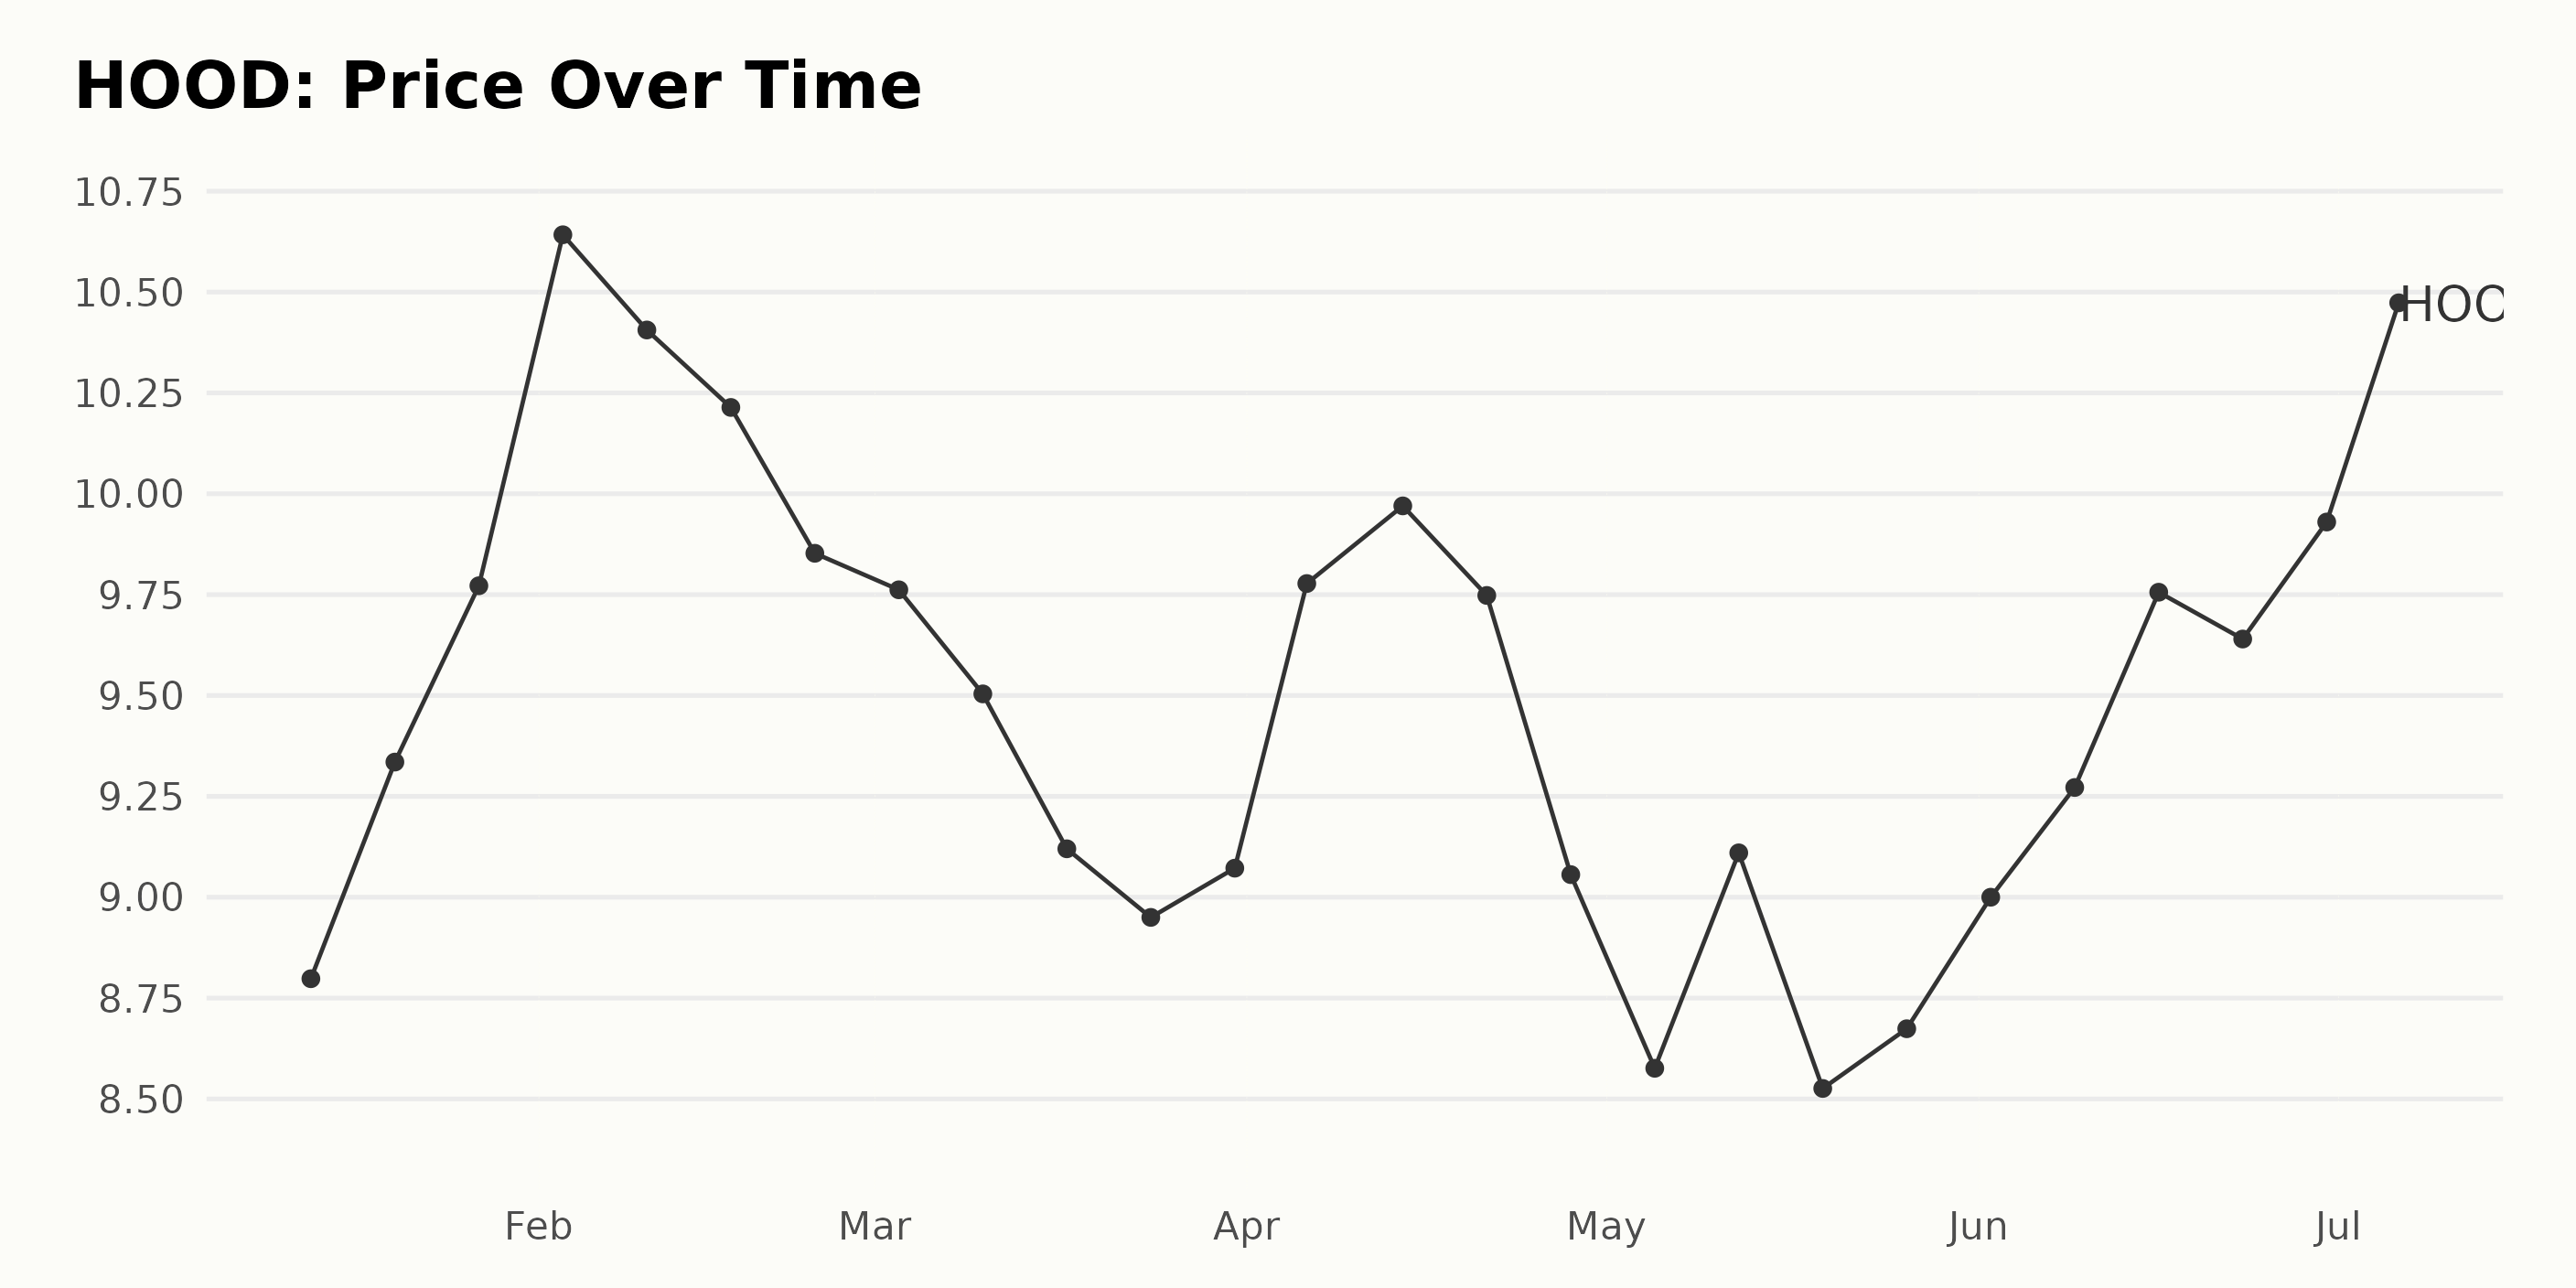
The HOOD share price demonstrated a fluctuating trend from January 2023 to July 2023. Here are the highlights:
- On January 13, 2023, the share price was $8.80. It gradually increased throughout the month, peaking at $9.77 on January 27.
- In February 2023, the share price peaked early at $10.64 on the 3 but then initiated a downward trend, ending the month at $9.85.
- In March 2023, the general trend was a decline in share price for HOOD, starting from $9.76 on the three and experiencing its lowest value of the period at $8.95 on March 24. However, it slightly bounced back to $9.07 by the end of the month.
- April 2023 experienced another peak halfway through the month, with the share price reaching $9.97 on the 14. Though, by the end of the month, the share price had dropped again to $9.06.
- In May 2023, the share price continued its previous decline and reached its lowest point of the year at $8.53 on the 19 but had risen slightly again to $8.67 by the end of the month.
- In June 2023, there was an upward trend, starting from $9 on the 2nd and achieving the month’s peak on the 16th at $9.75.
- The trend continued into July 2023, with the share price peaking at $10.47.
Overall, the share price for HOOD within these seven months did not maintain a consistent growth rate, peaking in early February and bottoming out in mid-May before showing signs of recovery and growth again by the end of July. The only clear pattern shown in this period is that the first half of each month, except March, tends to see a rise in share prices. This indicates a possible monthly cyclic pattern where share prices increase during the first half of the month and decrease in the second half. Further analysis over a longer time frame could tell whether this pattern holds.
Here is a chart of HOOD’s price over the past 180 days.
Tracking HOOD’s POWR Ratings
HOOD has an overall F rating, translating to a Strong Sell in our POWR Ratings system. NWL is ranked #133 in the D-rated Software - Application category of stocks, which comprises 138 stocks in total.
From January 14, 2023, to July 6, 2023, the overall rating of HOOD appears to have fluctuated between D and F. Here are some key takeaways from the provided data:
- The overall rating was D for a considerable duration till mid-April 2023.
- Starting the week of April 8, 2023, it fell to an F for about a month.
- From May 6, 2023, onwards, the grade improved back to D.
- However, as of the latest record on July 6, 2023, the POWR Ratings had again dropped to an F.
How does (HOOD) Stack Up Against its Peers?
Other stocks in the Software - Application sector that may be worth considering are eGain Corporation (EGAN), IBEX Ltd. (IBEX), and Commvault Systems Inc. (CVLT), which have better POWR Ratings.
Is the Bear Market Over?
43-year investment veteran Steve Reitmeister shares his updated stock market outlook & top picks for the rest of 2023. Spoiler Alert: Steve still believes bear case most likely.
Get Stock Market Outlook & Top Picks >
HOOD shares were trading at $10.77 per share on Friday morning, up $0.36 (+3.46%). Year-to-date, HOOD has gained 32.31%, versus a 15.97% rise in the benchmark S&P 500 index during the same period.
About the Author: Kritika Sarmah

Her interest in risky instruments and passion for writing made Kritika an analyst and financial journalist. She earned her bachelor's degree in commerce and is currently pursuing the CFA program. With her fundamental approach, she aims to help investors identify untapped investment opportunities.
The post Is Robinhood Markets (HOOD) a Smart Investment for July? appeared first on StockNews.com