The recent red-hot rally in stocks, especially the NASDAQ 100 names, has brought the bulls back charging and put the bears in hibernation. Whether the momentum will continue or not is certainly uncertain.
One thing that is certain, though, is that some stock measures are definitely getting more extreme, which warrants caution. Protecting or playing for some potential downside is something to seriously consider.
Rather than simply exiting or shorting stocks, using option strategies makes more sense in the current environment.
Here are three big reasons why now might be an opportune time to be buying bearish puts, either as a portfolio protection or a short-term speculative trade.
Implied Volatility
Most of you are probably familiar with the VIX, sometimes referred to as the Fear Gauge. It is a measure of option prices in the S&P 500. How many of you know that the NASDAQ 100 has a similar instrument to measure implied volatility -VXN- or “Vixen”. Below is the definition from the Chicago Board Options Exchange (CBOE) for the VXN. For our purposes, we are substituting QQQ for NDX since QQQ is much more heavily traded.
The Cboe NASDAQ-100 Volatility IndexSM (VXN) is a key measure of market expectations of near-term volatility conveyed by NASDAQ-100® Index (NDX) option prices. It measures the market’s expectation of 30-day volatility implicit in the prices of near-term NASDAQ-100 options. VXN is quoted in percentage points.
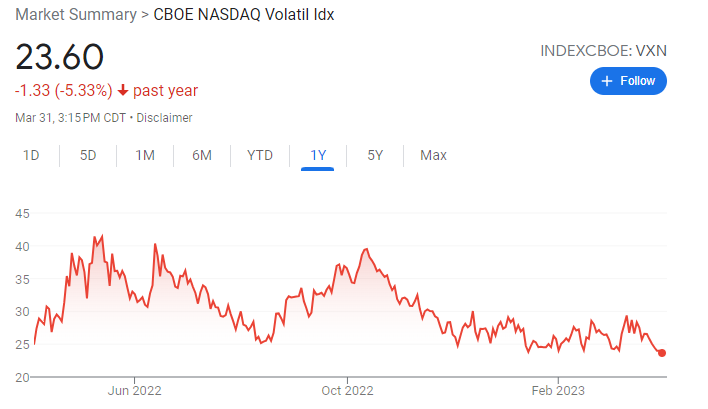
The VIX has dropped sharply recently as stocks have rallied in the past month. VIX closed just above the lowest levels of the year on Friday as the S&P 500 rallied, albeit well shy of yearly highs.
VXN, however, did close at a new yearly low on Friday as the NASDAQ 100 (QQQ) closed at a new yearly high. Also, VXN closed at the lowest level since January 2022.
A quick comparison of the last time QQQ was at comparable pricing will show how much the drop in VXN cheapens the price of puts. The comparative option montages are shown below.
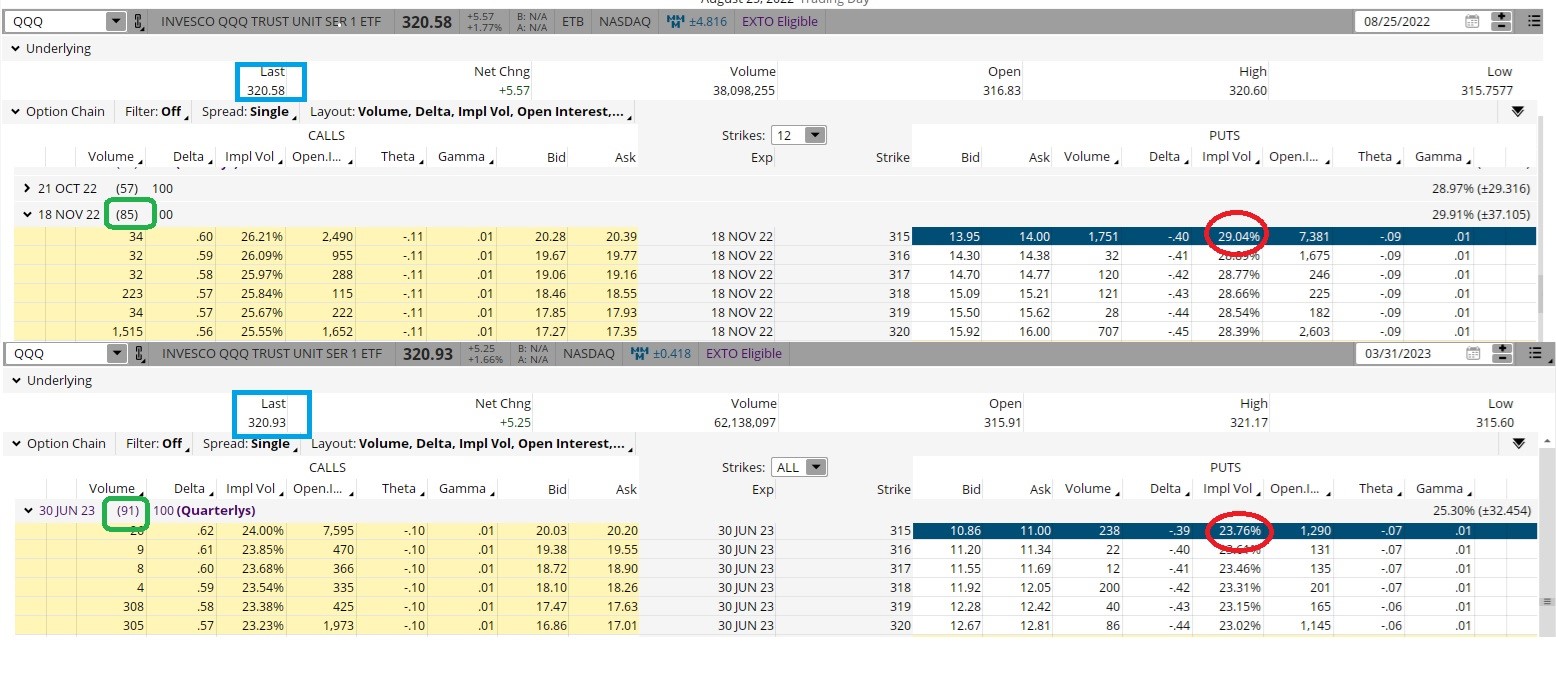
On August 25 of last year, QQQ closed at $320.58. The November 18th $315 puts had 85 days until expiration and were priced at $14.00. IV was just over 29.
Fast forward to Friday, and QQQ closed at $320.93, so only 38 cents higher than back in August. The June 30th expiration $315 puts had 91 days to expiration, so a few more days longer than the similar November 18th expiration puts from back in August. The June 30th puts were priced at $11.00. IV was just under 24.
Putting it all together, the slightly out of the money $315 puts from last August were trading $3.00 cheaper than the virtually similar puts are trading now.

Another way to look at it, the puts back in August cost 4.37% the price of QQQ compared to just 3.43% now. All because IV dropped from 29.04 to 23.76. To me, buying puts at a much cheaper price (and the cheapest price in quite a while) is never a bad thing.
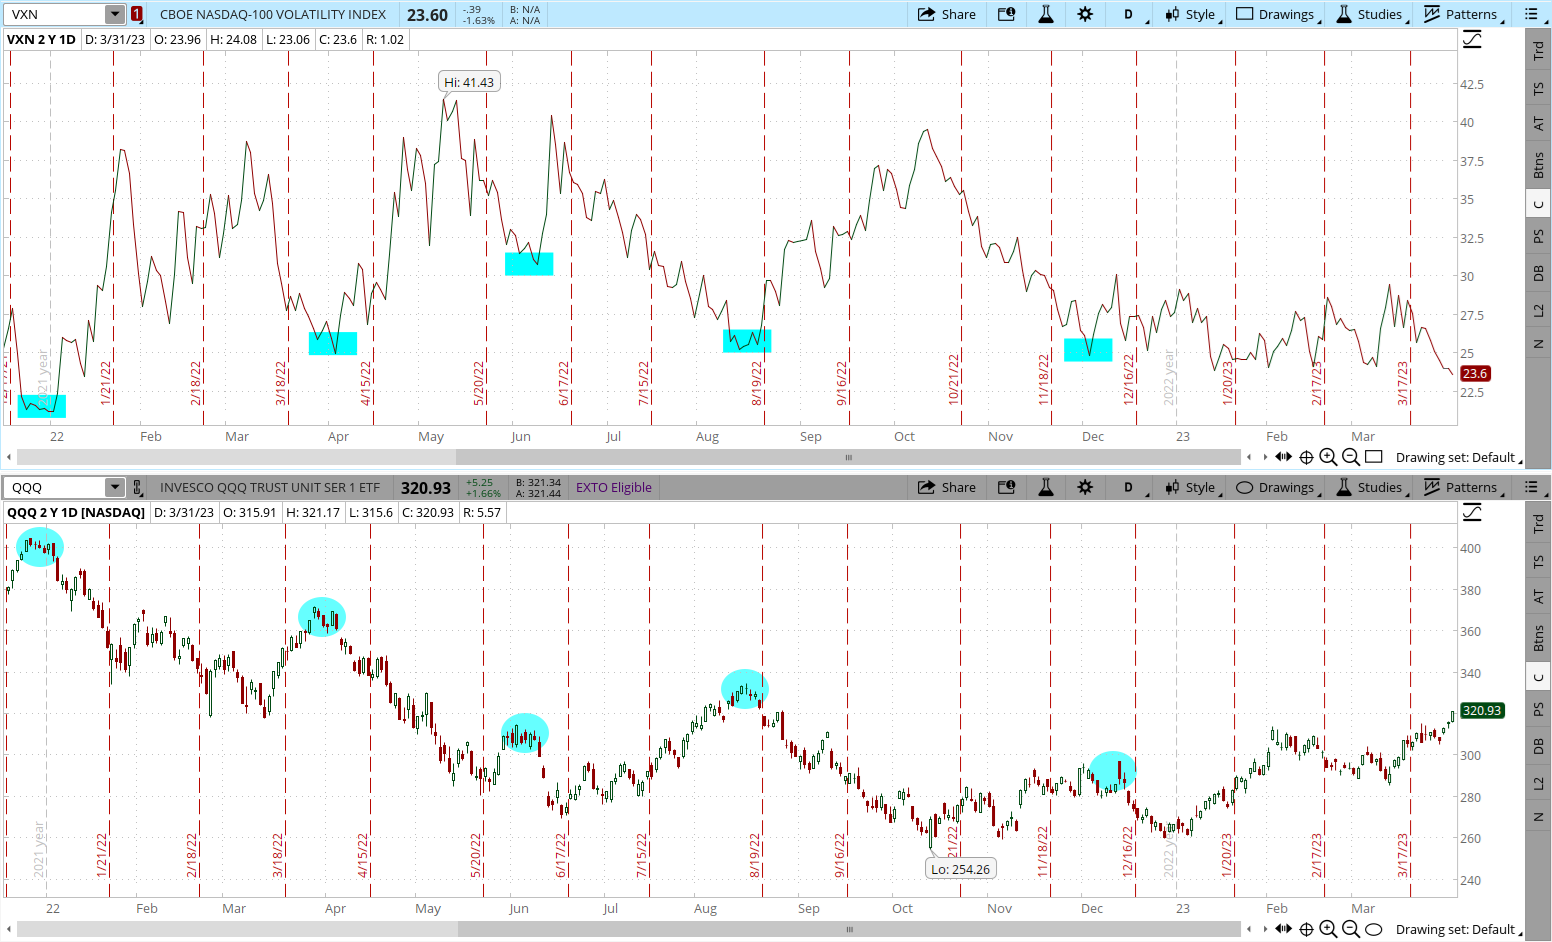
VXN is also a reliable market timing tool, very much like the VIX in that regard. Drops to comparatively low levels of VXN almost invariably coincide with short-term tops in QQQ, as the chart below shows. Is the QQQ near a top$ The VXN is implying so.
Technicals
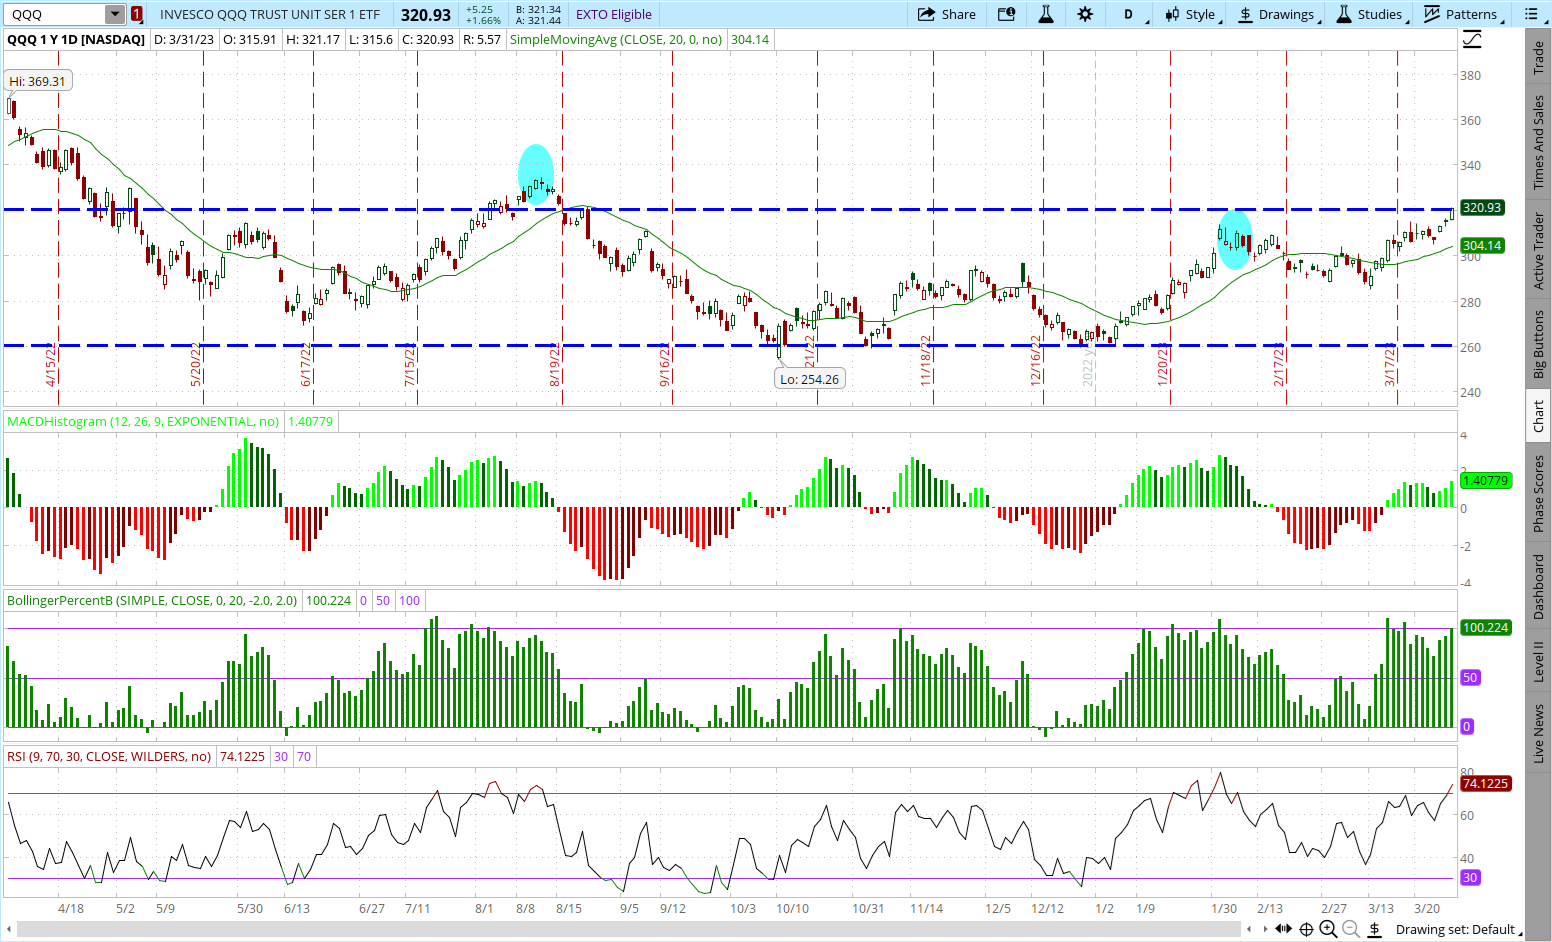
The NASDAQ 100 (QQQ) is getting overbought on a technical basis. 9-day RSI is now over 70. Bollinger Percent B just broke past 100. MACD hit an extreme. Shares are trading at a big premium to the 20-day moving average. Last times these indicators all aligned in a similar fashion marked a short-term top in QQQ.
NASDAQ 100 (QQQ) is getting a little out over the skis on a comparative basis when compared to the other three major indices. The Nazzy is showing a spectacular gain of over 20% so far in 2023. Compare that to the still very respectable gain of almost 7.5% for the S&P 500 (SPY) and it is easy to see just how much QQQ has rallied versus other stocks in Q1. If you compare the gains of QQQ to those of either IWM (Russell 2000) or DIA (Dow Jones Industrials) the out-performance is even more astounding.
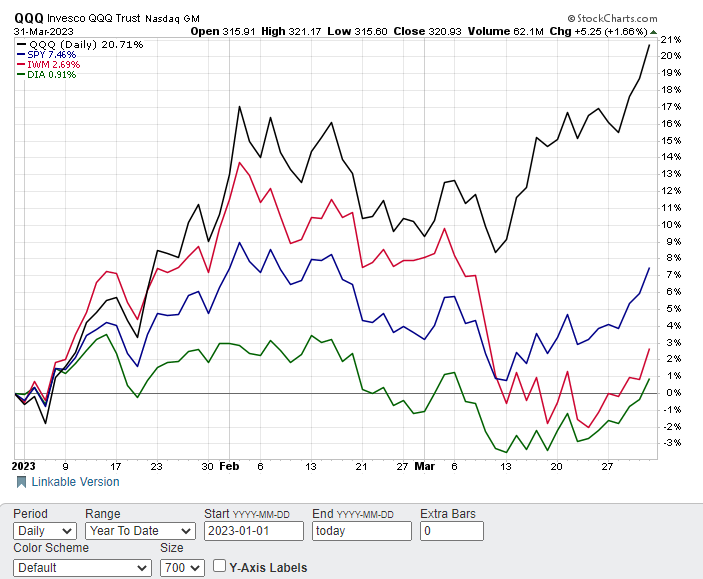
Certainly, some outperformance by the NASDAQ 100 is warranted given it was the worst performing index of the big four in 2022. That outperformance, however, is now getting to an extreme. Look for QQQ to be an underperformer over the coming months as the comparative spread converges back towards the more traditional relationship.
Fundamentals
Two stocks, Microsoft (MSFT) and Apple (AAPL), account for over 25% of the NASDAQ 100 Index weighting. They also comprise over 13% of the S&P 500-the first time two stocks were this powerful since IBM and AT&T in the late 1970s. Plus, they are the only stocks with a $2 trillion plus market cap.
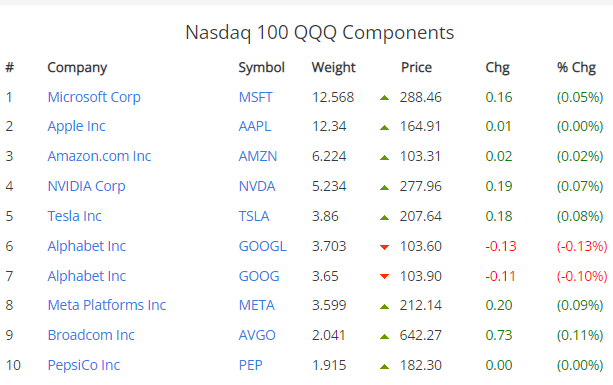
To a large degree, as go these two stocks so goes the NASDAQ 100 and stocks generally. Looking at the valuations of these two mega cap names will provide a good insight into valuations generally for QQQ.
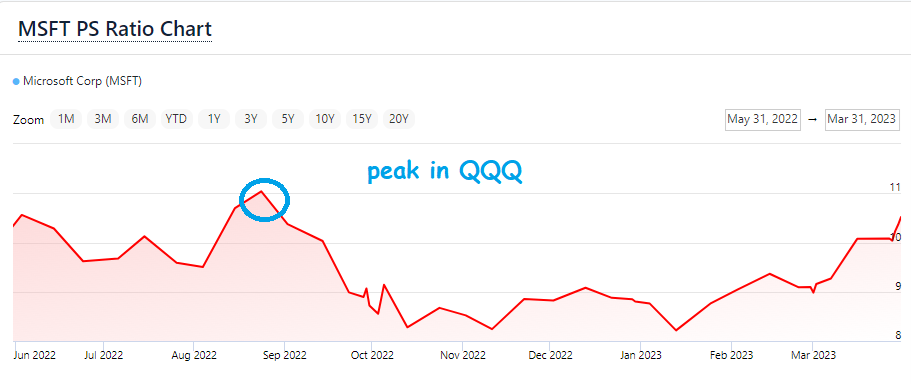
The Price/Sales ratio for top weighted Microsoft (MSFT) is now back well over 10 and at the highest multiple since August of 2022 when the QQQ peaked.
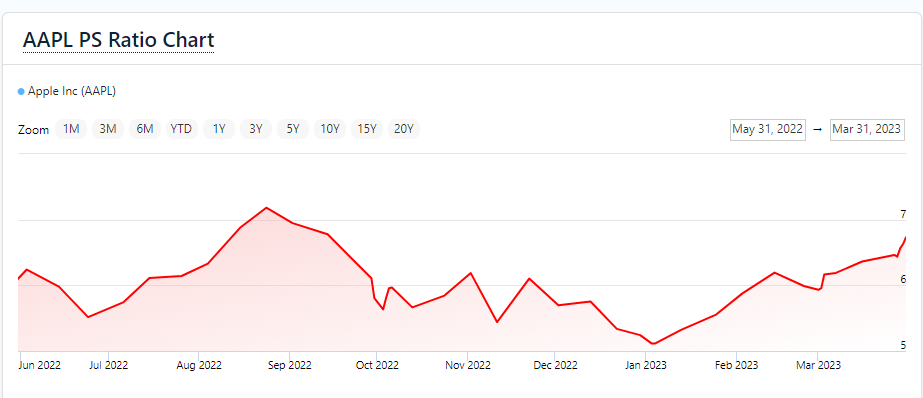
Number two Apple paints a similar picture.
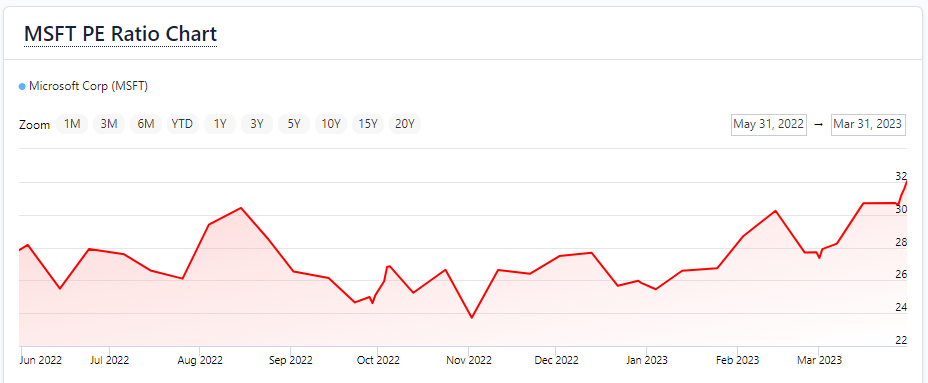
Price/Earnings ratio in MSFT is even more extreme, now at a higher level than back at the previous QQQ peak in price. All this even with interest rates increasing sharply in that time frame-which should cause multiples to contract.
Option prices are cheap. The NASDAQ 100 is overbought technically and overvalued fundamentally. Combining those two statements together means purchasing puts now on QQQ is much cheaper and much more sensible than anytime this year. All we need is the market to return to some semblance of sensibility to profit on a put play.
POWR Options
What To Do Next?
If you're looking for the best options trades for today’s market, you should check out our latest presentation How to Trade Options with the POWR Ratings. Here we show you how to consistently find the top options trades, while minimizing risk.
If that appeals to you, and you want to learn more about this powerful new options strategy, then click below to get access to this timely investment presentation now:
How to Trade Options with the POWR Ratings
All the Best!
Tim Biggam
Editor, POWR Options Newsletter
QQQ shares closed at $320.93 on Friday, up $5.25 (+1.66%). Year-to-date, QQQ has gained 20.71%, versus a 7.46% rise in the benchmark S&P 500 index during the same period.
About the Author: Tim Biggam

Tim spent 13 years as Chief Options Strategist at Man Securities in Chicago, 4 years as Lead Options Strategist at ThinkorSwim and 3 years as a Market Maker for First Options in Chicago. He makes regular appearances on Bloomberg TV and is a weekly contributor to the TD Ameritrade Network "Morning Trade Live". His overriding passion is to make the complex world of options more understandable and therefore more useful to the everyday trader. Tim is the editor of the POWR Options newsletter. Learn more about Tim's background, along with links to his most recent articles.
The post Three Valid Reasons To Say "Give Puts A Chance" appeared first on StockNews.com


