


Artificial intelligence (AI) has driven the new enterprise demand cycle for servers, services and applications. Many companies have shown the reality of material demand surge driving revenues and estimates, like leading AI chip maker Nvidia Co. (NASDAQ: NVDA), which can't keep their AI chips in stock to meet the relentless demand or Dell Technologies Inc. (NYSE: DELL) with a $2 billion backlog for its AI servers. These AI players set the bar high every quarter for AI stocks. Every quarter, some make the leap, some stumble over, while some just can't reach the bar and live up to the hype. Here are two AI stocks that fall in the latter two outcomes.
UiPath Inc. (NASDAQ: PATH)
UiPath is the leader in AI-powered robotic process automation (RPA) and business process automation (BPA). It enables enterprises to automate mundane, mind-numbing and repetitive tasks using its programmable AI-powered software "robots." Tasks include claims processing, data entry, bookkeeping, customer service, compliance, risk management and fraud detection. Its AI-powered platform also enables task and process mining, which relentlessly searches for ways to optimize business processes to improve efficiency and boost productivity. UiPath continues to grow its client base as more companies migrate towards automation, which can be more cost-effective, accurate and productive. Customers with over $1 million ARR grew to 254, up from 190 in the year-ago period, and customers with $100,000 or more ARR grew to 1,990 from 1,660 in the year-ago period. The UiPath community has over 2.5 million worldwide users.
Steady As She Grows
On September 6, 2023, UiPath released its fiscal Q2 2024 earnings report for the quarter ending in July 2023. The company reported earnings-per-share (EPS) of 9 cents, excluding non-recurring items, versus consensus analyst estimates of 4 cents, beating by $0.05. Revenues grew 18.6% year-over-year (YoY) to $287.31 million, beating analyst estimates for $281.48 million with an annual renewal run rate (ARR) growing 25% YoY of $1.308 billion. Net new ARR was $59 million. Dollar-based net retention was 121%. GAAP gross margin was 83%. GAAP operating loss was $77.6 million. Non-GAAP operating income was $30.1 million. UiPath closed the quarter with $1.8 billion in cash, cash equivalents and marketable securities. The company authorized a $500 million stock buyback.
Mixed Guidance
Similar to its prior quarter, the company lowered estimates for the next quarter but raised for the full year. UiPath lowered guidance for Q3 fiscal 2024 revenues between $313 million to $318 million versus $318.45 million consensus analyst estimates. The company expects ARR from $1.359 billion to $1.364 billion as of calendar year October 31, 2023. Non-GAAP operating income is expected to be around $32 million.
UiPath raised fiscal full-year 2024 revenues between $1.273 billion and $1.278 billion versus $1.27 billion consensus estimates. ARR is expected between $1.432 billion to $1.437 billion as of January 1, 2024. Non-GAAP operating income is expected to be around $188 million.
C3.ai analyst ratings and price targets can be found on MarketBeat.
Weekly Ascending Triangle Pattern
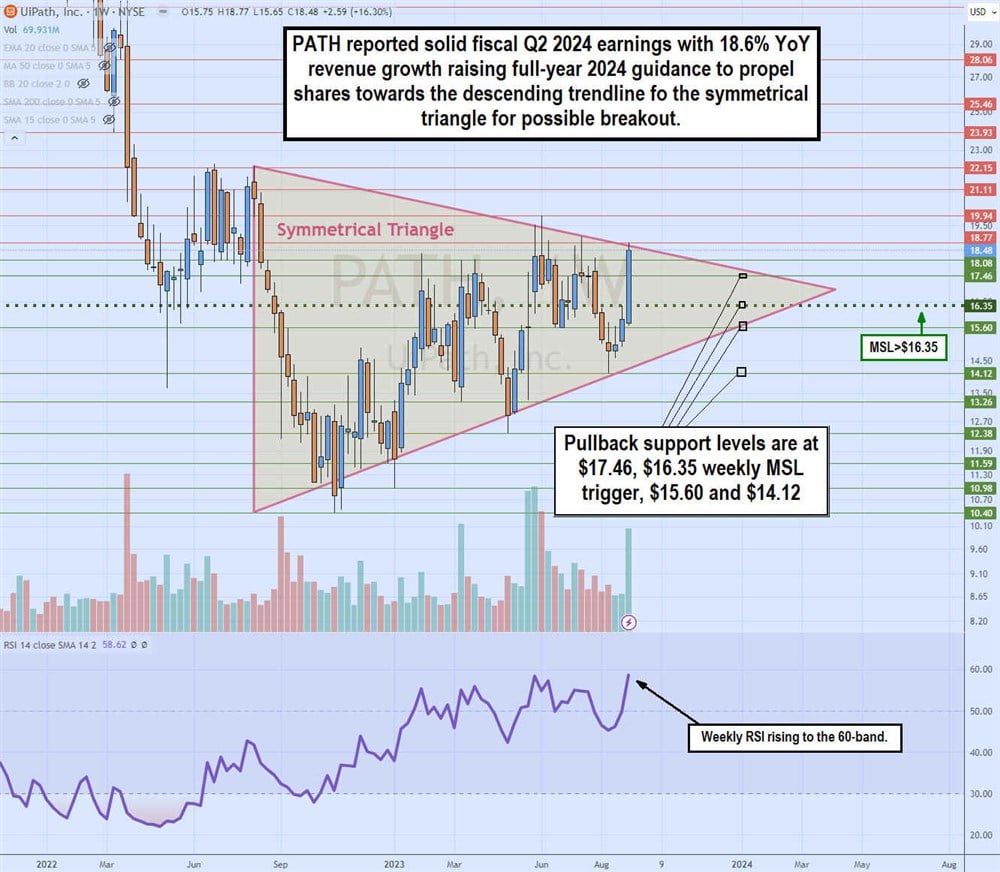
The weekly candlestick chart for PATH illustrates a symmetrical triangle pattern. This pattern is comprised of a descending triangle indicating lower highs on bounces and an ascending trendline indicating higher lows that eventually meet at the apex point. A breakout through the descending trendline or a breakdown through the ascending trendline usually triggers before reaching the apex. The Q2 2024 earnings results spiked PATH to the descending triangle as the weekly relative strength index (RSI) rally to the 60-band triggered the weekly market structure low (MSL) breakout through the $16.35 trigger. Pullback support levels are $17.46, $16.35 weekly MSL trigger, $15.60 and $14.12.
C3.ai Inc. (NASDAQ: AI)
Perhaps the stock symbol AI may have set too high of a bar for C3.ai, but it also garnered a large portion of the spotlight during the AI boom, driving shares higher in the hopes of big results. Hope is the keyword. C3.ai has yet to live up to the hype as its results slightly improved but fell extremely short of the high expectations from investors. The company backtracked earlier innuendos of profitability coming by the end of the year. Instead, the company will invest more in the short-term for long-term gains. The underwhelming growth can largely be attributed to its migration to a consumption model designed to make onboarding cheaper for new clients as a pay-as-you-use model, which should grow revenues in time.
Where's the Beef?
Old timers remember The Wendy's Co. (NYSE: WEN) comical commercials featuring a stumpy grandmother played by the late Clara Peller gruffly asking, "Where's the Beef?" after receiving a competitor's dinky burger. That's the sentiment felt by investors and analysts after seeing C3.ai's fiscal Q1 2024 earnings report on September 6, 2023.
C3.ai reported an earnings-per-share (EPS) loss of 9 cents, excluding non-recurring items, versus consensus analyst estimates of 17 cents. While they beat estimates by $0.08, it's like saying you only lost a toe instead of the whole foot in a car accident. Revenues rose 10.8% to $72.36 million versus $71.56 million, a whopping $800,000 beat, further echoing the "Where's the beef?" sentiment.
Ho Hum Guidance
Forward guidance was in line with fiscal Q2 2024 revenues expected between $72 million to $76.5 million compared to $73.84 million analyst estimates. The company reaffirmed its full-year fiscal 2024 revenues of $295 million to $320 million versus $308.24 million consensus analyst estimates.
Underwhelming
The company did close or expand agreements with some well-recognized names, including Tyson Foods Inc. (NYSE: TSN), the U.S. Department of Defense, Cargill, and Nucor Inc. (NYSE: NUE), but guidance underwhelms the reality of these contracts. C3.ai's esteemed CEO, Tom Seibel, commented, "It is difficult to describe the scale of the increasing interest we are seeing globally in enterprise AI adoption. We are experiencing strong traction with our enterprise AI applications, especially C3 Generative AI."
The C3.AI Hype Train Losing Credibility
Seibel continued, "The market response to our Generative AI offerings is staggering. C3 Generative AI provides fine-tuned tailored Generative AI solutions that address the crippling problems that prevent widespread industry adoption of LLMs…" He backtracked, "The market opportunity is immediate, and we intend to seize it. While we still expect to be cash positive in Q4 FY 24 and FY 25, we will be investing in our Generative AI solutions and, at this time, do not expect to be non-GAAP profitable in Q4 FY 24." Seibel claims that C3.ai was "well ahead of its time" in predicting the scale of opportunity in enterprise AI and "has prepared 14 years" for this opportunity. The market reacted with a nearly 20% haircut in the post-market.
C3.ai analyst ratings and price targets can be found on MarketBeat.
Weekly Cup and Handle Pattern
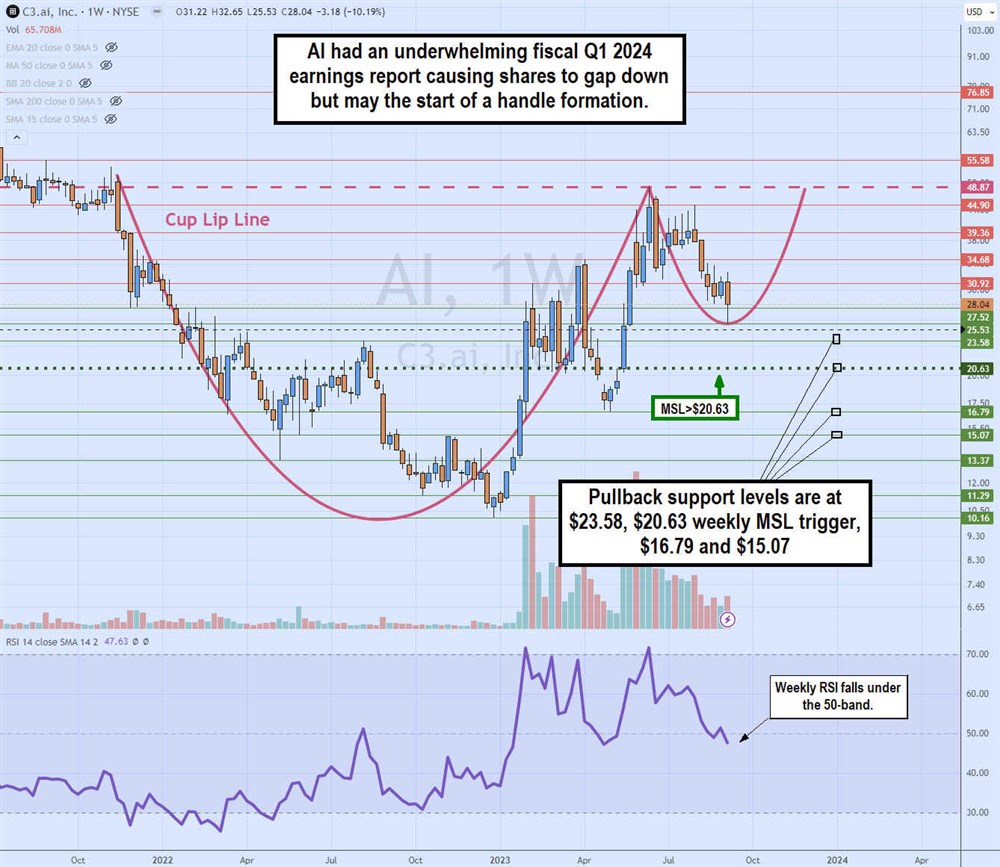
The 34% short interest in AI makes it extremely susceptible to a short squeeze on any news or rumor. The weekly candlestick chart illustrates a large cup and potential handle pattern. The cup lip line started forming at $48.87 in November 2021. AI fell to a low of $10.16 by December 2022, and it rallied to the cup lip line retest in June 2023 to complete the cup formation. The fiscal Q1 2024 earnings reaction caused shares to stumble to $25.50 to form the handle. The RSI is still slipping down through the 50-band. Pullback support levels are $23.58, $20.63 weekly MSL trigger, $16.79 and $15.07.
