


Total passenger traffic continued to recover reaching 75.5% of May 2019 traffic levels;
Ecuador and Armenia at 97% and 107% of pre-pandemic levels, respectively
Corporación América Airports S.A. (NYSE: CAAP), (“CAAP” or the “Company”) the largest private sector airport operator in the world by number of airports, reported today a 188.3% YoY increase in passenger traffic in May 2022, reaching 75.5% of pre-pandemic levels of May 2019.
This press release features multimedia. View the full release here: https://www.businesswire.com/news/home/20220616005658/en/
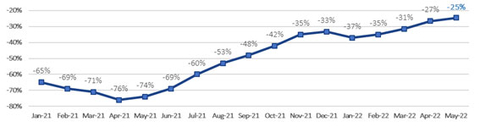
Passenger Traffic Monthly Performance (vs. 2019)
Passenger Traffic, Cargo Volume and Aircraft Movements Highlights (2022 vs. 2021) |
|||||||
Statistics |
May'22 |
May'21 |
% Var. |
|
YTD’22 |
YTD'21(1)(2)(3) |
% Var. |
Domestic Passengers (thousands) |
2,966 |
1,017 |
191.6% |
|
14,394 |
6,476 |
122.3% |
International Passengers (thousands) |
1,749 |
418 |
318.2% |
|
6,873 |
1,782 |
285.7% |
Transit Passengers (thousands) |
363 |
326 |
11.4% |
|
2,179 |
1,658 |
31.4% |
Total Passengers (thousands) |
5,077 |
1,761 |
188.3% |
|
23,446 |
9,916 |
136.4% |
Cargo Volume (thousand tons) |
30.8 |
27.6 |
11.4% |
|
141.4 |
125.6 |
12.6% |
Total Aircraft Movements (thousands) |
61.1 |
31.1 |
96.7% |
|
276.2 |
160.0 |
72.6% |
Passenger Traffic, Cargo Volume and Aircraft Movements Highlights (2022 vs. 2019) |
|||||||
Statistics |
May'22 |
May'19(1) |
% Var. |
|
YTD’22 |
YTD'19(1)(3) |
% Var. |
Domestic Passengers (thousands) |
2,966 |
3,768 |
-21.3% |
|
14,394 |
19,047 |
-24.4% |
International Passengers (thousands) |
1,749 |
2,332 |
-25.0% |
|
6,873 |
11,392 |
-39.7% |
Transit Passengers (thousands) |
363 |
621 |
-41.6% |
|
2,179 |
3,515 |
-38.0% |
Total Passengers (thousands) |
5,077 |
6,721 |
-24.5% |
|
23,446 |
33,954 |
-30.9% |
Cargo Volume (thousand tons) |
30.8 |
35.5 |
-13.2% |
|
141.4 |
177.7 |
-20.4% |
Total Aircraft Movements (thousands) |
61.1 |
70.5 |
-13.3% |
|
276.2 |
351.7 |
-21.5% |
(1) |
Note that preliminary passenger traffic figures for 2019, as well as January 2020 for Ezeiza Airport, in Argentina, were adjusted to include additional inbound passengers not accounted for in the initial count, for an average of approximately 5% of total passenger traffic at Ezeiza Airport and 1% of total traffic at CAAP, during that period. Importantly, inbound traffic does not affect revenues, as tariffs are applicable on departure passengers. |
(2) |
Preliminary data on 1,256 flights in January 2020 at Brasilia Airport, due to delays in the submission of information by third parties. |
(3) |
Cargo volumes in Uruguay were rectified from January 2019 to June 2020, to reflect all cargo passing through the cargo terminal, instead of air cargo only. |
Passenger Traffic Overview
Total passenger traffic in May 2022 grew 188.3% compared to the same month of last year, driven by increases across all countries of operations, particularly in Italy, Argentina and Brazil, boosted by higher traffic demand as a consequence of the lifting of travel restrictions and the re-opening of borders on November 1, 2021, in Argentina and Uruguay. Overall passenger traffic recovered to 75.5% of May 2019 levels, from 73.5% in April. International and domestic passenger traffic improved sequentially reaching 75.0% and 78.7% of pre-pandemic levels of May 2019, respectively.
In Argentina, total passenger traffic increased 449% YoY and reached 74.8% of May 2019 levels, with international passenger traffic improving to 60.8% of pre-pandemic levels, showing a continued strong recovery from the 6.2% of 2019 levels posted in July 2021, the lowest level of the year. In addition, traffic improved sequentially from the 48.4% and 57.2% reached in March and April, respectively. International traffic YoY comparison continued to benefit from the full re-opening of borders on November 1, 2021 and the gradual lifting of travel requirements. Domestic passenger traffic also performed well, reaching 81.3% of May 2019 levels, slightly down from the 84.6% posted in April. Effective April 7, 2022, Covid tests are no longer required and travelers must complete an affidavit form. In addition, foreigners are required to present a Covid-19 health insurance.
In Italy, passenger traffic grew 786% YoY and stood at 85.0% of May 2019 levels, a strong sequential improvement from the 68.2% and 78.1% posted in March and April, respectively. Traffic trends are expected to improve further in the coming months as the summer season approaches, also reflecting the lifting of travel restrictions effective June 1, 2022.
In Brazil, total passenger traffic increased 55.3% YoY, and reached 78.6% of May 2019 pre-pandemic levels, up from the 73.0% recorded in April. Domestic traffic, which accounted for 72% of total traffic, stood at 94.1% of pre-pandemic levels whereas transit passengers reached 53.3% of May 2019 levels.
Total passenger traffic in Uruguay increased 535% YoY and reached 66.1% of May 2019 levels, up from the 57.9% and 63.4% posted in March and April, respectively. Traffic in Uruguay continues to improve following the full re-opening of borders on November 1, 2021 together with the gradual relaxation of travel requirements.
In Ecuador, passenger traffic increased 112% YoY, reaching 97.1% of May 2019 levels, up from the 88.5% and 95.2% posted in March and April, respectively. International passenger traffic continued to recover reaching pre-pandemic levels, boosted by routes to Europe, as well as the US and Panama, which have been seeing higher passenger traffic than in 2019 for several months now. Domestic passenger traffic also performed well, reaching 94.1% of May 2019 pre-pandemic levels.
In Armenia, total passenger traffic increased 56.9% YoY. Passenger traffic continued performing well, surpassing pre-pandemic levels, at 107.4% of May 2019, improving from the 95.1% and 96.4% recorded in March and April, respectively.
Cargo Volume and Aircraft Movements
Cargo volume increased 11.4% YoY and stood at 86.8% of May 2019 levels, or at 87.8% when adjusting for the discontinuation in Peru. Close to two thirds of cargo volume came from Argentina and Uruguay, which reported volumes at 83.0% and 160.6% of May 2019 pre-pandemic levels.
Aircraft movements increased 96.7% YoY and stood at 86.7% of May 2019 levels, or at 90.3% when adjusting for the discontinuation of operations in Peru. Aircraft movements in Argentina, which accounted for more than half of total movement, stood at 85.8% of pre-pandemic levels. To note, aircraft movements in Ecuador, Italy, Uruguay and Brazil was above 90% of May 2019 levels and surpassed pre-pandemic levels by 1.4x in Armenia.
Summary Passenger Traffic, Cargo Volume and Aircraft Movements (2022 vs. 2021)
|
May'22 |
May'21 |
% Var. |
|
YTD'22 |
YTD'21 |
% Var. |
Passenger Traffic (thousands) |
|
|
|
|
|
|
|
Argentina(1) |
2,554 |
465 |
448.8% |
|
12,167 |
3,986 |
205.2% |
Italy |
666 |
75 |
785.7% |
|
2,044 |
188 |
985.1% |
Brazil(2) |
1,125 |
725 |
55.3% |
|
6,043 |
3,833 |
57.7% |
Uruguay |
109 |
17 |
535.1% |
|
544 |
75 |
628.8% |
Ecuador |
361 |
170 |
112.0% |
|
1,607 |
694 |
131.7% |
Armenia |
261 |
166 |
56.9% |
|
1,041 |
571 |
82.2% |
Peru |
- |
142 |
-100.0% |
|
- |
569 |
-100.0% |
TOTAL |
5,077 |
1,761 |
188.3% |
|
23,446 |
9,916 |
136.4% |
(1) See Footnote 1 in previous table. (2) See Footnote 2 in previous table. (3) See Footnote 3 in previous table. |
Cargo Volume (tons) |
|
|
|
|
|
|
|
Argentina |
15,729 |
14,665 |
7.3% |
75,677 |
66,744 |
13.4% |
|
Italy |
1,276 |
1,277 |
-0.1% |
6,278 |
5,846 |
7.4% |
|
Brazil |
5,301 |
5,257 |
0.8% |
23,615 |
25,369 |
-6.9% |
|
Uruguay(3) |
4,279 |
2,989 |
43.2% |
14,527 |
12,817 |
13.3% |
|
Ecuador |
2,858 |
1,639 |
74.4% |
14,921 |
7,390 |
101.9% |
|
Armenia |
1,322 |
1,556 |
-15.0% |
6,412 |
6,243 |
2.7% |
|
Peru |
- |
243 |
-100.0% |
- |
1,151 |
-100.0% |
|
TOTAL |
30,765 |
27,627 |
11.4% |
141,430 |
125,562 |
12.6% |
|
Aircraft Movements |
|
|
|
|
|
|
|
Argentina |
31,043 |
13,374 |
132.1% |
144,084 |
79,649 |
80.9% |
|
Italy |
7,007 |
2,076 |
237.5% |
22,799 |
5,540 |
311.5% |
|
Brazil |
11,708 |
7,528 |
55.5% |
55,929 |
39,584 |
41.3% |
|
Uruguay |
1,996 |
1,105 |
80.6% |
11,915 |
4,384 |
171.8% |
|
Ecuador |
6,711 |
3,972 |
69.0% |
31,331 |
18,746 |
67.1% |
|
Armenia |
2,677 |
1,593 |
68.0% |
10,114 |
5,913 |
71.0% |
|
Peru |
- |
1,440 |
-100.0% |
- |
6,168 |
-100.0% |
|
TOTAL |
61,142 |
31,088 |
96.7% |
276,172 |
159,984 |
72.6% |
Summary Passenger Traffic, Cargo Volume and Aircraft Movements (2022 vs. 2019)
|
May'22 |
May'19 |
% Var. |
|
YTD'22 |
YTD'19 |
% Var. |
Passenger Traffic (thousands) |
|
|
|
|
|
|
|
Argentina(1) |
2,554 |
3,415 |
-25.2% |
|
12,167 |
17,909 |
-32.1% |
Italy |
666 |
784 |
-15.0% |
|
2,044 |
2,940 |
-30.5% |
Brazil(2) |
1,125 |
1,431 |
-21.4% |
|
6,043 |
7,874 |
-23.2% |
Uruguay |
109 |
165 |
-33.9% |
|
544 |
984 |
-44.7% |
Ecuador |
361 |
372 |
-2.9% |
|
1,607 |
1,869 |
-14.0% |
Armenia |
261 |
243 |
7.4% |
|
1,041 |
1,039 |
0.2% |
Peru |
- |
311 |
-100.0% |
|
- |
1,340 |
-100.0% |
TOTAL |
5,077 |
6,721 |
-24.5% |
|
23,446 |
33,954 |
-30.9% |
(1) See Footnote 1 in previous table. (2) See Footnote 2 in previous table. (3) See Footnote 3 in previous table. |
Cargo Volume (tons) |
|
|
|
|
|
|
|
Argentina |
15,729 |
18,941 |
-17.0% |
75,677 |
93,823 |
-19.3% |
|
Italy |
1,276 |
1,100 |
16.0% |
6,278 |
5,466 |
14.9% |
|
Brazil |
5,301 |
7,611 |
-30.4% |
23,615 |
39,774 |
-40.6% |
|
Uruguay(3) |
4,279 |
2,664 |
60.6% |
14,527 |
12,058 |
20.5% |
|
Ecuador |
2,858 |
3,246 |
-12.0% |
14,921 |
17,875 |
-16.5% |
|
Armenia |
1,322 |
1,492 |
-11.4% |
6,412 |
6,754 |
-5.1% |
|
Peru |
- |
407 |
-100.0% |
- |
1,986 |
-100.0% |
|
TOTAL |
30,765 |
35,461 |
-13.2% |
141,430 |
177,736 |
-20.4% |
|
Aircraft Movements |
|
|
|
|
|
|
|
Argentina |
31,043 |
36,193 |
-14.2% |
144,084 |
187,636 |
-23.2% |
|
Italy |
7,007 |
7,500 |
-6.6% |
22,799 |
28,516 |
-20.0% |
|
Brazil |
11,708 |
12,965 |
-9.7% |
55,929 |
66,430 |
-15.8% |
|
Uruguay |
1,996 |
2,202 |
-9.4% |
11,915 |
13,914 |
-14.4% |
|
Ecuador |
6,711 |
6,926 |
-3.1% |
31,331 |
34,396 |
-8.9% |
|
Armenia |
2,677 |
1,944 |
37.7% |
10,114 |
9,014 |
12.2% |
|
Peru |
- |
2,798 |
-100.0% |
- |
11,827 |
-100.0% |
|
TOTAL |
61,142 |
70,528 |
-13.3% |
276,172 |
351,733 |
-21.5% |
About Corporación América Airports
Corporación América Airports acquires, develops and operates airport concessions. Currently, the Company operates 53 airports in 6 countries across Latin America and Europe (Argentina, Brazil, Uruguay, Ecuador, Armenia and Italy). In 2021, Corporación América Airports served 35.7 million passengers, or 42.4% of the 84.2 million passengers served in 2019. The Company is listed on the New York Stock Exchange where it trades under the ticker “CAAP”. For more information, visit http://investors.corporacionamericaairports.com.
View source version on businesswire.com: https://www.businesswire.com/news/home/20220616005658/en/
Contacts
Investor Relations Contact
Patricio Iñaki Esnaola
Email: patricio.esnaola@caairports.com
Phone: +5411 4899-6716
