


Total passenger traffic continued the recovery trend reaching 68.6% of March 2019 traffic levels.
Corporación América Airports S.A. (NYSE: CAAP), (“CAAP” or the “Company”) the largest private sector airport operator in the world by number of airports, reported today a 138.9% YoY increase in passenger traffic in March 2022, reaching 68.6% of pre-pandemic levels of March 2019.
This press release features multimedia. View the full release here: https://www.businesswire.com/news/home/20220418005215/en/
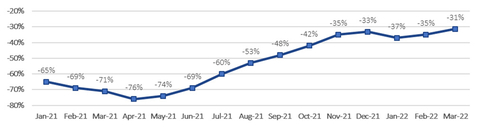
Passenger Traffic Monthly Performance (vs. 2019) (Graphic: Business Wire)
Passenger Traffic, Cargo Volume and Aircraft Movements Highlights (2022 vs. 2021) |
|||||||||||||
Statistics |
Mar'22 |
Mar'21 |
% Var. |
YTD’22 |
YTD'21(1)(2)(3) |
% Var. |
|||||||
Domestic Passengers (thousands) |
2,965 |
1,333 |
122.4% |
8,475 |
4,368 |
94.0% |
|||||||
International Passengers (thousands) |
1,336 |
362 |
269.5% |
3,537 |
1,036 |
241.4% |
|||||||
Transit Passengers (thousands) |
438 |
288 |
51.8% |
1,463 |
1,131 |
29.3% |
|||||||
Total Passengers (thousands) |
4,738 |
1,983 |
138.9% |
13,475 |
6,535 |
106.2% |
|||||||
Cargo Volume (thousand tons) |
30.4 |
26.4 |
15.2% |
81.0 |
67.9 |
19.3% |
|||||||
Total Aircraft Movements (thousands) |
56.8 |
32.6 |
74.1% |
156.4 |
98.4 |
58.9% |
|||||||
Passenger Traffic, Cargo Volume and Aircraft Movements Highlights (2022 vs. 2019) |
|||||||||||||
Statistics |
Mar'22 |
Mar'19(1) |
% Var. |
YTD’22 |
YTD'19(1)(3) |
% Var. |
|||||||
Domestic Passengers (thousands) |
2,965 |
3,945 |
-24.9% |
8,475 |
11,545 |
-26.6% |
|||||||
International Passengers (thousands) |
1,336 |
2,267 |
-41.1% |
3,537 |
6,754 |
-47.6% |
|||||||
Transit Passengers (thousands) |
438 |
694 |
-36.9% |
1,463 |
2,272 |
-35.6% |
|||||||
Total Passengers (thousands) |
4,738 |
6,906 |
-31.4% |
13,475 |
20,571 |
-34.5% |
|||||||
Cargo Volume (thousand tons) |
30.4 |
38.3 |
-20.5% |
81.0 |
105.1 |
-23.0% |
|||||||
Total Aircraft Movements (thousands) |
56.8 |
71.5 |
-20.6% |
156.4 |
212.7 |
-26.5% |
|||||||
(1) |
Note that preliminary passenger traffic figures for 2019, as well as January 2020 for Ezeiza Airport, in Argentina, were adjusted to include additional inbound passengers not accounted for in the initial count, for an average of approximately 5% of total passenger traffic at Ezeiza Airport and 1% of total traffic at CAAP, during that period. Importantly, inbound traffic does not affect revenues, as tariffs are applicable on departure passengers. |
(2) |
Preliminary data on 1,256 flights in January 2020 at Brasilia Airport, due to delays in the submission of information by third parties. |
(3) |
Cargo volumes in Uruguay were rectified from January 2019 to June 2020, to reflect all cargo passing through the cargo terminal, instead of air cargo only. |
Passenger Traffic Overview
Total passenger traffic in March 2022 grew 138.9% compared to the same period of last year, driven by increases across all countries of operations, particularly in Argentina, where traffic demand continued to recover following the full re-opening of borders on November 1, 2021 and the gradual relaxation of travel requirements. When compared to March 2019, overall passenger traffic declined 31.4%, improving from the 35.0% decline posted in February. International and domestic passenger traffic improved sequentially reaching 58.9% and 75.1% of pre-pandemic levels of March 2019, respectively.
In Argentina, total passenger traffic increased 153.0% YoY and reached 67.0% of March 2019 levels, with international passenger traffic improving to 48.4% of pre-pandemic levels, showing a continued strong recovery from the 6.2% posted in July 2021, the lowest level of the year. International traffic continued benefiting from the full re-opening of borders on November 1, 2021 and the gradual relaxation of travel requirements. Domestic passenger traffic also performed well, reaching 77.5% of March 2019 levels. Effective April 7, 2022, Covid tests are no longer required and travelers must complete an affidavit form. In addition, foreigners are required to present a Covid-19 health insurance.
In Italy, where travel restrictions have eased during the last couple of months, passenger traffic grew 18.2x YoY reflecting easier comparisons due to the closure of Florence airport in February and March of last year, to perform runway works. Total traffic reached 68.2% of March 2019 pre-pandemic levels, improving sequentially from the 58.1% and 41.5% posted in February and January, when traffic was impacted by the Omicron variant.
In Brazil, total passenger traffic increased 104.2% YoY, and reached 76.5% of March 2019 levels. This was below the 81.8% achieved in January 2022 but above the 72.7% posted in February, when traffic was impacted by flight cancelations, done by some of the airlines, due to COVID cases within their crew. Domestic traffic stood at 86.0% of pre-pandemic levels.
Total passenger traffic in Uruguay increased 6.2x YoY and reached 57.9% of March 2019 levels, up from the 48.4% posted in February. Traffic in Uruguay continues to improve following the full re-open of borders on November 1, 2021 together with the gradual relaxation of travel requirements.
In Ecuador, passenger traffic increased 150.4% YoY, reaching 88.5% of pre-pandemic levels of March 2019, up from the 78.0% posted in February. International passenger traffic continued to recover reaching 89.1% of pre-pandemic levels, boosted by routes to the US and Panama which have been seeing higher passenger traffic than in 2019 for several months now. Domestic passenger traffic improved to 87.5% of March 2019 pre-pandemic levels, up from the 53.5% and 69.6% posted in January and February, respectively.
In Armenia, where the vaccination roll out has improved significantly in the past few months, total passenger traffic increased 63.2% YoY. Passenger traffic continued performing well and stood at 95.1% of pre-pandemic levels of 2019. Traffic in Armenia is 100% international and has been increasing sequentially since the elimination of restrictions on air travel in September 2020.
Cargo Volume and Aircraft Movements
Cargo volume increased 15.2% YoY. When compared to March 2019, total cargo volume dropped 20.5%, mainly driven by decreases of 40.8% in Brazil and 19.8% in Argentina, accounting for over 95% of the overall volume reduction. Importantly, Italy and Uruguay reported higher cargo volumes compared to pre-pandemic levels of March 2019.
Aircraft movements increased 74.1% YoY. When compared to March 2019, Aircraft movements declined 20.6%, mainly as a result of a 22.7% decrease in Argentina, which explains around 60% of the overall drop, together with a 14.7% decline in Brazil. To note, aircraft movement in Armenia was above March 2019 levels and stood at over 93% of pre-pandemic levels in Ecuador and Uruguay.
Summary Passenger Traffic, Cargo Volume and Aircraft Movements (2022 vs. 2021)
|
Mar'22 |
Mar'21 |
% Var. |
|
YTD'22 |
YTD'21 |
% Var. |
||||||
Passenger Traffic (thousands) |
|
|
|
|
|
|
|
||||||
Argentina(1) |
2,506 |
991 |
153.0% |
|
7,064 |
2,791 |
153.1% |
||||||
Italy |
362 |
19 |
1815.0% |
|
802 |
74 |
981.7% |
||||||
Brazil(2) |
1,210 |
593 |
104.2% |
|
3,842 |
2,653 |
44.8% |
||||||
Uruguay |
107 |
15 |
624.1% |
|
323 |
45 |
624.6% |
||||||
Ecuador |
363 |
145 |
150.4% |
|
872 |
385 |
126.6% |
||||||
Armenia |
190 |
116 |
63.2% |
|
571 |
271 |
110.6% |
||||||
Peru |
- |
105 |
-100.0% |
|
- |
317 |
-100.0% |
||||||
TOTAL |
4,738 |
1,983 |
138.9% |
|
13,475 |
6,535 |
106.2% |
||||||
(1) See Footnote 1 in previous table. (2) See Footnote 2 in previous table. (3) See Footnote 3 in previous table. |
|||||||||||||
Cargo Volume (tons) |
|
|
|
|
|
|
|||||||
Argentina |
16,165 |
14,397 |
12.3% |
43,132 |
36,165 |
19.3% |
|||||||
Italy |
1,536 |
1,342 |
14.5% |
3,909 |
3,403 |
14.9% |
|||||||
Brazil |
5,352 |
4,987 |
7.3% |
13,959 |
13,701 |
1.9% |
|||||||
Uruguay(3) |
2,928 |
2,573 |
13.8% |
7,023 |
6,202 |
13.2% |
|||||||
Ecuador |
3,262 |
1,480 |
120.4% |
9,244 |
4,457 |
107.4% |
|||||||
Armenia |
1,196 |
1,358 |
-12.0% |
3,689 |
3,228 |
14.3% |
|||||||
Peru |
- |
287 |
-100.0% |
- |
697 |
-100.0% |
|||||||
TOTAL |
30,439 |
26,425 |
15.2% |
80,956 |
67,852 |
19.3% |
|||||||
Aircraft Movements |
|
|
|
|
|
|
|||||||
Argentina |
30,427 |
17,574 |
73.1% |
82,106 |
49,902 |
64.5% |
|||||||
Italy |
4,071 |
645 |
531.2% |
10,071 |
2,177 |
362.6% |
|||||||
Brazil |
11,402 |
7,476 |
52.5% |
33,683 |
26,262 |
28.3% |
|||||||
Uruguay |
2,385 |
884 |
169.8% |
7,600 |
2,381 |
219.2% |
|||||||
Ecuador |
6,458 |
3,577 |
80.5% |
17,764 |
11,270 |
57.6% |
|||||||
Armenia |
2,052 |
1,255 |
63.5% |
5,151 |
2,975 |
73.1% |
|||||||
Peru |
- |
1,203 |
-100.0% |
- |
3,430 |
-100.0% |
|||||||
TOTAL |
56,795 |
32,614 |
74.1% |
156,375 |
98,397 |
58.9% |
|||||||
Summary Passenger Traffic, Cargo Volume and Aircraft Movements (2022 vs. 2019)
|
Mar'22 |
Mar'19 |
% Var. |
|
YTD'22 |
YTD'19 |
% Var. |
||||||
Passenger Traffic (thousands) |
|
|
|
|
|
|
|
||||||
Argentina(1) |
2,506 |
3,741 |
-33.0% |
|
7,064 |
11,103 |
-36.4% |
||||||
Italy |
362 |
531 |
-31.8% |
|
802 |
1,420 |
-43.5% |
||||||
Brazil(2) |
1,210 |
1,582 |
-23.5% |
|
3,842 |
4,968 |
-22.7% |
||||||
Uruguay |
107 |
185 |
-42.1% |
|
323 |
643 |
-49.7% |
||||||
Ecuador |
363 |
410 |
-11.5% |
|
872 |
1,105 |
-21.1% |
||||||
Armenia |
190 |
200 |
-4.9% |
|
571 |
579 |
-1.3% |
||||||
Peru |
- |
258 |
-100.0% |
|
- |
753 |
-100.0% |
||||||
TOTAL |
4,738 |
6,906 |
-31.4% |
|
13,475 |
20,571 |
-34.5% |
||||||
(1) See Footnote 1 in previous table. (2) See Footnote 2 in previous table. (3) See Footnote 3 in previous table. |
|||||||||||||
|
|||||||||||||
Cargo Volume (tons) |
|
|
|
|
|
|
|||||||
Argentina |
16,165 |
20,145 |
-19.8% |
43,132 |
56,057 |
-23.1% |
|||||||
Italy |
1,536 |
1,064 |
44.4% |
3,909 |
3,081 |
26.9% |
|||||||
Brazil |
5,352 |
9,042 |
-40.8% |
13,959 |
23,524 |
-40.7% |
|||||||
Uruguay(3) |
2,928 |
2,343 |
25.0% |
7,023 |
6,379 |
10.1% |
|||||||
Ecuador |
3,262 |
3,955 |
-17.5% |
9,244 |
11,313 |
-18.3% |
|||||||
Armenia |
1,196 |
1,331 |
-10.2% |
3,689 |
3,558 |
3.7% |
|||||||
Peru |
- |
404 |
-100.0% |
- |
1,191 |
-100.0% |
|||||||
TOTAL |
30,439 |
38,282 |
-20.5% |
80,956 |
105,102 |
-23.0% |
|||||||
Aircraft Movements |
|
|
|
|
|
|
|||||||
Argentina |
30,427 |
39,347 |
-22.7% |
82,106 |
115,890 |
-29.2% |
|||||||
Italy |
4,071 |
5,206 |
-21.8% |
10,071 |
14,152 |
-28.8% |
|||||||
Brazil |
11,402 |
13,371 |
-14.7% |
33,683 |
40,751 |
-17.3% |
|||||||
Uruguay |
2,385 |
2,548 |
-6.4% |
7,600 |
9,337 |
-18.6% |
|||||||
Ecuador |
6,458 |
6,937 |
-6.9% |
17,764 |
20,636 |
-13.9% |
|||||||
Armenia |
2,052 |
1,826 |
12.4% |
5,151 |
5,326 |
-3.3% |
|||||||
Peru |
- |
2,308 |
-100.0% |
- |
6,646 |
-100.0% |
|||||||
TOTAL |
56,795 |
71,543 |
-20.6% |
156,375 |
212,738 |
-26.5% |
|||||||
About Corporación América Airports
Corporación América Airports acquires, develops and operates airport concessions. Currently, the Company operates 53 airports in 6 countries across Latin America and Europe (Argentina, Brazil, Uruguay, Ecuador, Armenia and Italy). In 2021, Corporación América Airports served 35.7 million passengers, or 42.4% of the 84.2 million passengers served in 2019. The Company is listed on the New York Stock Exchange where it trades under the ticker “CAAP”. For more information, visit http://investors.corporacionamericaairports.com.
View source version on businesswire.com: https://www.businesswire.com/news/home/20220418005215/en/
Contacts
Investor Relations Contact
Patricio Iñaki Esnaola
Email: patricio.esnaola@caairports.com
Phone: +5411 4899-6716
