


TORONTO, ON / ACCESWIRE / December 21, 2023 / Signal Gold Inc. ("Signal Gold" or the "Company") (TSX:SGNL)(OTCQX:SGNLF) is pleased to announce diamond drill results from the initial step-out exploration program at the Company's Goldboro Project in Nova Scotia ("Goldboro", or the "Project"). The step-out drilling program, comprising 6,026.5 metres from 31 holes, targeted near-surface gold mineralization immediately west of the Goldboro Deposit and has now discovered gold mineralization up to at least 450 metres west of previous resource definition drilling. This initial program is part of a larger growth exploration program that has successfully tested a 1.4-kilometre strike extent of the Goldboro Trend west of the existing Goldboro Mineral Resource (Exhibit A).
"We are excited with the results of our initial step-out drilling completed in 2023, which has discovered further high-grade, near surface gold mineralization for at least 450 metres west of the Goldboro Deposit. We have now also completed the exploration drill program testing the IP geophysical target that extends 1.4 kilometres to the west through the past producing Dolliver Mountain Gold Mine*. While we wait for those drill results in the new year, we look forward to testing further resource growth potential on strike and adjacent to planned mine infrastructure, while continuing our regional exploration programs to demonstrate the scale potential of the Goldboro Gold District."
~ Kevin Bullock, President and CEO, Signal Gold Inc.
The current results comprise 1,446.5 metres of drilling from seven (7) diamond drill holes (BR-23-399, 402, and 404 to 407) and include 27 separate intersections of gold mineralization and three (3) instances of visible gold (Exhibits B and C). Selected composited highlights (core length) from the current drill holes including:
- 109.91 g/t gold over 0.5 metres (92.8 to 93.3 metres) in hole BR-23-399
- 2.44 g/t gold over 1.7 metres (167.6 to 169.3 metres) in hole BR-23-405
- 1.76 g/t gold over 2.4 metres (167.6 to 169.3 metres) in hole BR-23-399
Previously reported drilling in this area has outlined high-grade gold mineralization with selected composited highlights (core length) including:
- 26.09 g/t gold over 8.9 metres (105.5 to 114.4 metres) in hole BR-23-393 including 79.18 g/t gold over 0.5 metres and 371.59 g/t gold over 0.5 metres
- 11.79 g/t gold over 4.1 metres (49.9 to 54.0 metres) in hole BR-23-386 including 47.23 g/t gold over 1.0 metres
- 19.15 g/t gold over 1.2 metres (114.7 to 115.9 metres) in hole BR-23-388
- 10.85 g/t gold over 1.3 metres (209.6 to 210.9 metres) in hole BR-23-395
- 21.16 g/t gold over 0.7 metres (80.5 to 81.2 metres) in hole BR-23-397
Drilling in the area up to 450 metres west of the Goldboro Deposit continues to identify gold mineralization and demonstrate that the mineralization remains open at depth and to the west towards the past producing Dolliver Mountain Gold Mine*, where the Company recently completed drilling (Exhibit A).
Drill holes BR-23-402 and 406 were designed to target IP chargeability anomalies parallel to, but north and south of the main host structure and IP chargeability Trend. Drill hole BR-23-402 to the north of the Goldboro Trend did not intersect any significant gold mineralization associated with the flanking chargeability response. Similarly drill hole BR-23-407 to the south of the Goldboro Trend did not intersect significant gold mineralization associated with the flanking chargeability response but did intersect gold deeper within the hinge of the anticline within the West Goldbrook System.
Assays are pending for an additional 32 drill holes totaling 6,195 metres from the Drill Program and will be reported in future news releases.
*Operations began at the Dolliver Mountain Gold Mine in 1901 and the operation ceased in 1904.
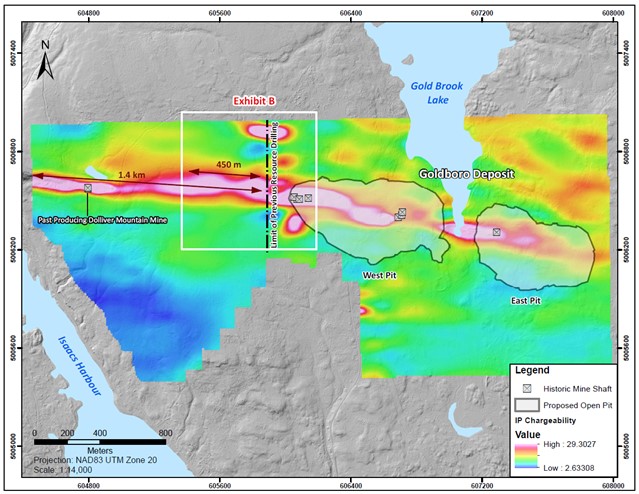
Exhibit A. A map showing the location of the West and East proposed pits of the Goldboro Project and the location of the past producing Dolliver Mountain Gold Mine one (1) kilometre to the west. Also shown is the trend of the host structure to the Goldboro Deposit and its anticipated westerly extension as shown by a recently completed IP geophysical survey. The existing data indicates there is potential for further mineralization over a minimum 2.0-kilometre strike based on current testing of the initial 1.4 kilometres guided by the IP Survey.
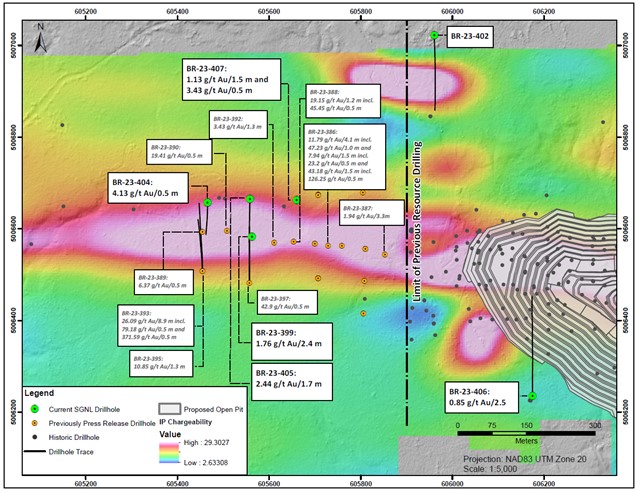
Exhibit B. A plan map showing the location of drill holes BR-23-399, 402, and 404 to 407, against the backdrop of IP chargeability data. Drill holes BR-23-399, 404, 405 and 407 holes, along with previously reported assays from September 12, 2023, indicate that the host structure, alteration, and gold mineralization persist westward for at least 450 metres.
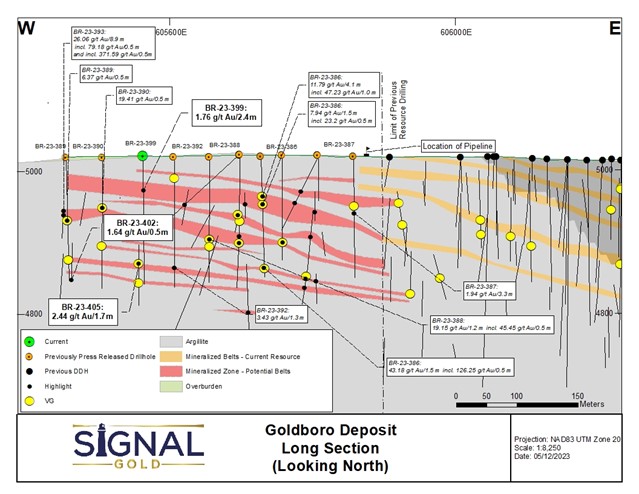
Exhibit C. A vertical longitudinal section through the west end of the Goldboro Deposit and including the area of recent the drill program. The drill program demonstrates that the structure that hosts the Goldboro Deposit and the same style of alteration and mineralization exist west of previous drill sections demonstrating that the Deposit has the potential to be expanded westward. Potential mineralized belts are shown as currently interpreted.
A table of selected composited assay results from the drill program
| Drill hole | From (m) | To (m) | Interval (m) | Gold (g/t) | Visible Gold |
BR-23-399 |
17.6 |
18.1 |
0.5 |
1.84 |
|
and |
33.2 |
33.7 |
0.5 |
1.95 |
|
and |
39.7 |
43.0 |
3.3 |
0.66 |
|
and |
44.2 |
46.6 |
2.4 |
1.76 |
|
and |
51.1 |
51.6 |
0.5 |
2.12 |
|
and |
56.3 |
57.0 |
0.7 |
2.31 |
|
and |
92.8 |
93.3 |
0.5 |
109.91 |
|
and |
118.6 |
121.7 |
3.1 |
1.14 |
|
and |
132.1 |
132.6 |
0.5 |
0.93 |
|
and |
153.0 |
155.4 |
2.4 |
1.51 |
|
and |
158.7 |
159.2 |
0.5 |
4.69 |
|
BR-23-404 |
54.8 |
55.3 |
0.5 |
4.13 |
|
and |
120.5 |
121.5 |
1.0 |
1.70 |
|
and |
180.7 |
181.2 |
0.5 |
1.64 |
|
| BR-23-404A | 37.4 |
39.5 |
2.1 |
1.01 |
|
| BR-23-405 | 87.5 |
88.1 |
0.6 |
3.82 |
|
and |
122.6 |
123.1 |
0.5 |
1.07 |
|
and |
129.8 |
130.3 |
0.5 |
1.87 |
|
and |
167.6 |
169.3 |
1.7 |
2.44 |
|
including |
168.4 |
169.3 |
0.9 |
4.33 |
VG |
and |
193.9 |
195.0 |
1.1 |
0.53 |
|
| BR-23-406 | 185.4 |
187.9 |
2.5 |
0.85 |
VG |
and |
234.5 |
235.0 |
0.5 |
0.50 |
|
and |
288.2 |
288.7 |
0.5 |
0.84 |
VG |
and |
300.0 |
301.2 |
1.2 |
0.71 |
|
and |
307.7 |
308.2 |
0.5 |
1.11 |
|
| BR-23-407 | 69.2 |
70.7 |
1.5 |
1.13 |
|
and |
217.1 |
217.6 |
0.5 |
3.73 |
Footnotes:
- Intervals are reported as core length only. True widths are estimated to be between 70% and 100% of the core length.
- All drill hole results are reported using fire assay only. See notes on QAQC procedures at the bottom of this press release.
- All drill holes not reported in the table above did not encounter significant mineralization, with the exception of drill holes BR-23-402.
- Drill holes were oriented along a north-south trend with holes on the north limb of the hosting anticlinal structure drilled southward and holes located south of the anticlinal structure drilled northward. The dip of holes is dependent upon the location relative to the anticline with the goal of intersecting mineralized zones orthogonally.
All samples and the resultant composites referred to in this release are collected using QA/QC protocols including the regular insertion of standards and blanks within the sample batch for analysis and check assays of select samples. All samples quoted in this release were analyzed at Eastern Analytical Ltd. in Springdale, NL, for Au by fire assay (30 g) with an AA finish.
All assays in this press release are reported as fire assays only. For samples analyzing greater than 0.5 g/t Au via 30 g fire assay, these samples will be re-analyzed at Eastern Analytical Ltd. via total pulp metallics. For the total pulp metallics analysis, the entire sample is crushed to -10mesh and pulverized to 95% -150mesh. The total sample is then weighed and screened to 150mesh. The +150mesh fraction is fire assayed for Au, and a 30 g subsample of the -150mesh fraction analyzed via fire assay. A weighted average gold grade is calculated for the final reportable gold grade. Total pulp metallics assays for drill holes sited within this press release may be updated in a future news release.
The drill program was partially funded by the MRDF Shared Funding Exploration Grant (MRDF-2023-SF-06). The Company wishes to thank the Government of Nova Scotia for the partial funding of the drill program.
This news release has been reviewed and approved by Paul McNeill, P.Geo., VP Exploration with Signal Gold Inc., a "Qualified Person", under National Instrument 43-101 Standard for Disclosure for Mineral Projects.
ABOUT SIGNAL GOLD
Signal Gold is advancing the Goldboro Gold Project in Nova Scotia, a significant growth project subject to a positive Feasibility Study which demonstrates an approximately 11-year open pit life of mine ("LOM") with average gold production of 100,000 ounces per annum and an average diluted grade of 2.26 grams per tonne gold. (Please see the ‘NI 43-101 Technical Report and Feasibility Study for the Goldboro Gold Project, Eastern Goldfields District, Nova Scotia' on January 11, 2022, for further details). On August 3, 2022, the Goldboro Project received its environmental assessment approval from the Nova Scotia Minister of Environment and Climate Change, a significant regulatory milestone which enables the Company to commence site-specific permitting processes including the Industrial Approval and Crown Land Lease and Mining Lease applications. The Goldboro Project also has potential for further Mineral Resource expansion, particularly towards the west along strike and at depth. A future study will consider upgrading and expanding potentially mineable underground Mineral Resources as part of the longer-term mine development plan.
FORWARD-LOOKING STATEMENTS
This news release contains "forward-looking information" within the meaning of applicable Canadian and United States securities legislation. Generally, forward-looking information can be identified by the use of forward-looking terminology such as "plans", "expects", or "does not expect", "is expected", "budget", "scheduled", "estimates", "forecasts", "intends", "anticipates", or "does not anticipate", or "believes" or variations of such words and phrases or state that certain actions, events or results "may", "could", "would", "might", or "will be taken", "occur", or "be achieved". Forward-looking information is based on the opinions and estimates of management at the date the information is made, and is based on a number of assumptions and is subject to known and unknown risks, uncertainties and other factors that may cause the actual results, level of activity, performance or achievements of Signal Gold to be materially different from those expressed or implied by such forward-looking information, including risks associated with the exploration, development and mining such as economic factors as they effect exploration, future commodity prices, changes in foreign exchange and interest rates, actual results of current production, development and exploration activities, government regulation, political or economic developments, environmental risks, permitting timelines, capital expenditures, operating or technical difficulties in connection with development activities, employee relations, the speculative nature of gold exploration and development, including the risks of diminishing quantities of grades of resources, contests over title to properties, and changes in project parameters as plans continue to be refined as well as those risk factors discussed in Signal Gold's annual information form for the year ended December 31, 2022, available on www.sedarplus.com. Although Signal Gold has attempted to identify important factors that could cause actual results to differ materially from those contained in forward-looking information, there may be other factors that cause results not to be as anticipated, estimated or intended. There can be no assurance that such information will prove to be accurate, as actual results and future events could differ materially from those anticipated in such information. Accordingly, readers should not place undue reliance on forward-looking information. Signal Gold does not undertake to update any forward-looking information, except in accordance with applicable securities laws.
FOR ADDITIONAL INFORMATION CONTACT:
|
Signal Gold Inc. Kevin Bullock President and CEO (647) 388-1842 kbullock@signalgold.com |
Reseau ProMarket Inc. Dany Cenac Robert |
SOURCE: Signal Gold Inc.
View the original press release on accesswire.com
