


The Procter & Gamble Company (PG) holds a solid position in the consumer goods industry and is renowned for its robust portfolio of brands and global reach. Its stronghold within the consumer staples sector, known for being resilient throughout the economic cycle, has garnered steadfast popularity among investors.
Nonetheless, earlier this month, PG, with many other companies was accused in lawsuits of deceiving consumers about cold medicines containing an ingredient that a unanimous U.S. Food and Drug Administration advisory panel declared ineffective.
In light of these legal challenges, the company's shares could encounter significant volatility in the market, impacting short-term performance. Furthermore, PG's stock trades at a substantially high valuation compared to its industry peers. Thus, I think investors should hold off for a more opportune entry point into PG.
While navigating these concerns, let us delve into a detailed analysis of some key metrics of PG.
Procter & Gamble Financial Performance: 2020-2023
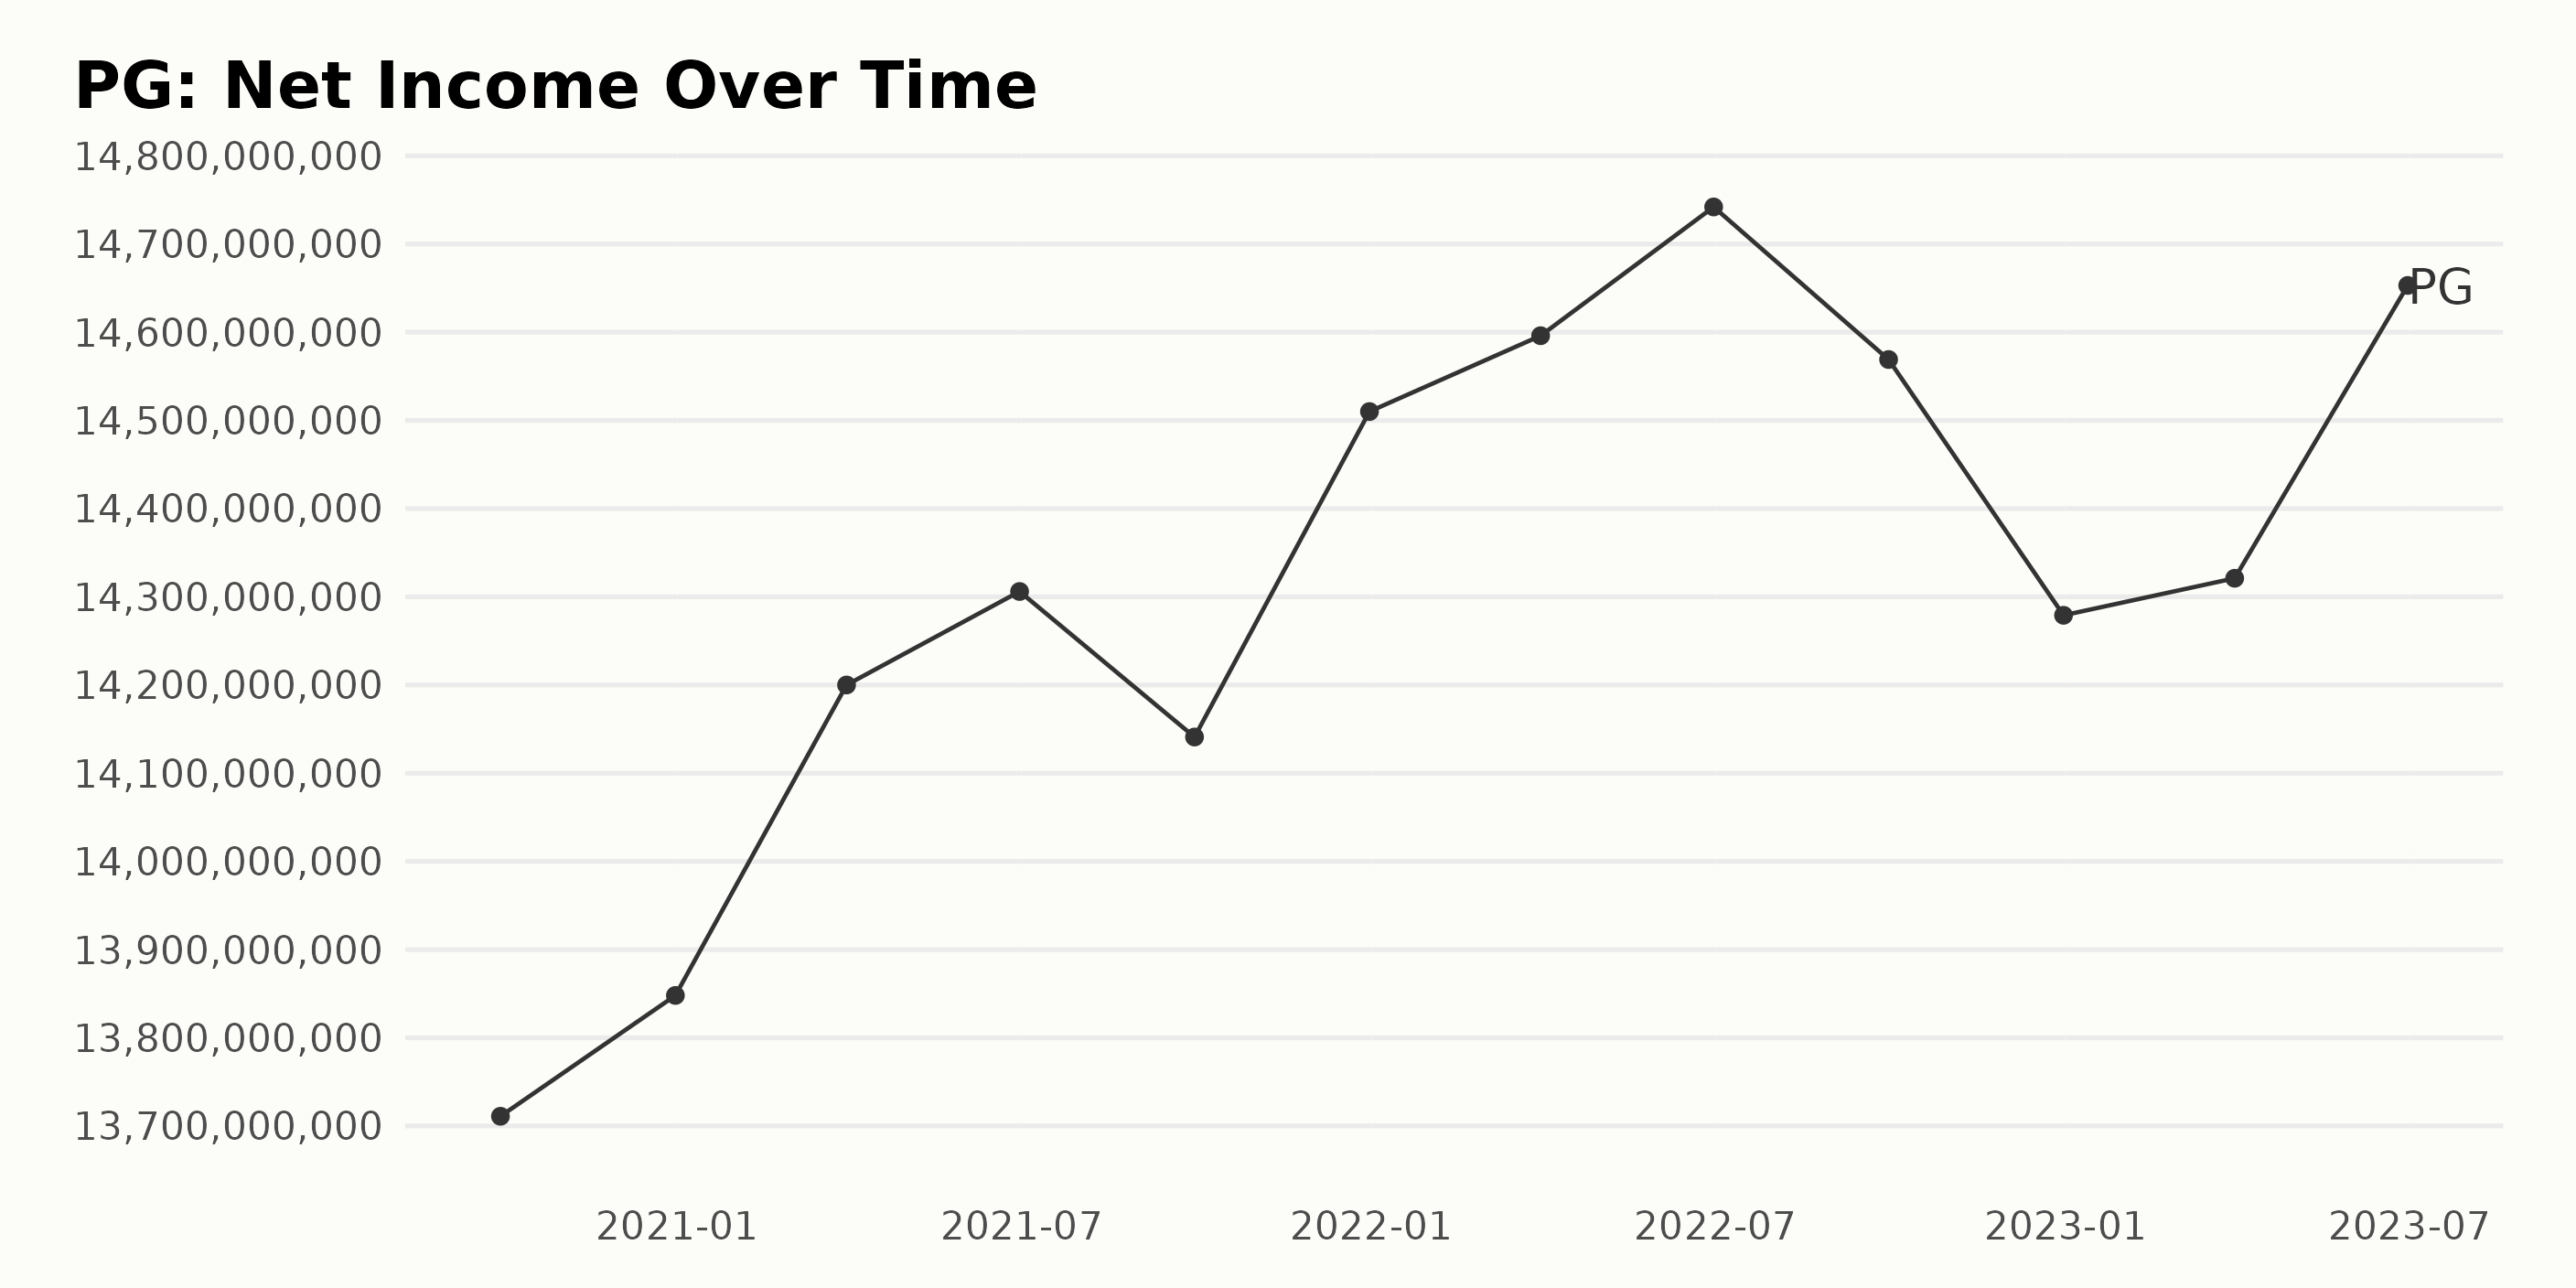
Based on the data provided, PG has experienced a general upward trend in trailing-12-month net income from September 2020 to June 2023. This data exhibits certain fluctuations but maintains an overall growth. Here are notable key points:
- September 30, 2020: PG's net income stood at $13.71 billion.
- The net income experienced an increase in December 2020, reaching $13.85 billion, then continued to rise, reaching a peak of $14.31 billion in June 2021.
- September 2021 showed a slight drop in net income to $14.14 billion, which, despite minor fluctuations, steadily increased to $14.74 billion in June 2022.
- The net income slightly decreased to $14.57 billion in September 2022 and, more notably, dropped to $14.28 billion on December 31, 2022.
- Despite the drop, the figures showed resilience, with net income rebounding upwards to $14.65 billion by June 2023.
Calculating from the first value to the last, the growth rate for the given period is approximately 6.8%. These descriptors are dependent on the specific timeframe, representing noteworthy fluctuations while emphasizing a broader upward net income trend for PG.
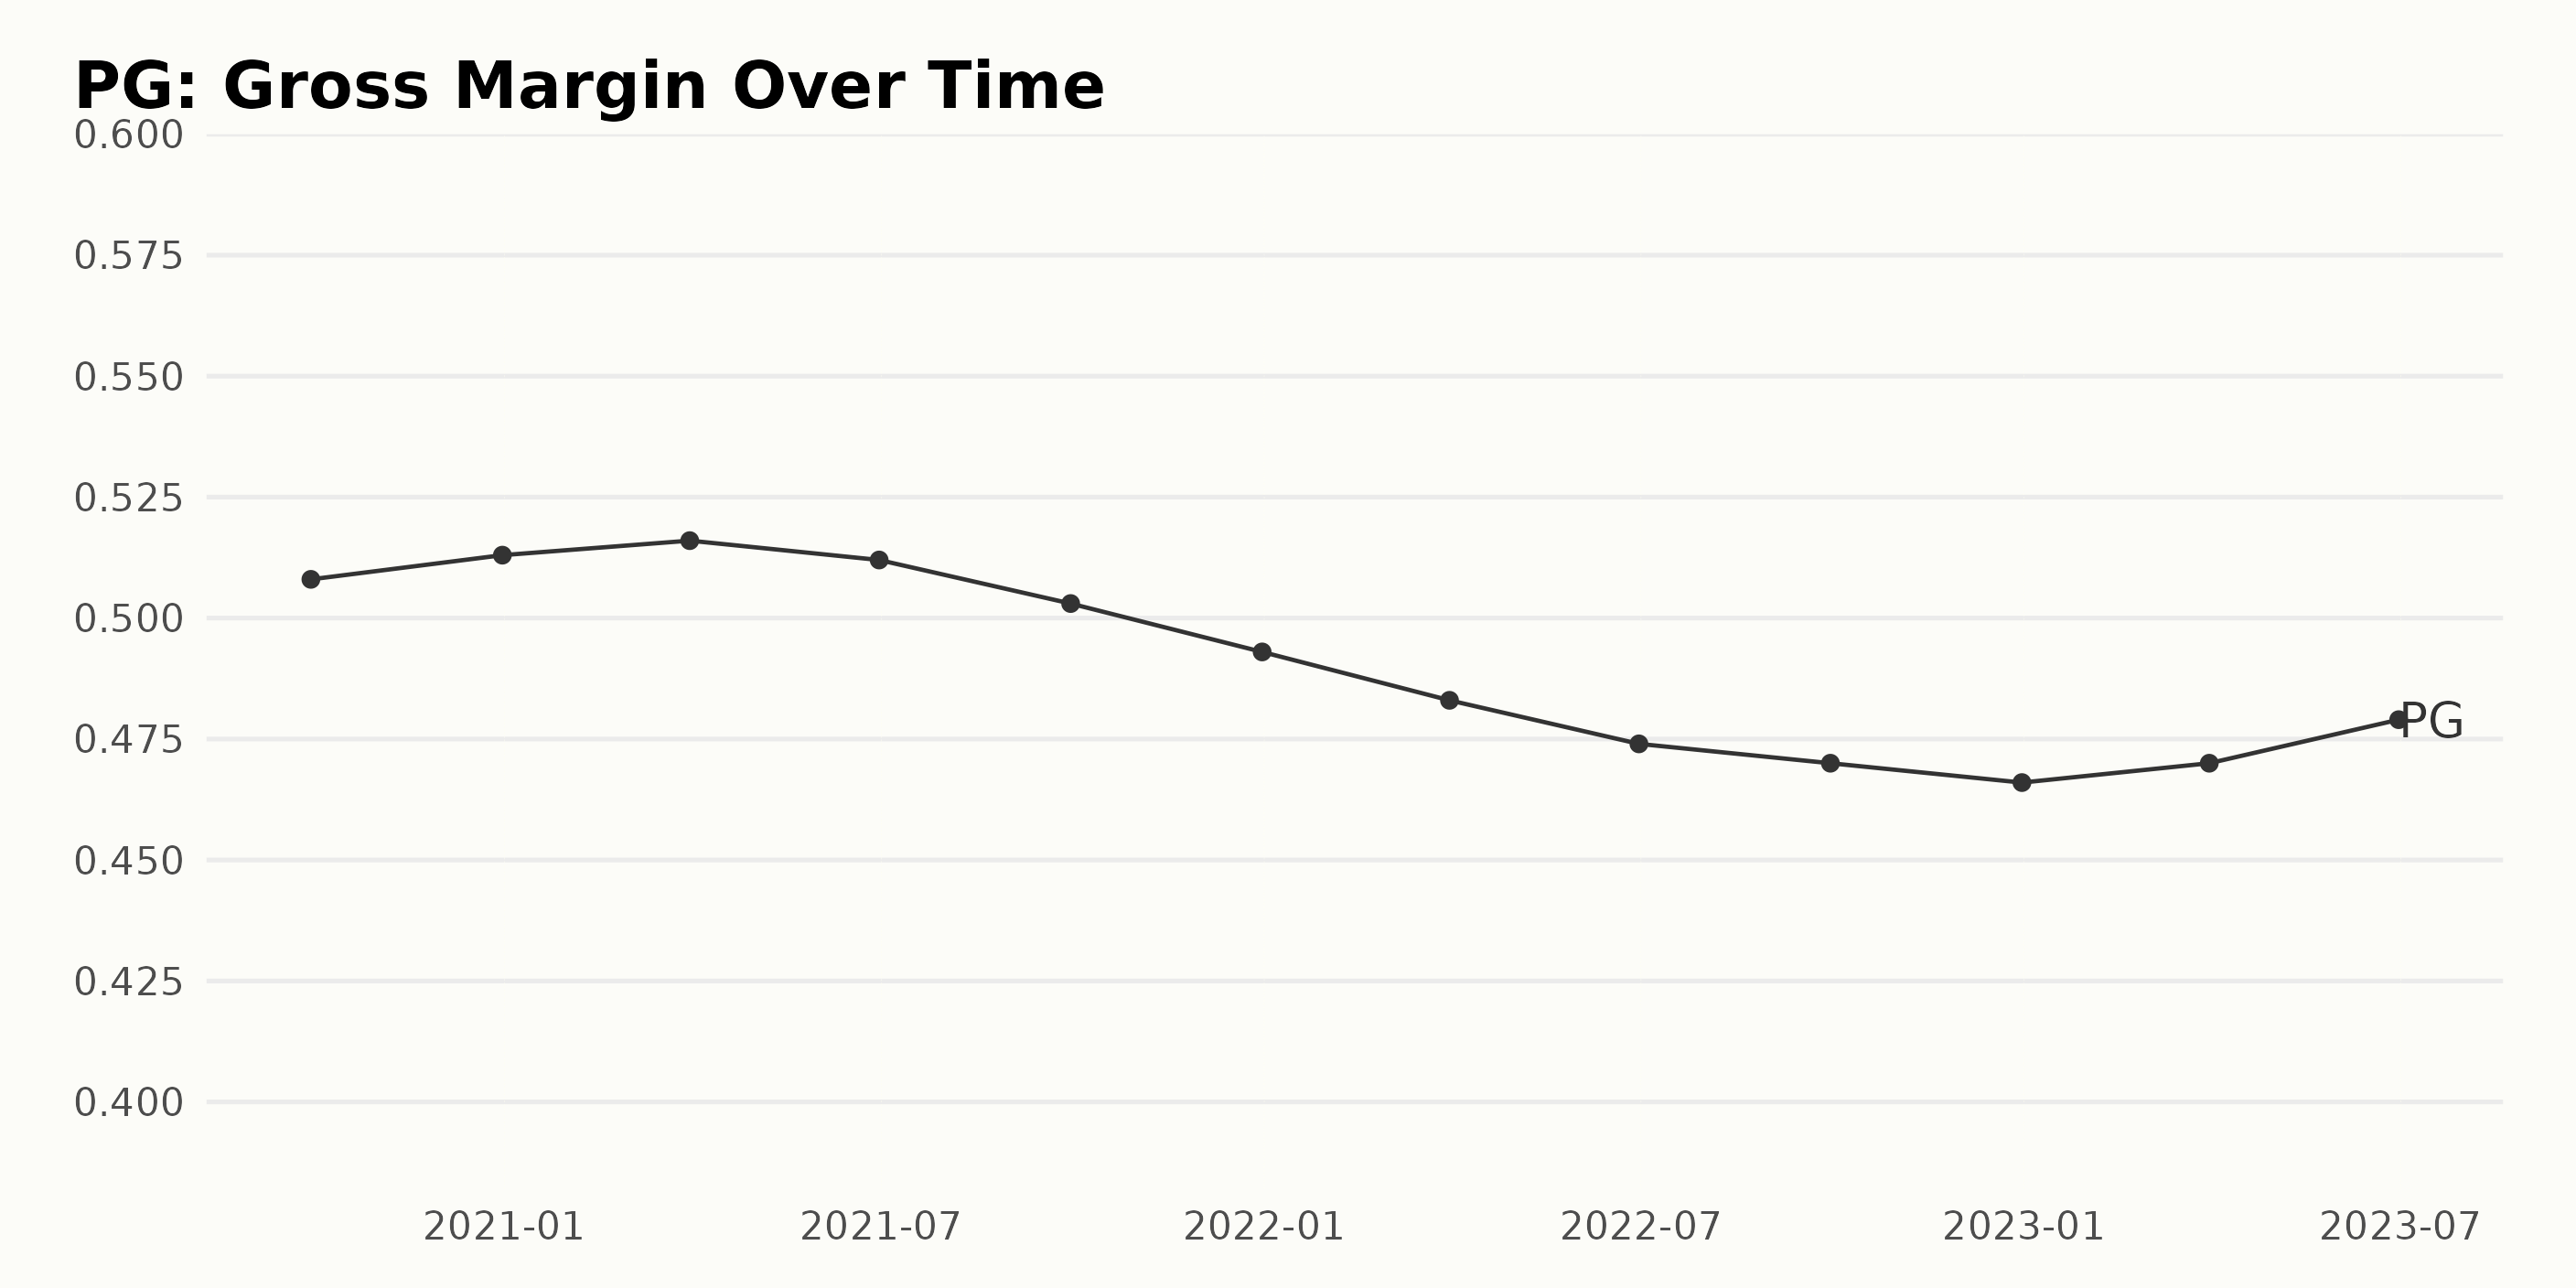
Here's a summary of the Gross Margin trend and fluctuations for PG:
- At the end of the third quarter of 2020, PG's Gross Margin was noted as 50.8%.
- This figure slightly increased to 51.3% by the end of December 2020 and further spiked to 51.6% by March 2021.
- However, the Gross Margin started decreasing after that, falling to 51.2% in June 2021, 50.3% at the close of September 2021 and was down to 49.3% by the end of December 2021.
- PG's Gross Margin continued to dip in the first half of 2022, standing at 48.3% at the close of the first quarter and dropping to 47.4% by the end of June 2022, reaching 47.0% in September 2022 and 46.6% in December 2022.
- Post this downward move, PG's Gross Margin showed some recovery in 2023, standing at 47.0% in March 2023 and then increasing to 47.9% by the end of June 2023.
Broadly, the Gross Margin of PG showed a general declining trend over the period 2020 to 2022. The value has notably fallen from its initial count of 50.8% to 46.6% over a roughly two-years span, indicating a decrease of around 8.2%. Afterward, in the first and second quarter of 2023, we see an encouraging reversal of this trend with a slight increase, moving up to 47.9%. Summarising, the recent periods' data confirms volatility in PG's Gross Margin figures with a general trend of decline from late 2020 to the end of 2022, followed by a slight uptick starting in 2023.
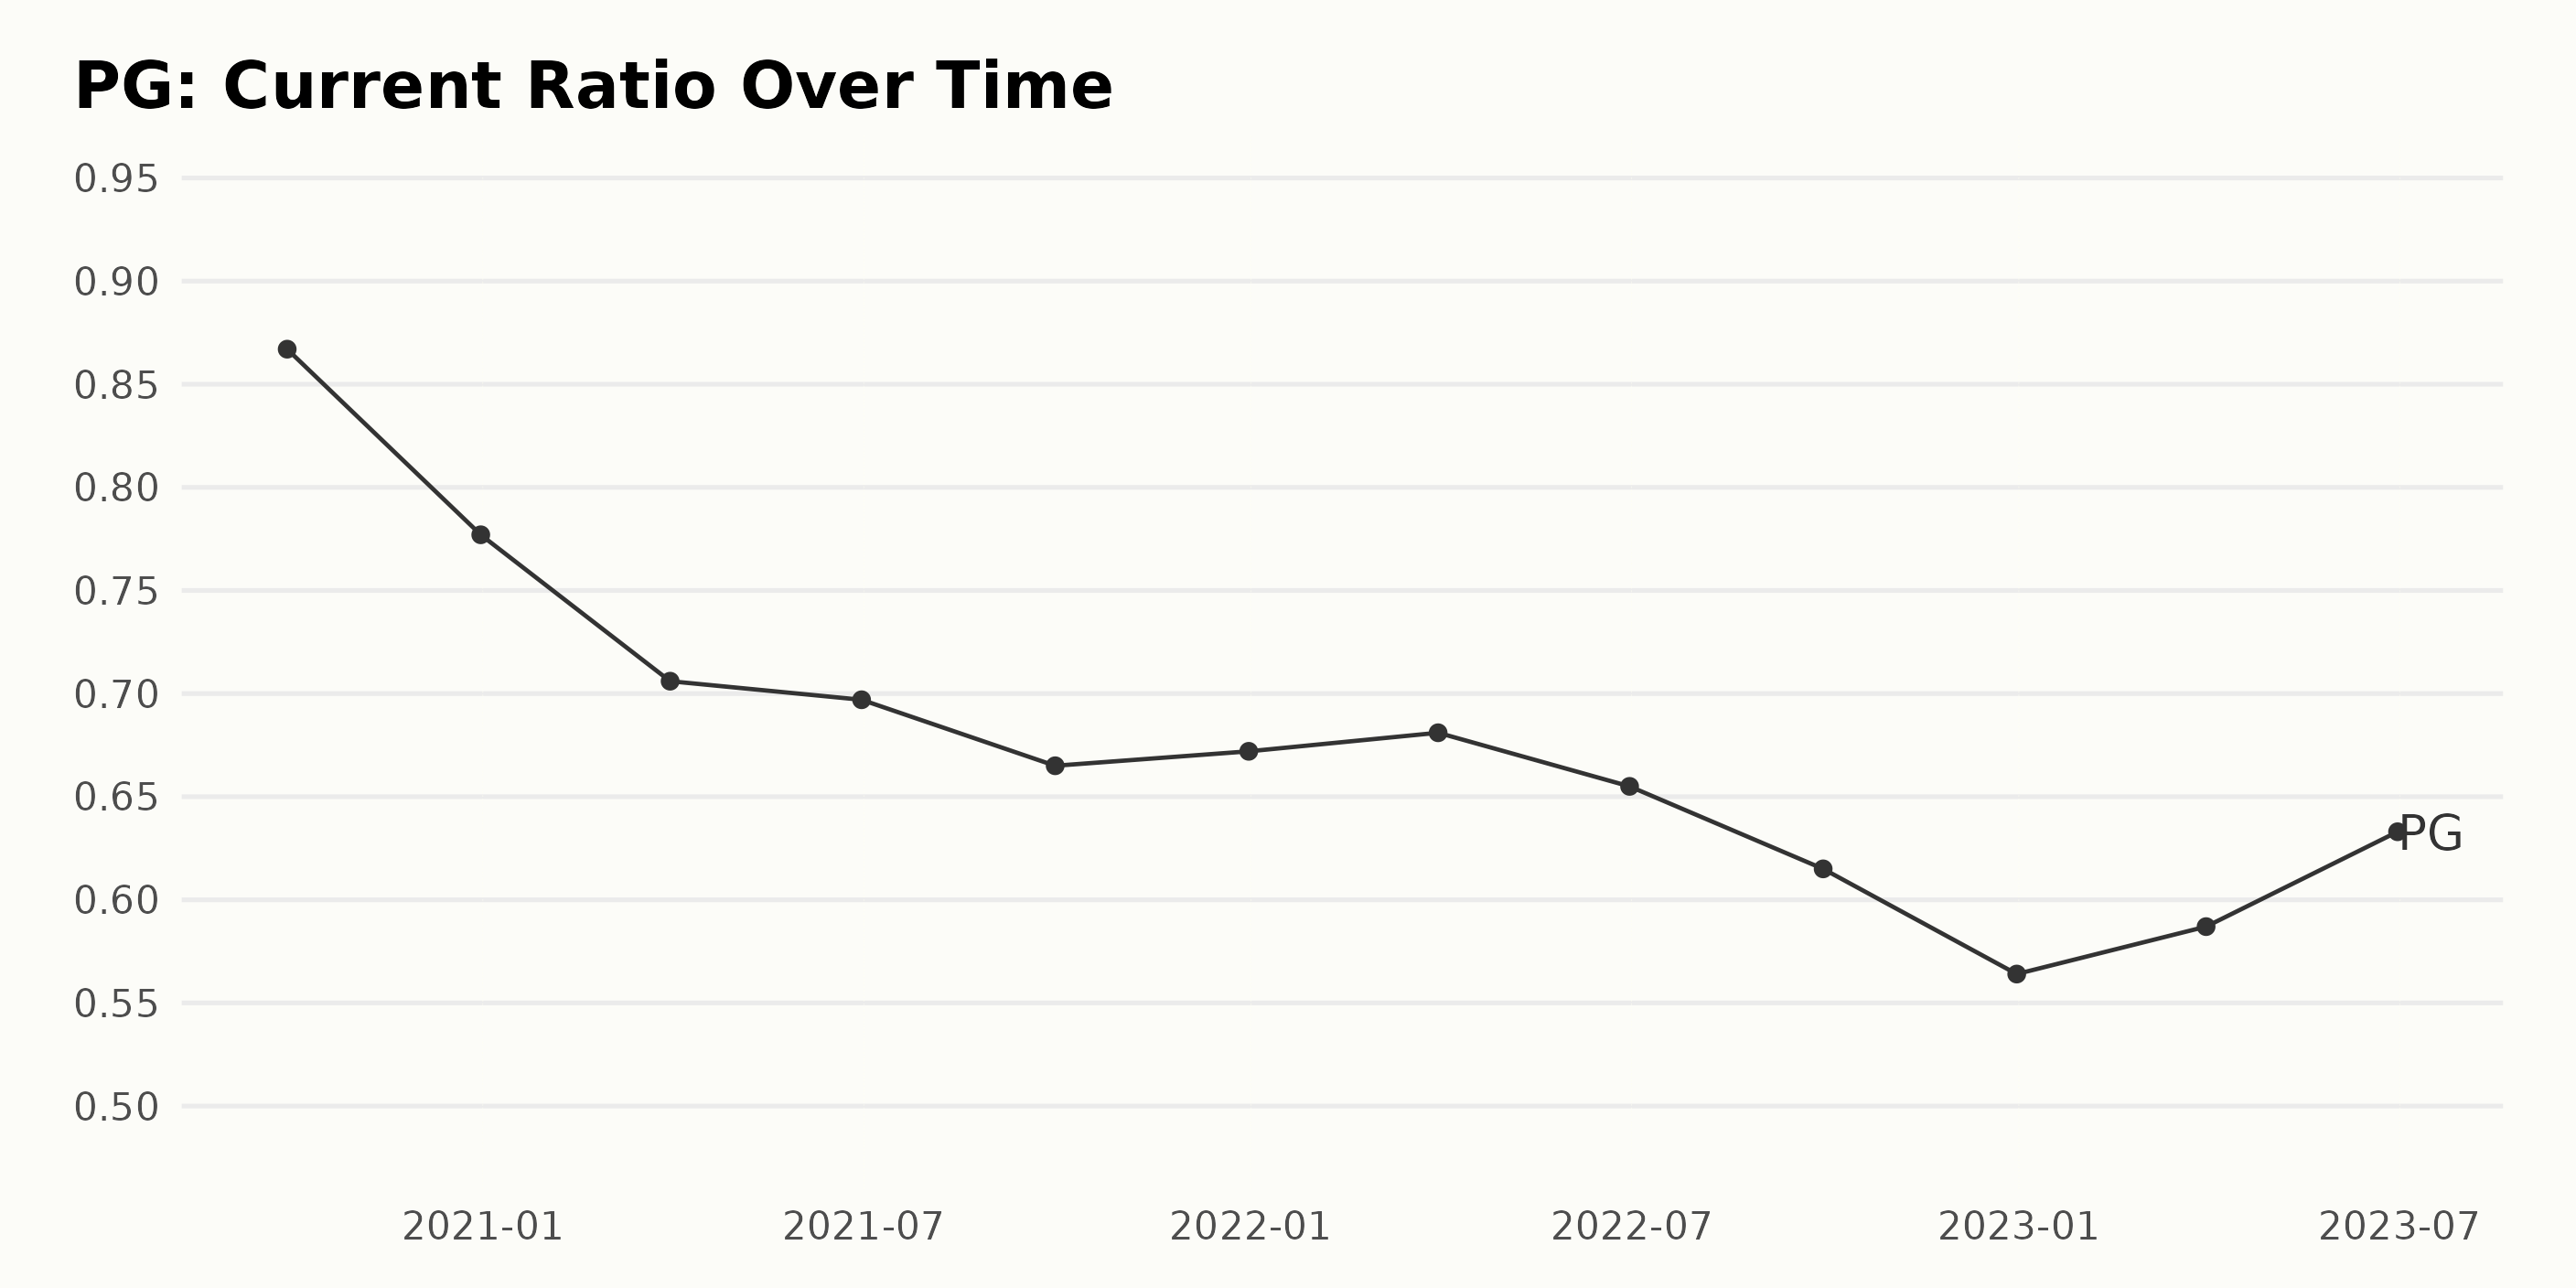
The Current Ratio of PG has shown a decreasing trend from September 2020 to December 2022, with some fluctuations throughout the period. Here are notable points:
- The Current Ratio in September 2020 was 0.87.
- By December 2020, it had dropped to 0.78 and continued to fall to 0.71 until March 2021.
- There was a slight decrease to 0.70 by June 2021 and a steady decline, reaching 0.67 by December 2021.
- Despite a small rise to 0.68 in March 2022, the ratio experienced a continuous fall, reaching 0.56 by December 2022.
- In the first half of 2023, there was an increase as the ratio went up to 0.63 by June 2023.
Considering the overall trend from the start date to the last value available, the overall reduction amounted to approximately -26.90%.
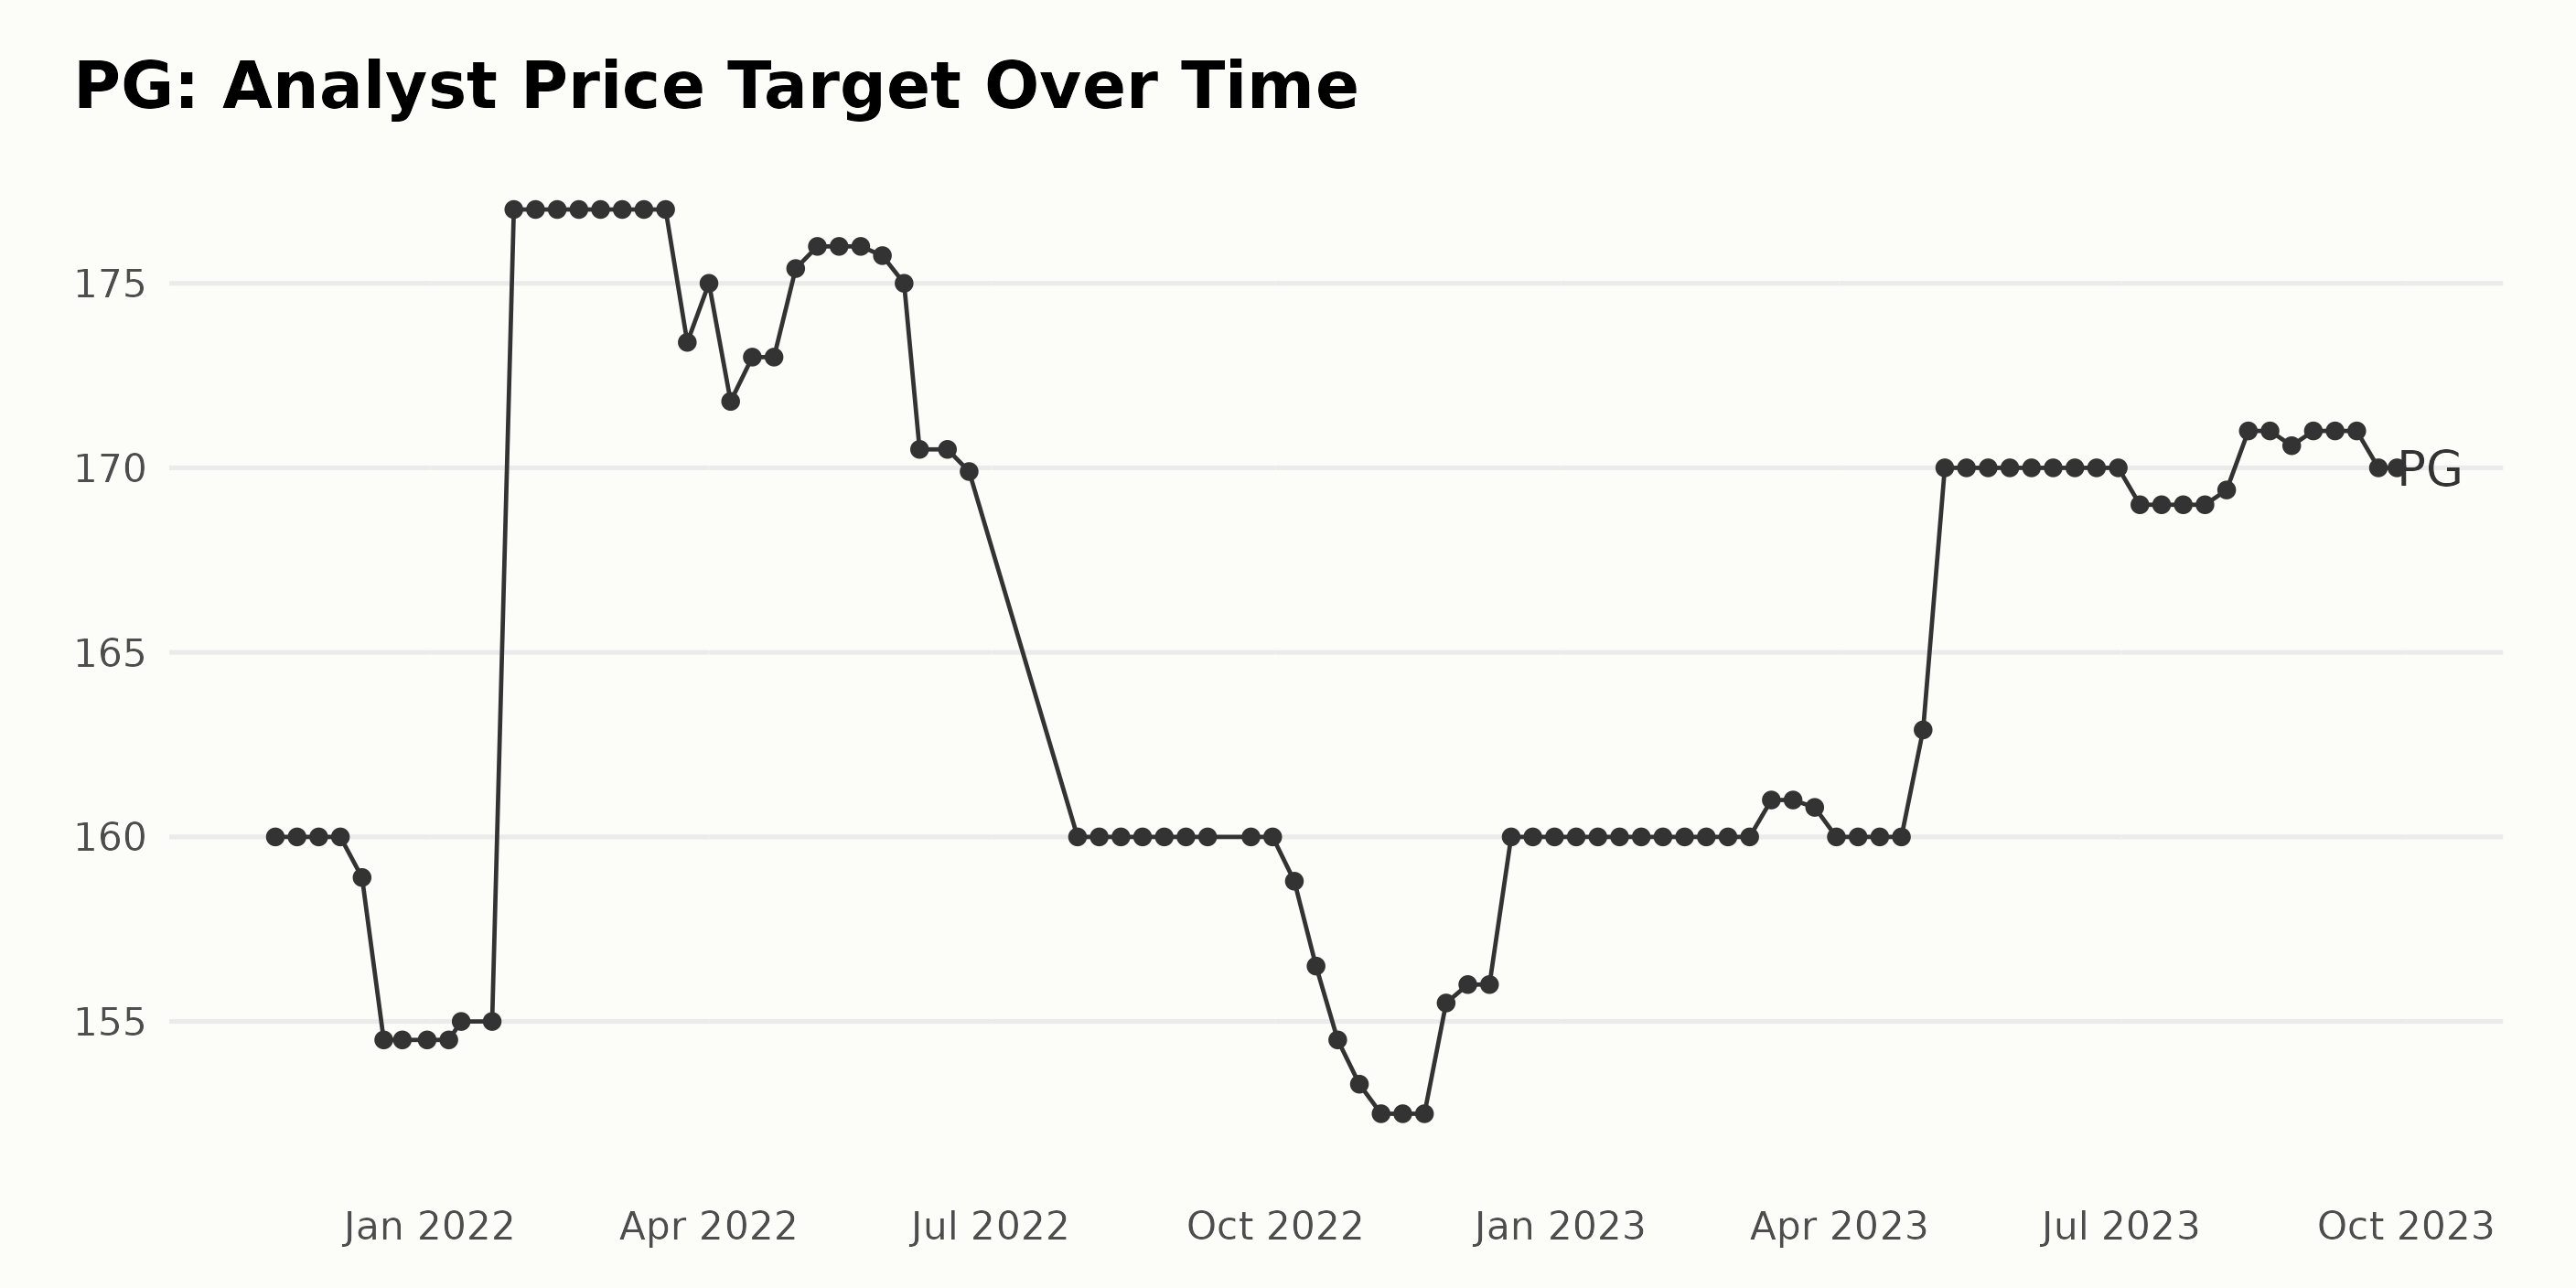
From November 2021 to September 2023, the Analyst Price Target for PG followed a general trend with several fluctuations. Key observations include:
- The price target began at $160 in November 2021 and experienced a slight drop to reach $152.5 by November 2022.
- A momentary peak was observed on January 28, 2022, when the value rose significantly to $177 before declining gradually over the next few months.
- After several minor oscillations between $154.5 and $176, the target reduced to a low of $152.5 in November 2022. This represents a decrease of approximately 4.6% from the start value.
- There was a steady phase from December 2022 to March 2023, where the price target remained constant at $160.
- Prompted by a slight growth, the price target reached $170 by May 2023. By attaining this increase of 6.25% from the start of the year, it marked a positive turnaround for the Procter & Gamble Company, according to the Analyst Price Target.
- In the final reported period between May and September 2023, the value showed minor volatility, oscillating mostly in the range of $169 and $171.
- Ultimately, the end value in September 2023 was held constant at $170. This represents a marginal increase of 6.25% from the start of the time series.
In essence, the Analyst Price Target for the Procter & Gamble Company had experienced both ups and downs over the reported period but ultimately showed a small overall increase. While recent data saw more subtle fluctuations, earlier times experienced more significant increases and decreases that made a noticeable impact on overall trends.
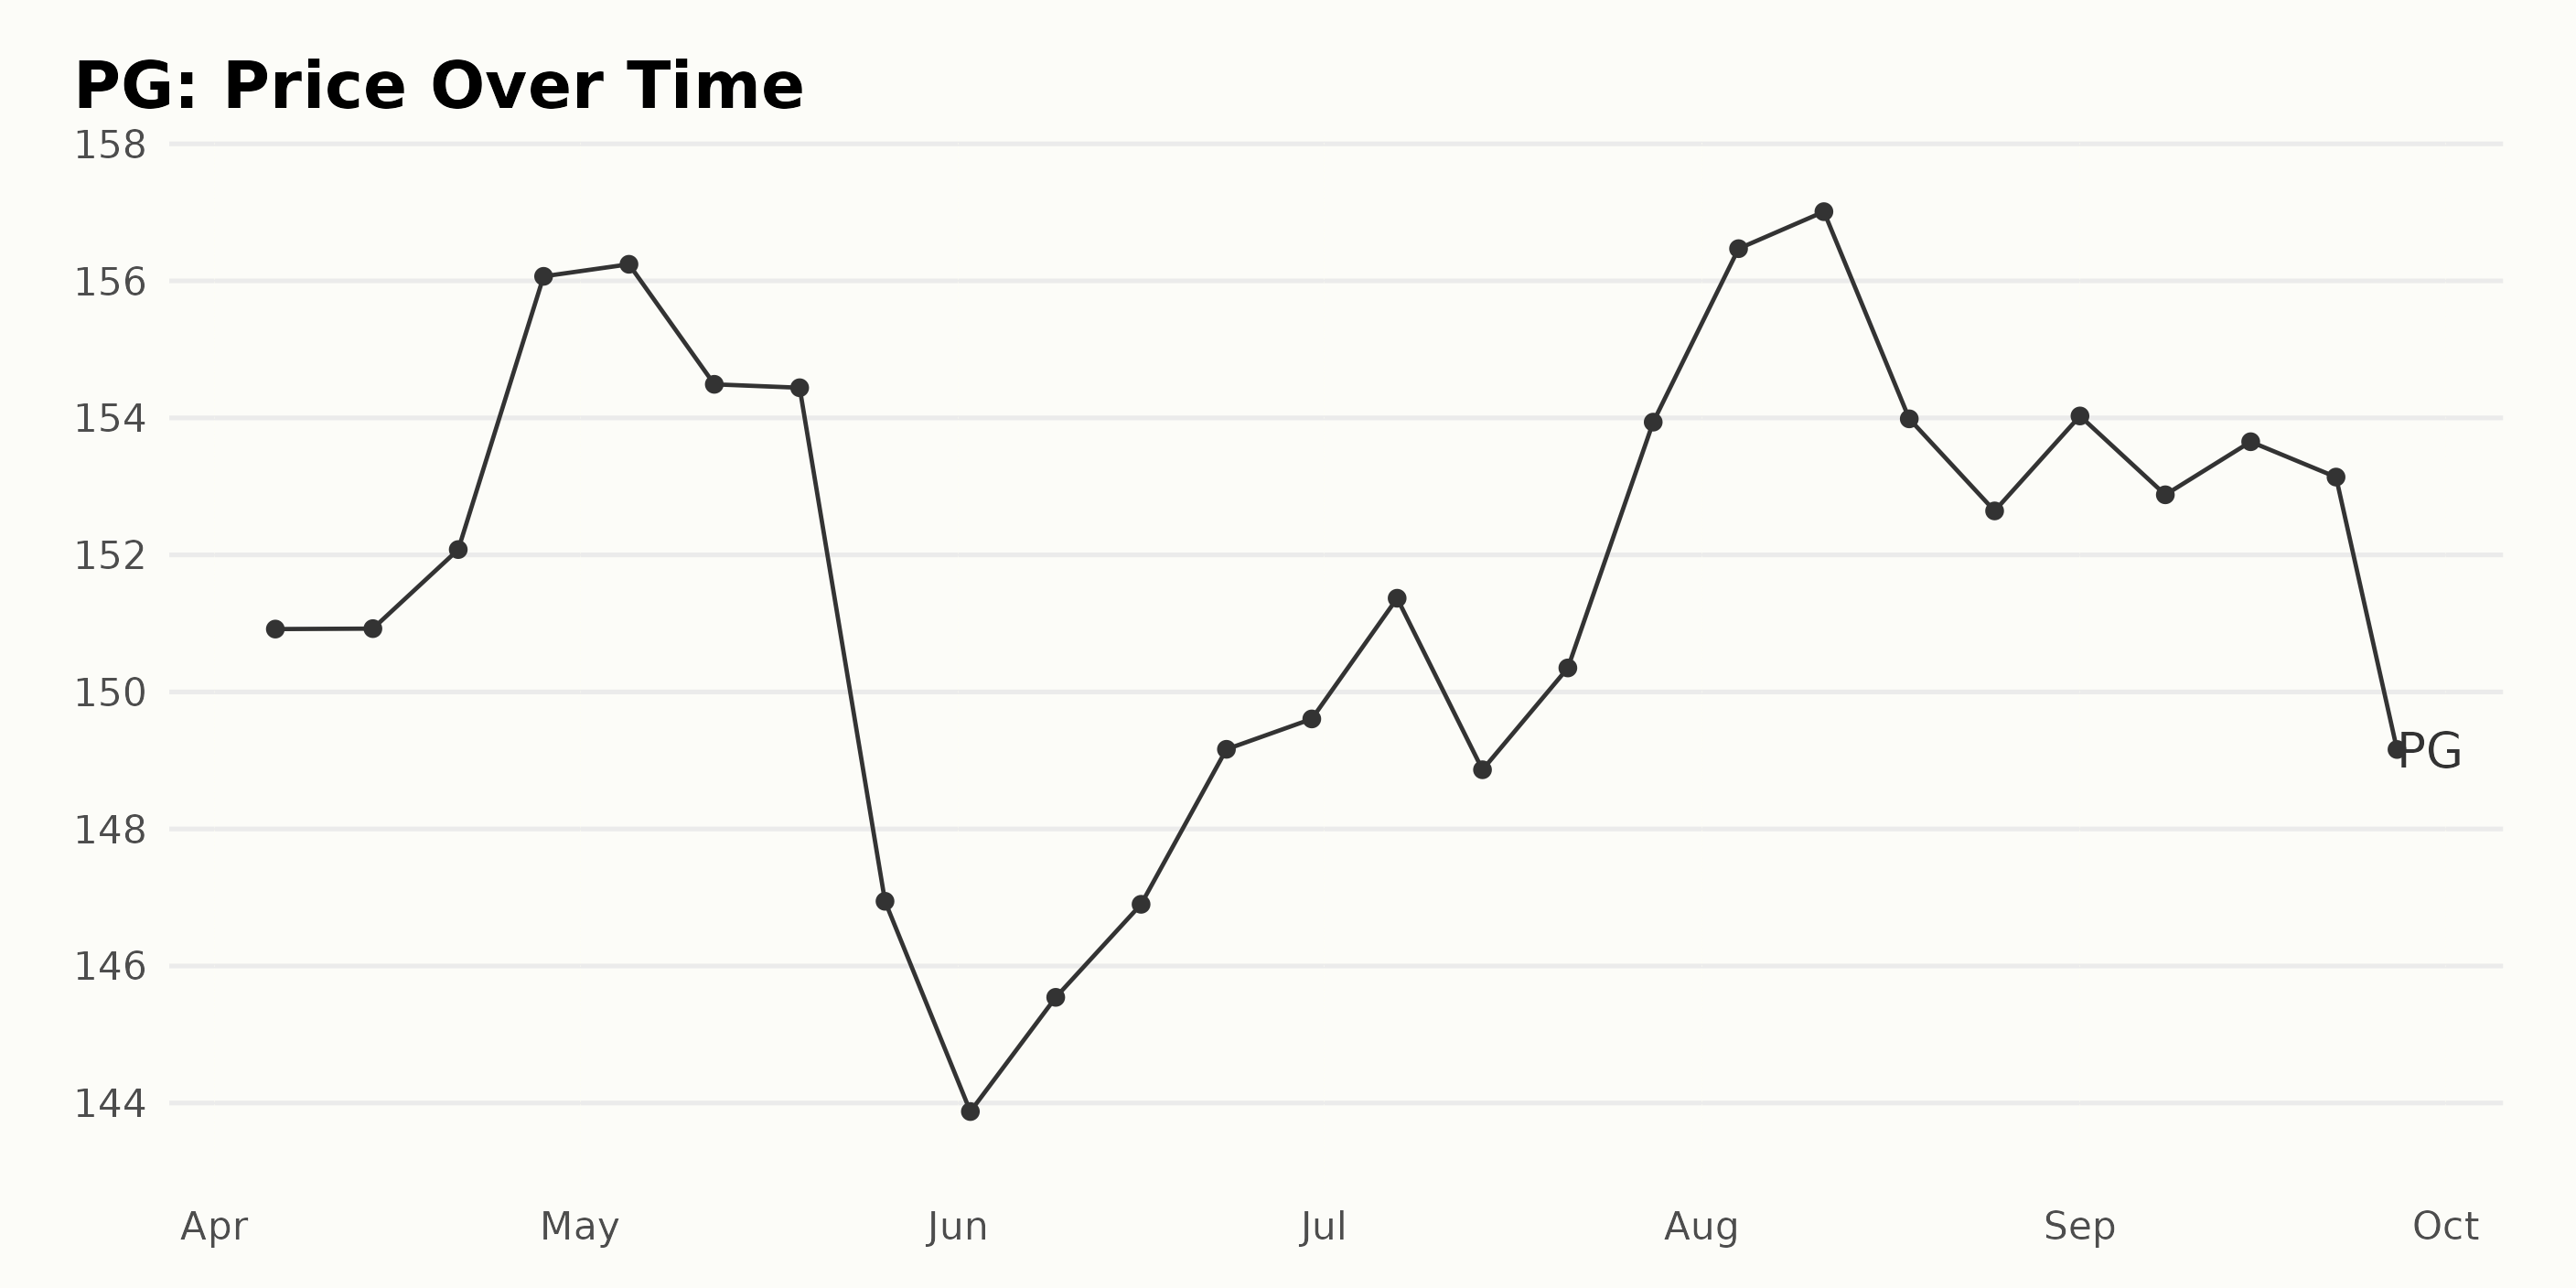
Procter & Gamble Share Price Trends and Growth Rates: April - September 2023
The price trends and growth rates of PG share prices from April to September 2023 based on the provided data in JSON format are as follows:
- The company's shares started at a price of $150.92 on April 6, 2023, and experienced a modest increase in the following weeks, peaking at $156.07 by the end of April.
- In May 2023, the price remained relatively stable at the beginning, ranging from around $156.24 to $154.49, however, there was a significant drop towards the month's end, falling to $146.94.
- In June 2023, the share price saw a slow recovery, starting from $143.88 and rising to $149.61 by the month's end.
- There was another increase to $151.37 on July 7, followed by a small drop and then an increase again to reach a price of $153.94 near the end of the month. The price peaked at $157.01 in August, showing an overall upward growth trend over these months.
- However, there was a substantial decrease afterward, with the price dropping to $152.64 by August 25, 2023. The prices fluctuated in the month of September, oscillating between $153.65 and $149.16.
The overall growth rate during this period shows an increase from $150.92 to $149.16, indicating a slight overall decline in the share prices of Procter & Gamble between April and September 2023. The trend shows periods of both increase and decrease, with no clear pattern of acceleration or deceleration in the rate of change. Here is a chart of PG's price over the past 180 days.
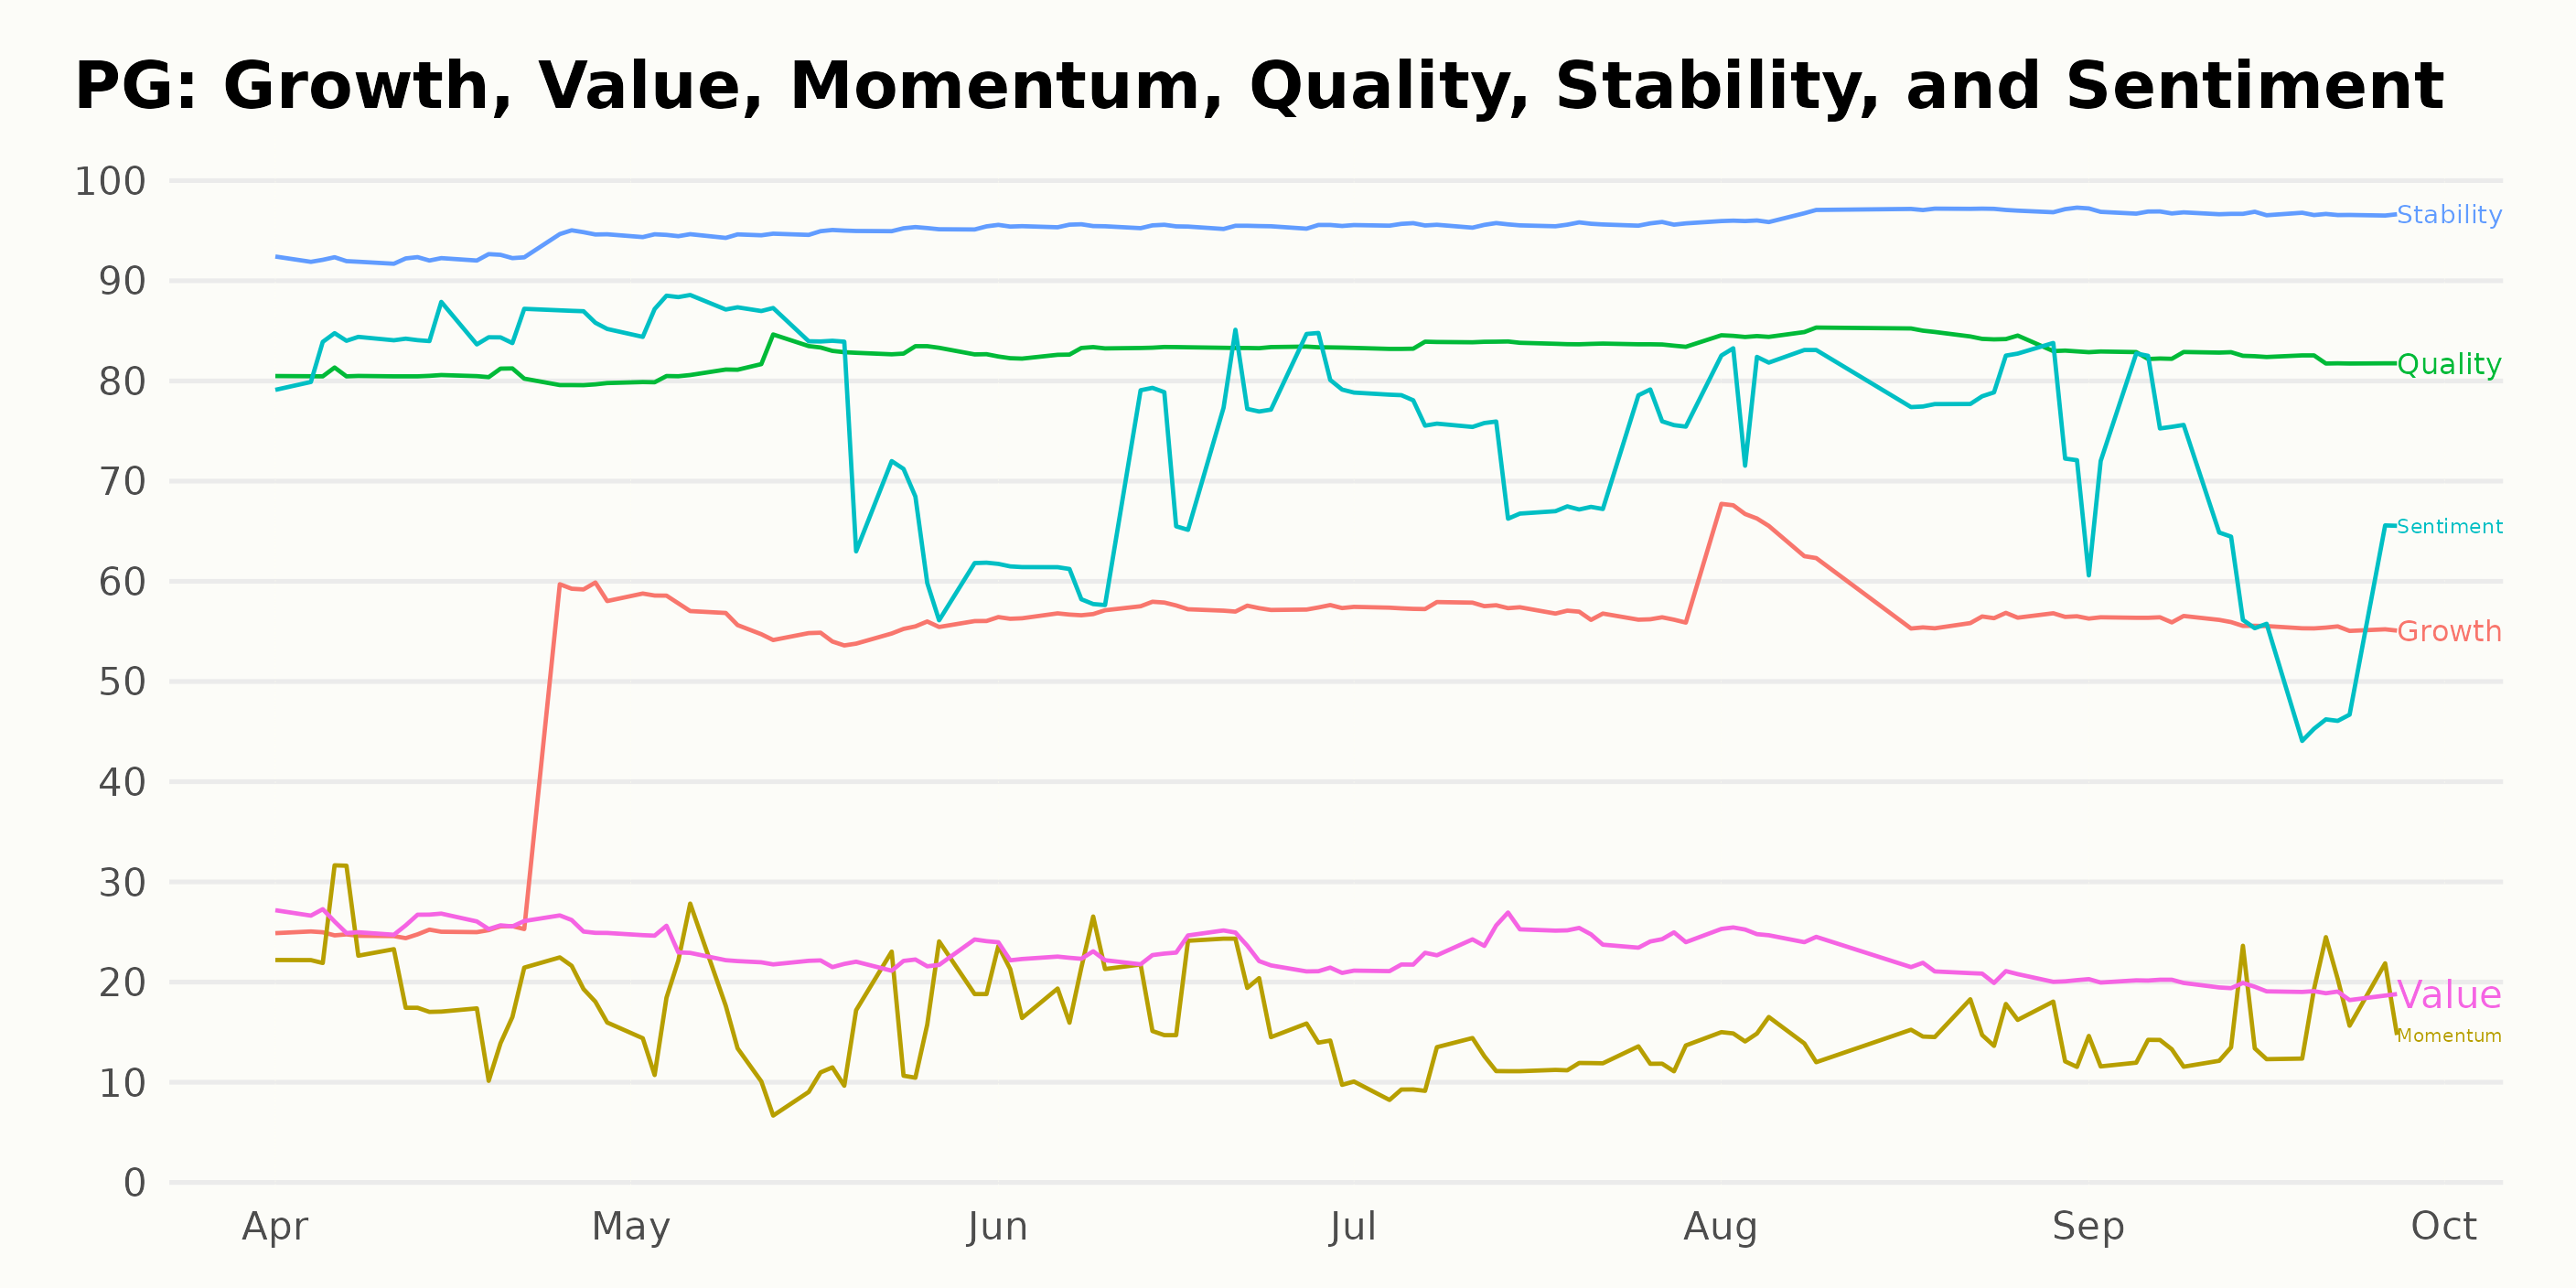
Analyzing Procter & Gamble's Stability, Quality, and Sentiment Performance Over Time
PG has an overall C rating, translating to a Neutral in our POWR Ratings system. It is ranked #19 out of the 53 stocks in the Consumer Goods category.
The three most noteworthy dimensions of the POWR Ratings for PG are Stability, Quality, and Sentiment. Here's a closer look at how each of them performed across the observed period:
- Stability: It indicates the volatility in the company’s financial performance and stock price. Across the evaluation period, this dimension has consistently been given the highest ratings, starting from 93 in April 2023 and gradually rising to a striking score of 97 in both August and September 2023. This constant improvement suggests a trend towards increased operational and market stability for Procter & Gamble Company.
- Quality: The Quality dimension turned out to be the second most significant aspect, displaying a relatively steady increase in the ratings from 80 in April 2023 to 84 in July, August, and September 2023. These consistently high and improving scores over time signal strong management practices and sound economic health.
- Sentiment: The Sentiment ratings have shown some variability across the observed period. Starting from an impressive score of 85 in April 2023, there was a slight dip in June 2023 to 71 before resurging back to 79 in August 2023 and finally dropping significantly to 62 in September 2023. Although these ratings have fluctuated, the Sentiment ratings remain notably elevated, pointing to general positivity among investors and analysts.
How does The Procter & Gamble Company (PG) Stack Up Against its Peers?
Other stocks in the Consumer Goods sector that may be worth considering are Acme United Corporation. (ACU), Henkel AG & Co. KGaA (HENKY), and Kimberly-Clark de México, S. A. B. de C. V. (KCDMY) -- they have better POWR Ratings.
What To Do Next?
Get your hands on this special report with 3 low priced companies with tremendous upside potential even in today’s volatile markets:
3 Stocks to DOUBLE This Year >
PG shares were trading at $146.01 per share on Thursday afternoon, down $1.33 (-0.90%). Year-to-date, PG has declined -1.84%, versus a 13.62% rise in the benchmark S&P 500 index during the same period.
About the Author: Subhasree Kar

Subhasree’s keen interest in financial instruments led her to pursue a career as an investment analyst. After earning a Master’s degree in Economics, she gained knowledge of equity research and portfolio management at Finlatics.
The post Is Procter & Gamble (PG) a Stable Stock Right Now? appeared first on StockNews.com