


Medical technology company Stryker (NYSE:SYK) reported revenue ahead of Wall Street’s expectations in Q4 CY2024, with sales up 10.7% year on year to $6.44 billion. Its non-GAAP profit of $4.01 per share was 3.5% above analysts’ consensus estimates.
Is now the time to buy Stryker? Find out by accessing our full research report, it’s free.
Stryker (SYK) Q4 CY2024 Highlights:
- Revenue: $6.44 billion vs analyst estimates of $6.35 billion (10.7% year-on-year growth, 1.4% beat)
- Adjusted EPS: $4.01 vs analyst estimates of $3.87 (3.5% beat)
- Adjusted EBITDA: $1.99 billion vs analyst estimates of $1.95 billion (30.9% margin, 1.8% beat)
- Operating Margin: 9%, down from 21.6% in the same quarter last year
- Free Cash Flow Margin: 25.9%, up from 23.8% in the same quarter last year
- Organic Revenue rose 10.2% year on year (11.4% in the same quarter last year)
- Market Capitalization: $148.8 billion
“We delivered another year of double-digit organic sales growth while continuing to expand adjusted operating margins and drive adjusted earnings per share growth,” said Kevin A. Lobo, Chair and Chief Executive Officer, Stryker.
Company Overview
Founded in 1941 as a specialty medical products business, Stryker Corporation today designs and sells a wide range of medical devices, equipment, and technology across areas like orthopedics (bones, joints, ligaments, etc.), surgical equipment, and spine.
Medical Devices & Supplies - Diversified
The medical devices industry operates a business model that balances steady demand with significant investments in innovation and regulatory compliance. The industry benefits from recurring revenue streams tied to consumables, maintenance services, and incremental upgrades to the latest technologies. However, the capital-intensive nature of product development, coupled with lengthy regulatory pathways and the need for clinical validation, can weigh on profitability and timelines. In addition, there are constant pricing pressures from healthcare systems and insurers maximizing cost efficiency. Over the next several years, one tailwind is demographic–aging populations means rising chronic disease rates that drive greater demand for medical interventions and monitoring solutions. Advances in digital health, such as remote patient monitoring and smart devices, are also expected to unlock new demand by shortening upgrade cycles. On the other hand, the industry faces headwinds from pricing and reimbursement pressures as healthcare providers increasingly adopt value-based care models. Additionally, the integration of cybersecurity for connected devices adds further risk and complexity for device manufacturers.
Sales Growth
Examining a company’s long-term performance can provide clues about its quality. Any business can put up a good quarter or two, but the best consistently grow over the long haul. Over the last five years, Stryker grew its sales at a decent 8.7% compounded annual growth rate. Its growth was slightly above the average healthcare company and shows its offerings resonate with customers.
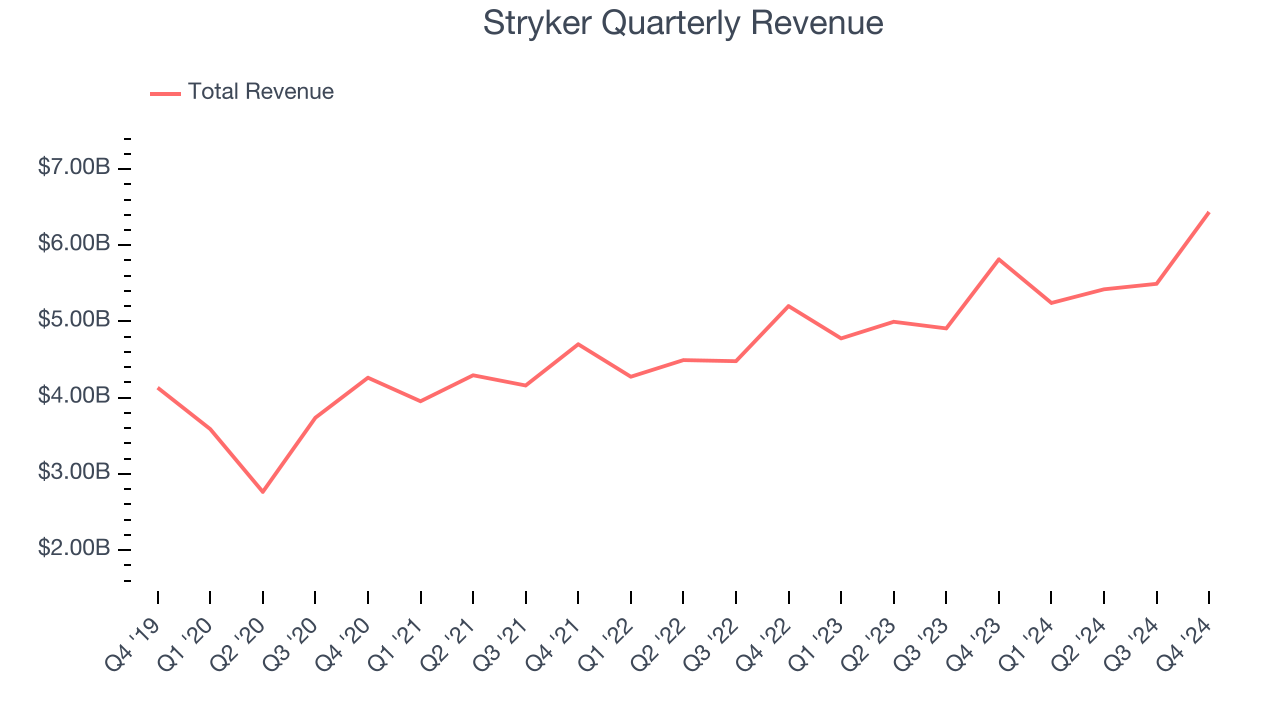
Long-term growth is the most important, but within healthcare, a half-decade historical view may miss new innovations or demand cycles. Stryker’s annualized revenue growth of 10.7% over the last two years is above its five-year trend, suggesting some bright spots. 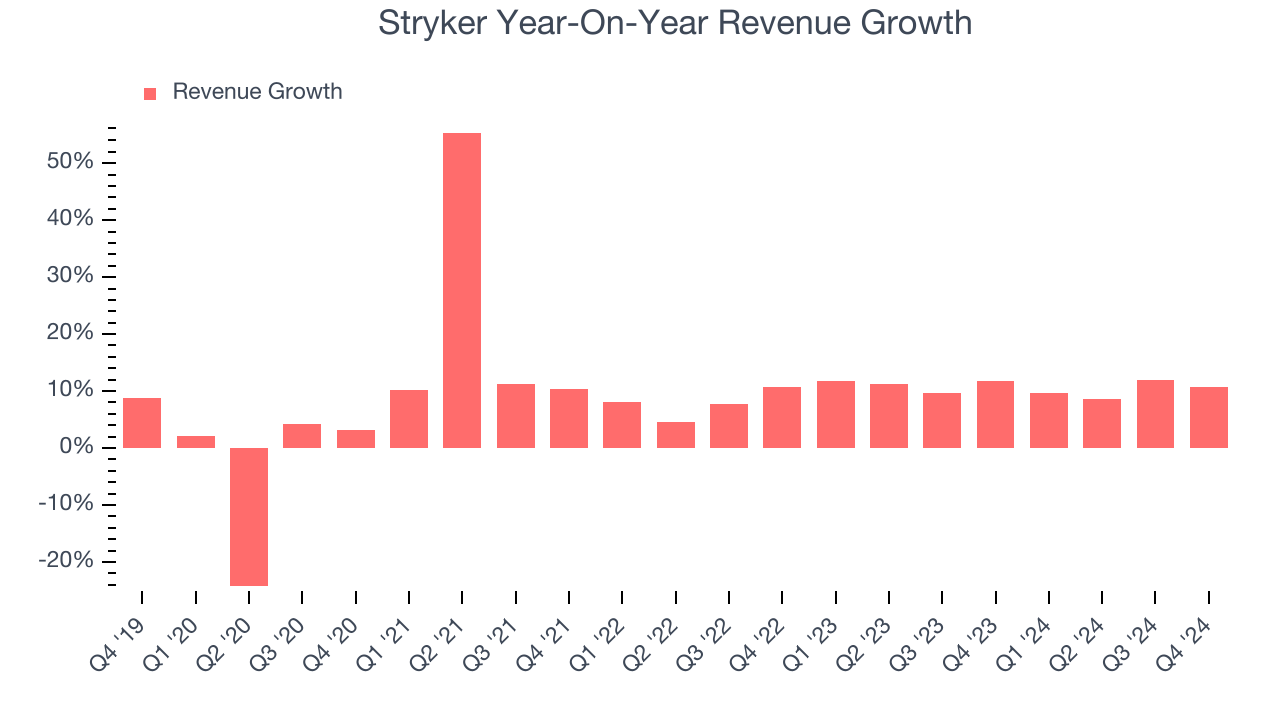
Stryker also reports organic revenue, which strips out one-time events like acquisitions and currency fluctuations that don’t accurately reflect its fundamentals. Over the last two years, Stryker’s organic revenue averaged 10.8% year-on-year growth. Because this number aligns with its normal revenue growth, we can see the company’s core operations (not acquisitions and divestitures) drove most of its results. 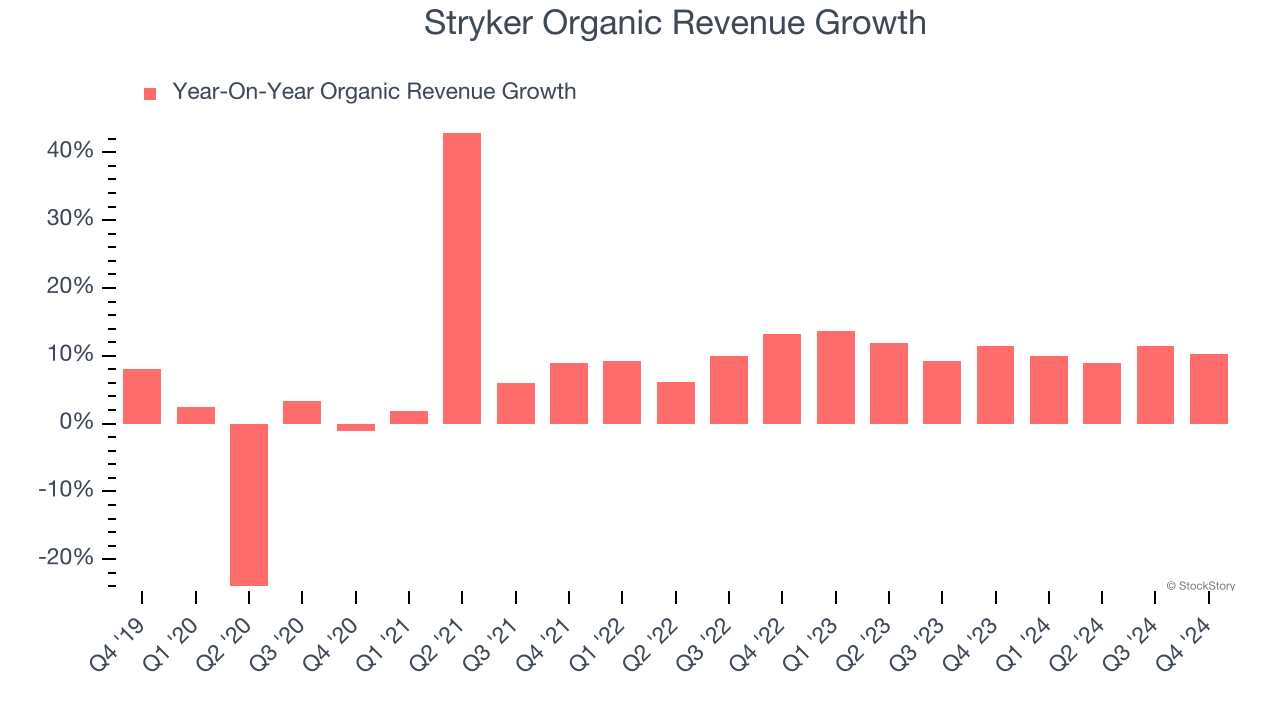
This quarter, Stryker reported year-on-year revenue growth of 10.7%, and its $6.44 billion of revenue exceeded Wall Street’s estimates by 1.4%.
Looking ahead, sell-side analysts expect revenue to grow 8.3% over the next 12 months, a slight deceleration versus the last two years. We still think its growth trajectory is attractive given its scale and suggests the market is factoring in success for its products and services.
Today’s young investors won’t have read the timeless lessons in Gorilla Game: Picking Winners In High Technology because it was written more than 20 years ago when Microsoft and Apple were first establishing their supremacy. But if we apply the same principles, then enterprise software stocks leveraging their own generative AI capabilities may well be the Gorillas of the future. So, in that spirit, we are excited to present our Special Free Report on a profitable, fast-growing enterprise software stock that is already riding the automation wave and looking to catch the generative AI next.
Adjusted Operating Margin
Adjusted operating margin is a key measure of profitability. Think of it as net income (the bottom line) excluding the impact of non-recurring expenses, taxes, and interest on debt - metrics less connected to business fundamentals.
Stryker has been an efficient company over the last five years. It was one of the more profitable businesses in the healthcare sector, boasting an average adjusted operating margin of 24.7%.
Analyzing the trend in its profitability, Stryker’s adjusted operating margin of 25.3% for the trailing 12 months may be around the same as five years ago, but it has increased by 1.5 percentage points over the last two years. This dynamic unfolded because its sales growth gave it operating leverage and shows it has some momentum on its side.
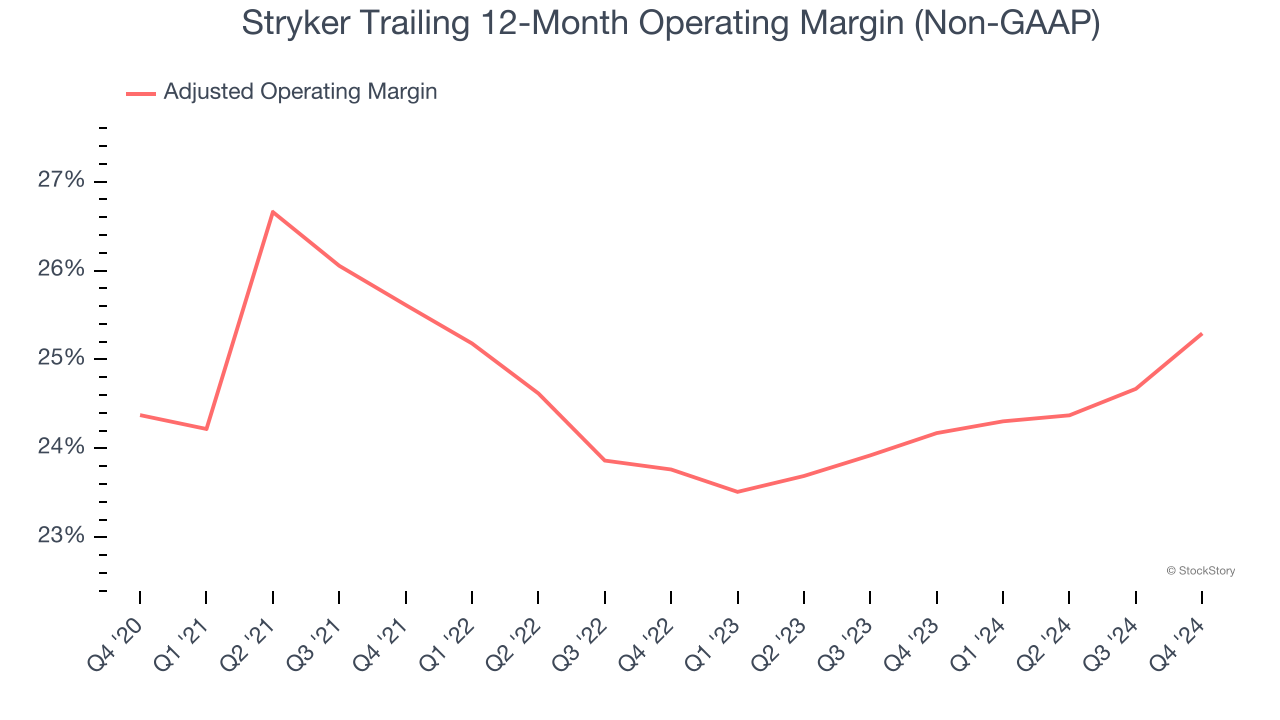
In Q4, Stryker generated an adjusted operating profit margin of 29.2%, up 1.9 percentage points year on year. This increase was a welcome development and shows it was recently more efficient because its expenses grew slower than its revenue.
Earnings Per Share
Revenue trends explain a company’s historical growth, but the long-term change in earnings per share (EPS) points to the profitability of that growth – for example, a company could inflate its sales through excessive spending on advertising and promotions.
Stryker’s solid 8.1% annual EPS growth over the last five years aligns with its revenue performance. This tells us it maintained its per-share profitability as it expanded.
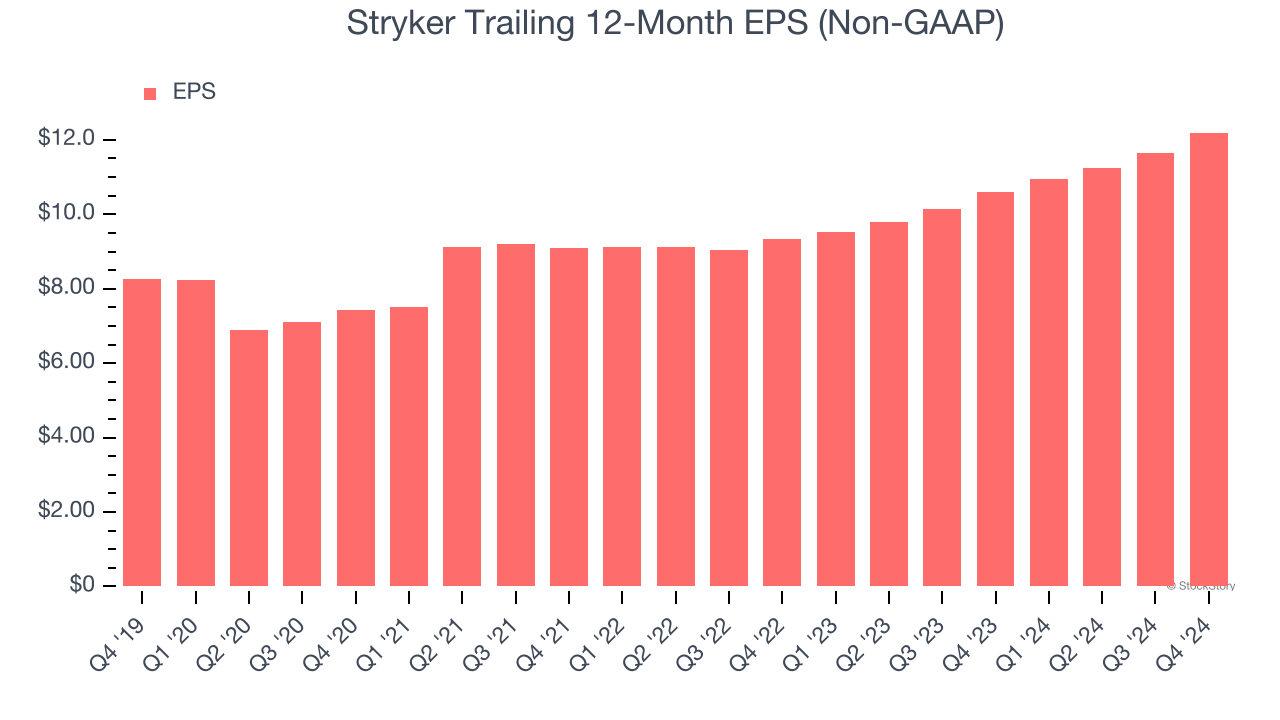
In Q4, Stryker reported EPS at $4.01, up from $3.46 in the same quarter last year. This print beat analysts’ estimates by 3.5%. Over the next 12 months, Wall Street expects Stryker’s full-year EPS of $12.19 to grow 10.4%.
Key Takeaways from Stryker’s Q4 Results
It was good to see Stryker narrowly top analysts’ organic revenue expectations this quarter. Overall, this quarter had some key positives. The stock remained flat at $391.30 immediately after reporting.
Is Stryker an attractive investment opportunity at the current price? We think that the latest quarter is only one piece of the longer-term business quality puzzle. Quality, when combined with valuation, can help determine if the stock is a buy. We cover that in our actionable full research report which you can read here, it’s free.
